| Param | Original file | Final file |
|---|---|---|
| Filename | modeM0/AS1T05_067T01_9000005432_39115cztM0_level2.fits | modeM0/AS1T05_067T01_9000005432_39115cztM0_level2_quad_clean.evt |
| Size (bytes) | 393,134,400 | 95,048,640 |
| Size | 374.9 MB | 90.6 MB |
| Events in quadrant A | 3,126,837 | 656,875 |
| Events in quadrant B | 2,432,814 | 668,024 |
| Events in quadrant C | 2,789,085 | 619,508 |
| Events in quadrant D | 5,796,727 | 566,949 |
| Mode M0 | |||
|---|---|---|---|
| Quadrant | BADHDUFLAG | Total packets | Discarded packets |
| A | 0 | 12677 | 3 |
| B | 0 | 10653 | 2 |
| C | 0 | 11631 | 2 |
| D | 0 | 20995 | 2 |
| Mode SS | |||
|---|---|---|---|
| Quadrant | BADHDUFLAG | Total packets | Discarded packets |
| A | 0 | 106 | 0 |
| B | 0 | 106 | 0 |
| C | 0 | 106 | 0 |
| D | 0 | 106 | 0 |
| Mode M9 | |||
|---|---|---|---|
| Quadrant | BADHDUFLAG | Total packets | Discarded packets |
| A | 0 | 22 | 0 |
| B | 0 | 22 | 0 |
| C | 0 | 22 | 0 |
| D | 0 | 23 | 0 |
| Quadrant | Total seconds | Saturated seconds | Saturation percentage |
|---|---|---|---|
| A | 5242 | 29 | 0.553224% |
| B | 5242 | 8 | 0.152614% |
| C | 5242 | 7 | 0.133537% |
| D | 5242 | 163 | 3.109500% |
Noise dominated data is calculated using 1-second bins in cleaned event files. If a bin has >2000 counts, and if more than 50% of those come from <1% of pixels, then it is considered to be noise-dominated and hence unusable.
| Quadrant | # 1 sec bins | Bins with >0 counts | Bins with >2000 counts | High rate bins dominated by noise | Noise dominated (total time) | Noise dominated (detector-on time) | Marked lightcurve |
|---|---|---|---|---|---|---|---|
| A | 7365 | 5243 | 18 | 18 | 0.24% | 0.34% | 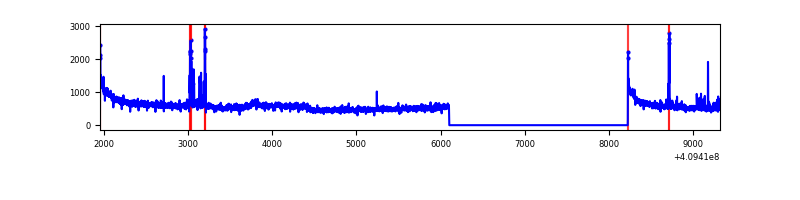 |
| B | 7365 | 5243 | 2 | 2 | 0.03% | 0.04% | 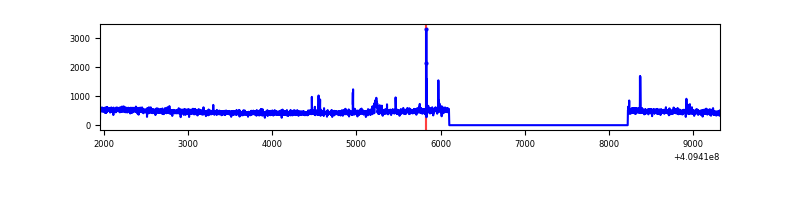 |
| C | 7365 | 5243 | 4 | 4 | 0.05% | 0.08% | 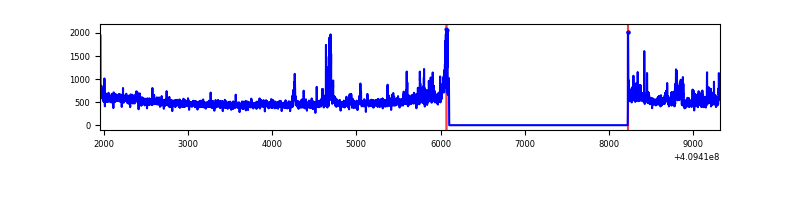 |
| D | 7365 | 5243 | 193 | 193 | 2.62% | 3.68% | 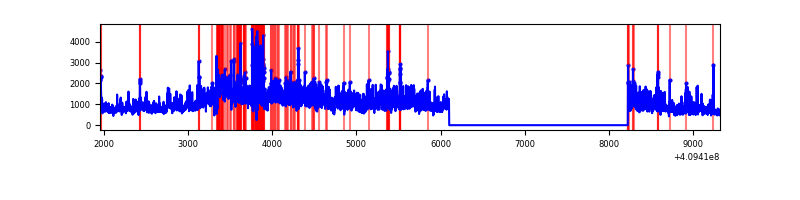 |
Top three noisy pixels from each quadrant. If the there are fewer than three noisy pixels in the level2.evt file, extra rows are filled as -1
| Pixel properties | Quadrant properties | ||||||
|---|---|---|---|---|---|---|---|
| Quadrant | DetID | PixID | Counts | Sigma | Mean | Median | Sigma |
| A | 10 | 83 | 423618 | 3453.62 | 610 | 599 | 122.5 |
| A | 15 | 223 | 202113 | 1645.2 | 610 | 599 | 122.5 |
| A | 9 | 143 | 89886 | 728.96 | 610 | 599 | 122.5 |
| B | 5 | 184 | 27569 | 233.99 | 603 | 587 | 115.3 |
| B | 5 | 172 | 21059 | 177.54 | 603 | 587 | 115.3 |
| B | 12 | 111 | 14365 | 119.49 | 603 | 587 | 115.3 |
| C | 15 | 208 | 230141 | 1711.54 | 578 | 583 | 134.1 |
| C | 15 | 214 | 222416 | 1653.95 | 578 | 583 | 134.1 |
| C | 9 | 187 | 73369 | 542.68 | 578 | 583 | 134.1 |
| D | 12 | 235 | 1733112 | 12234.23 | 575 | 559 | 141.6 |
| D | 5 | 222 | 1570206 | 11083.89 | 575 | 559 | 141.6 |
| D | 12 | 233 | 99911 | 701.56 | 575 | 559 | 141.6 |
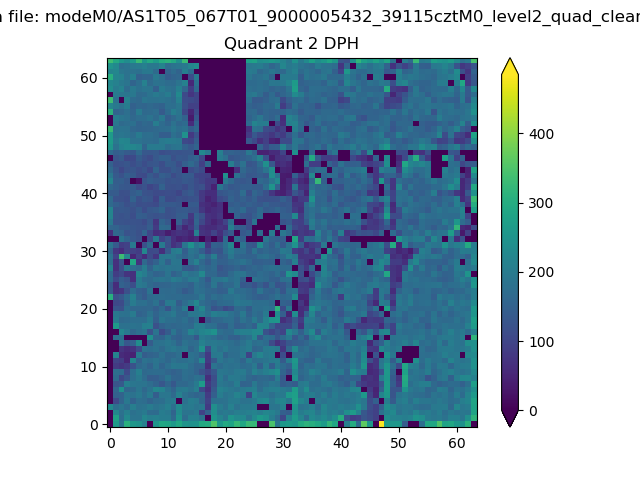
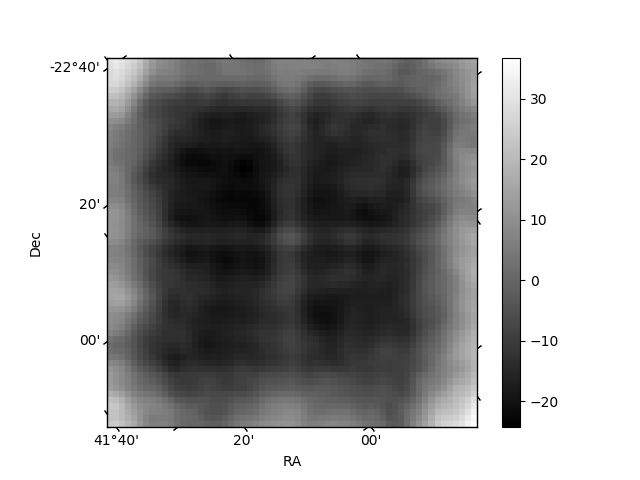
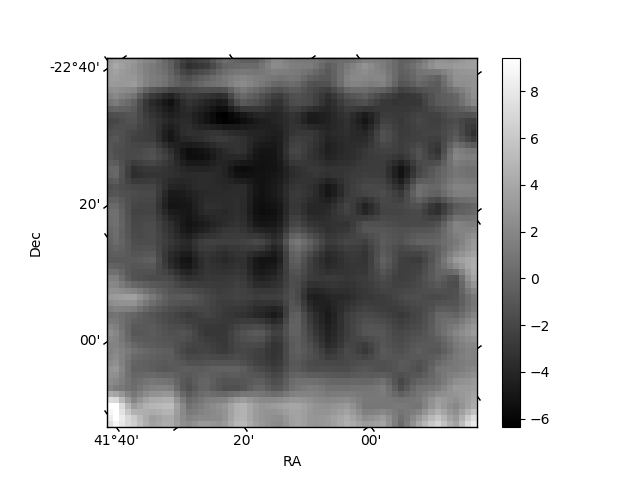
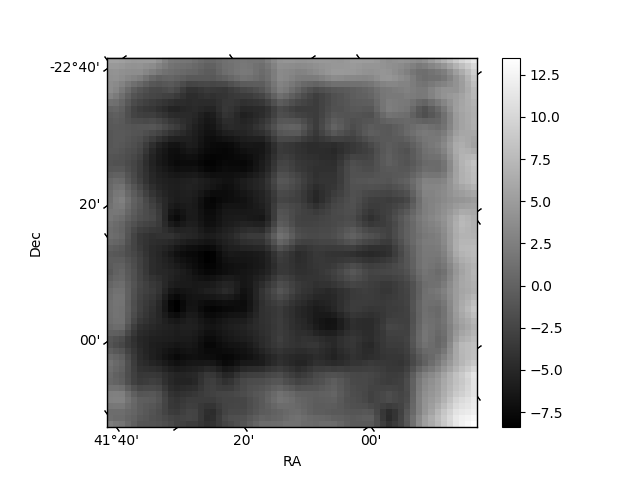
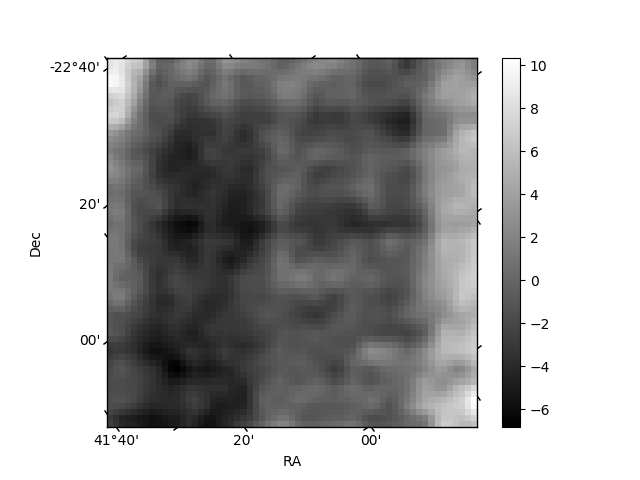
Histogram calculated using DETX and DETY for each event in the final _common_clean file
| Quadrant A | 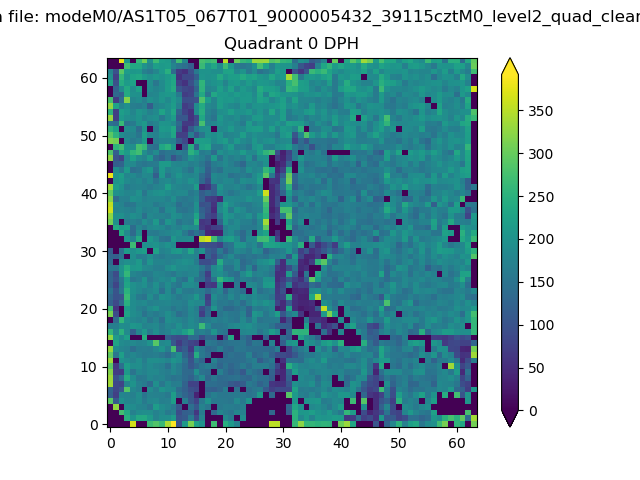 |
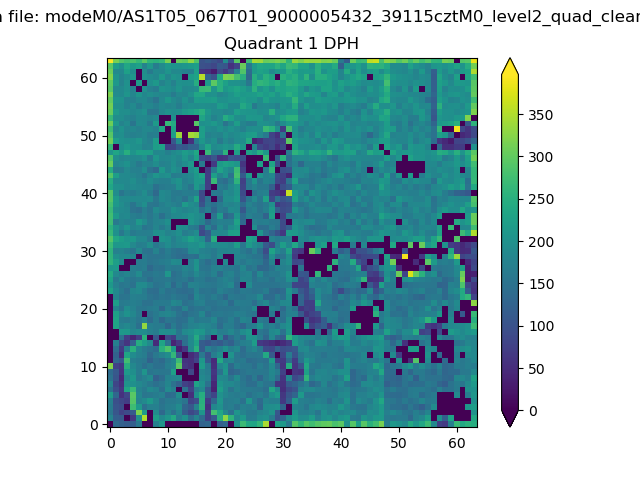 |
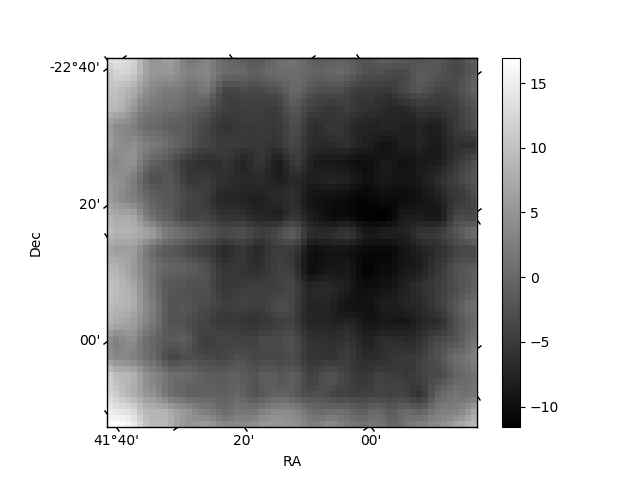
Quadrant B |
|---|---|---|---|
| Quadrant D | 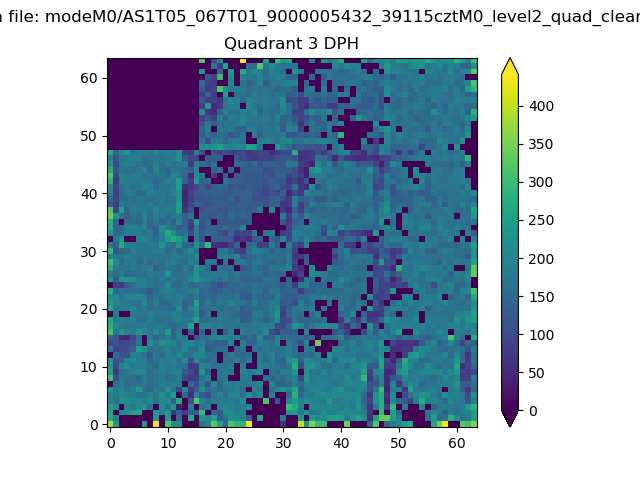 |
 |
Quadrant C |
| Plot type | Count rate plots | Images |
|---|---|---|
| Comparison with Poisson distribution Blue bars denote a histogram of data divided into 1 sec bins. Red curve is a Poisson curve with rate = median count rate of data. |
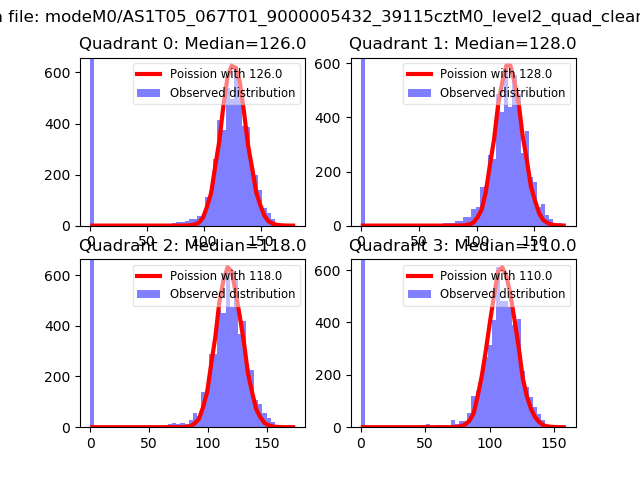 |
 |
| Quadrant-wise count rates Data is divided into 100 sec bins |
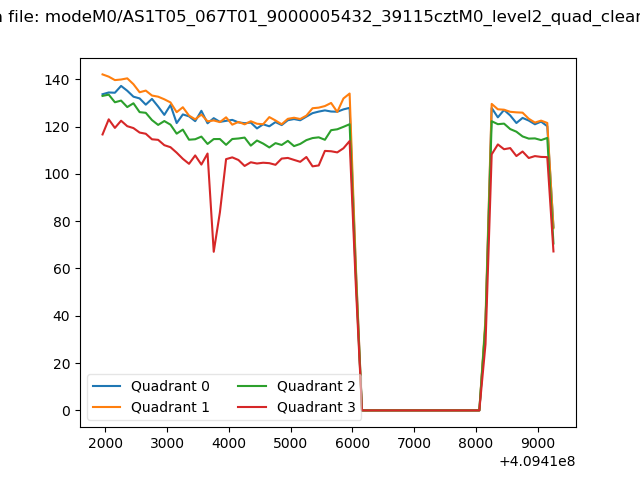 |
|
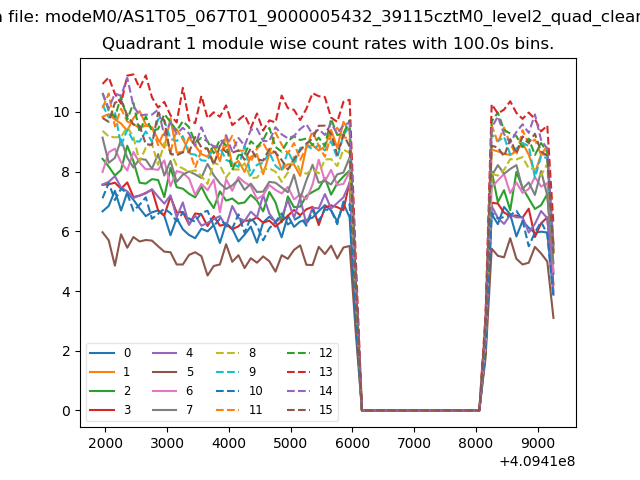
| Module-wise count rates for Quadrant A Data is divided into 100 sec bins |
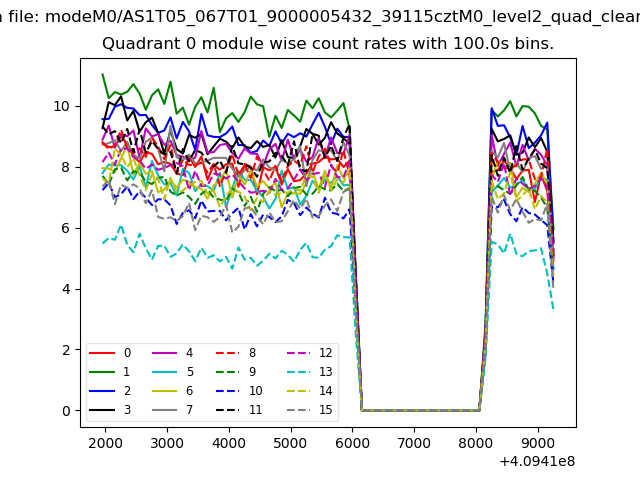 |
 |
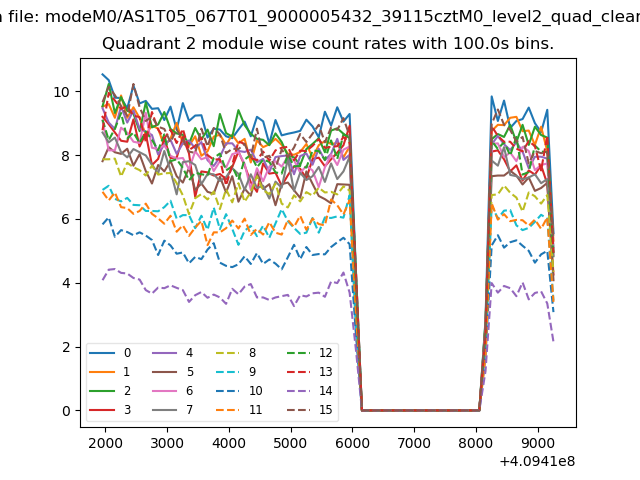
| Module-wise count rates for Quadrant B Data is divided into 100 sec bins |
 |
 |
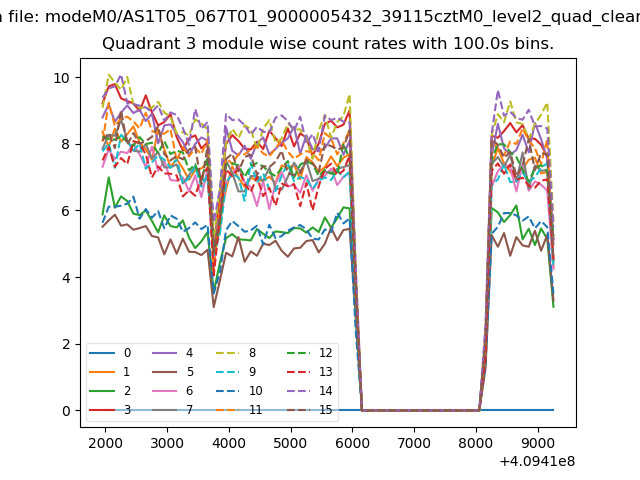
| Module-wise count rates for Quadrant C Data is divided into 100 sec bins |
 |
 |
| Module-wise count rates for Quadrant D Data is divided into 100 sec bins |
 |
 |
| Parameter | Plot |
|---|---|
| CZT HV Monitor | 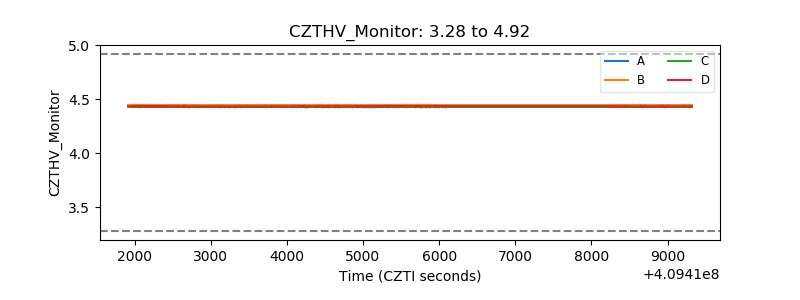 |
| D_VDD | 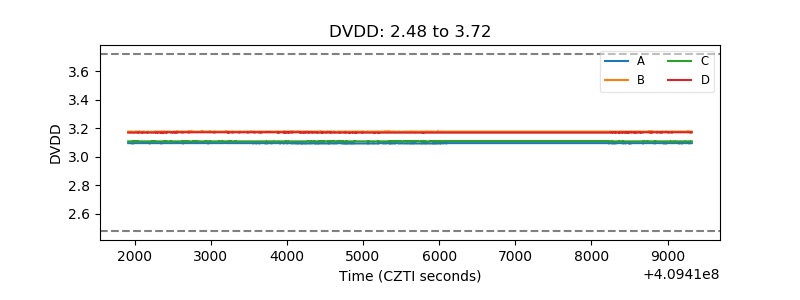 |
| Temperature 1 | 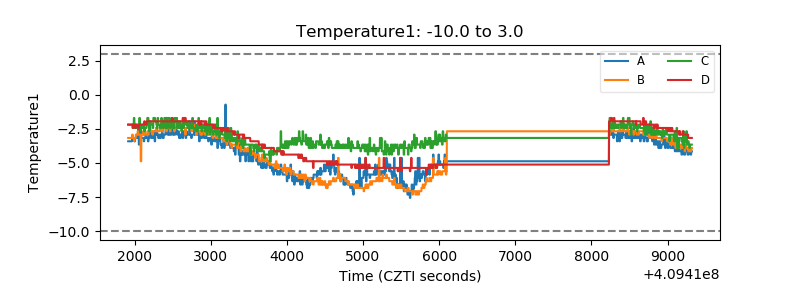 |
| Veto HV Monitor | 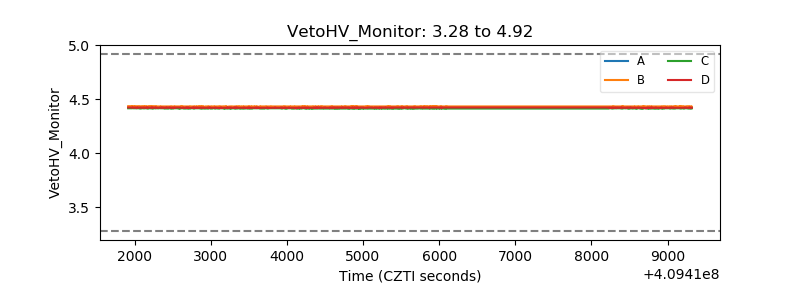 |
| Veto LLD | 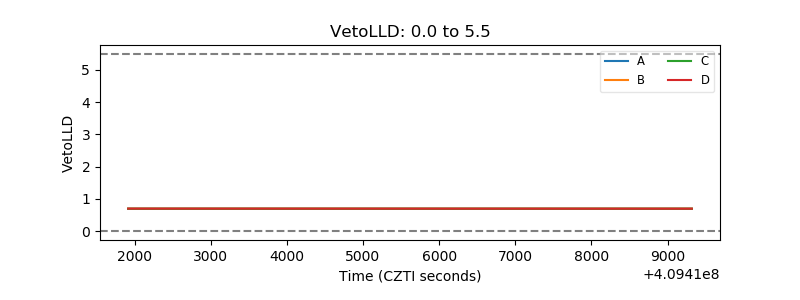 |
| Alpha Counter | 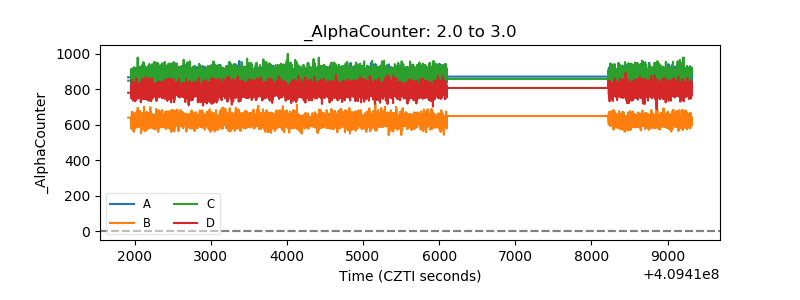 |
| _CPM_Rate | 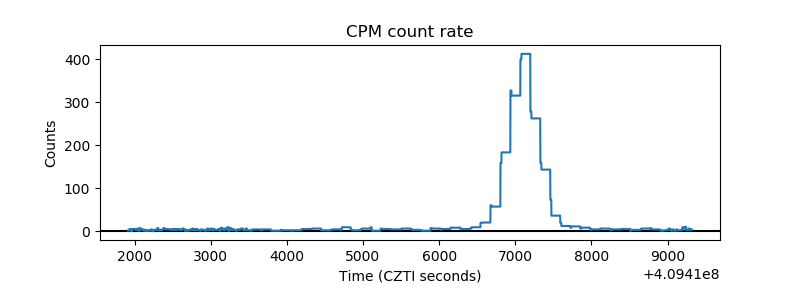 |
| CZT Counter | 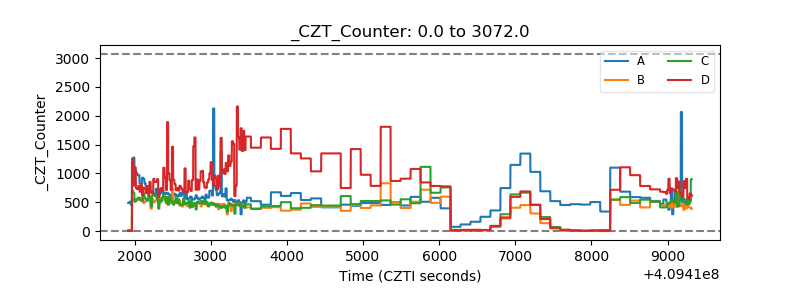 |
| +2.5 Volts monitor | 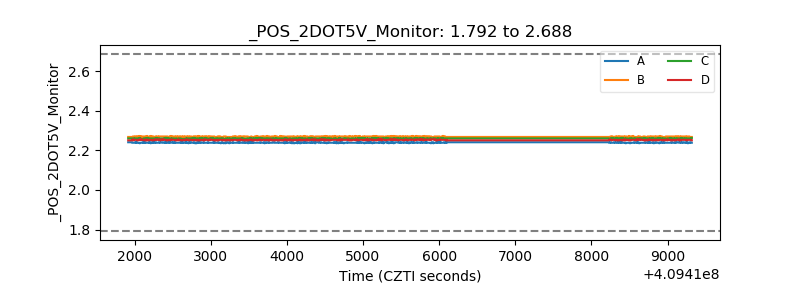 |
| +5 Volts monitor |  |
| _ROLL_ROT | 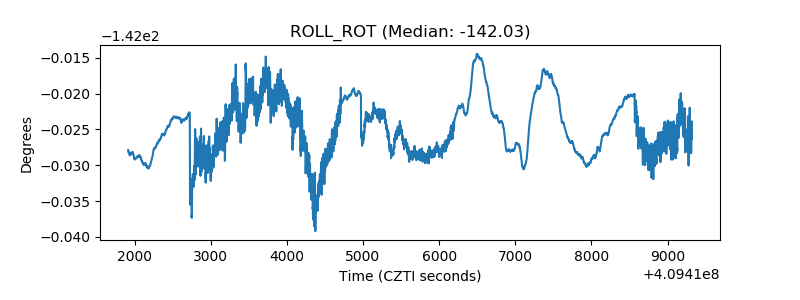 |
| _Roll_DEC | 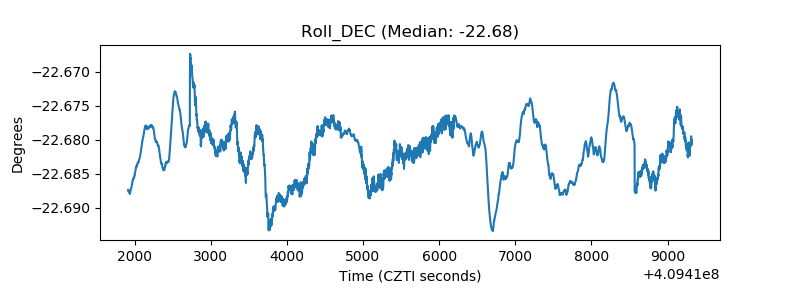 |
| _Roll_RA | 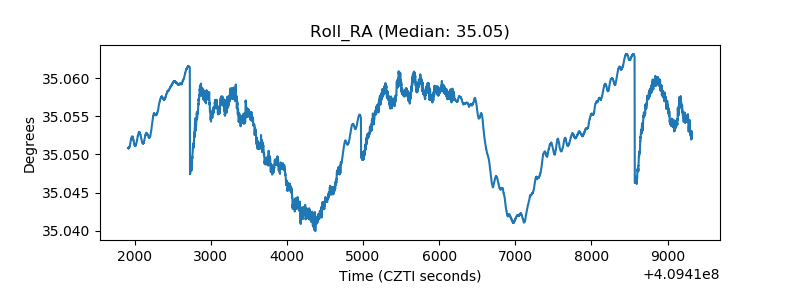 |
| Veto Counter | 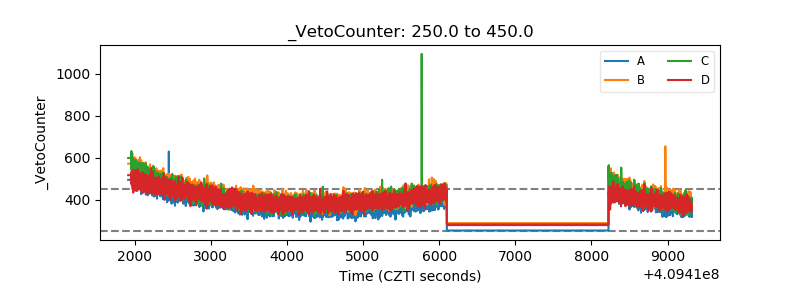 |