| Param | Original file | Final file |
|---|---|---|
| Filename | modeM0/AS1T05_067T01_9000005432_39116cztM0_level2.fits | modeM0/AS1T05_067T01_9000005432_39116cztM0_level2_quad_clean.evt |
| Size (bytes) | 249,526,080 | 62,671,680 |
| Size | 238.0 MB | 59.8 MB |
| Events in quadrant A | 2,054,860 | 436,780 |
| Events in quadrant B | 1,712,646 | 436,347 |
| Events in quadrant C | 2,319,282 | 393,034 |
| Events in quadrant D | 2,858,322 | 367,672 |
| Mode M0 | |||
|---|---|---|---|
| Quadrant | BADHDUFLAG | Total packets | Discarded packets |
| A | 0 | 10642 | 2156 |
| B | 0 | 9867 | 2234 |
| C | 0 | 12809 | 3586 |
| D | 0 | 14098 | 2970 |
| Mode SS | |||
|---|---|---|---|
| Quadrant | BADHDUFLAG | Total packets | Discarded packets |
| A | 0 | 101 | 25 |
| B | 0 | 102 | 18 |
| C | 0 | 101 | 21 |
| D | 0 | 100 | 22 |
| Mode M9 | |||
|---|---|---|---|
| Quadrant | BADHDUFLAG | Total packets | Discarded packets |
| A | 0 | 18 | 3 |
| B | 0 | 18 | 3 |
| C | 0 | 18 | 4 |
| D | 0 | 19 | 2 |
| Quadrant | Total seconds | Saturated seconds | Saturation percentage |
|---|---|---|---|
| A | 3796 | 10 | 0.263435% |
| B | 3775 | 2 | 0.052980% |
| C | 3629 | 6 | 0.165335% |
| D | 3681 | 37 | 1.005162% |
Noise dominated data is calculated using 1-second bins in cleaned event files. If a bin has >2000 counts, and if more than 50% of those come from <1% of pixels, then it is considered to be noise-dominated and hence unusable.
| Quadrant | # 1 sec bins | Bins with >0 counts | Bins with >2000 counts | High rate bins dominated by noise | Noise dominated (total time) | Noise dominated (detector-on time) | Marked lightcurve |
|---|---|---|---|---|---|---|---|
| A | 6959 | 4127 | 7 | 7 | 0.10% | 0.17% | 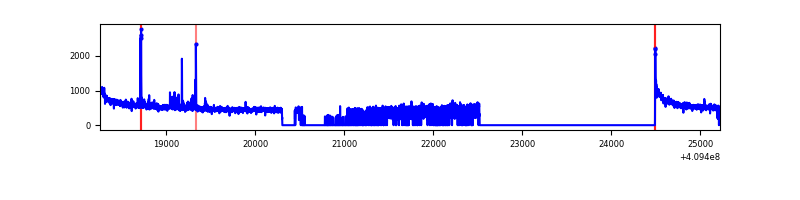 |
| B | 6962 | 4118 | 0 | 0 | 0.00% | 0.00% | 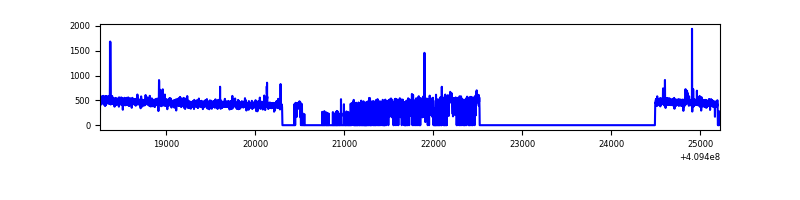 |
| C | 6968 | 3963 | 3 | 3 | 0.04% | 0.08% | 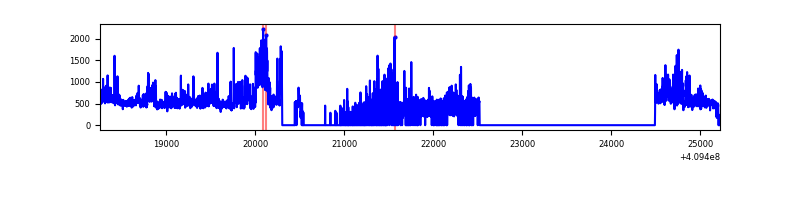 |
| D | 6958 | 4038 | 31 | 31 | 0.45% | 0.77% | 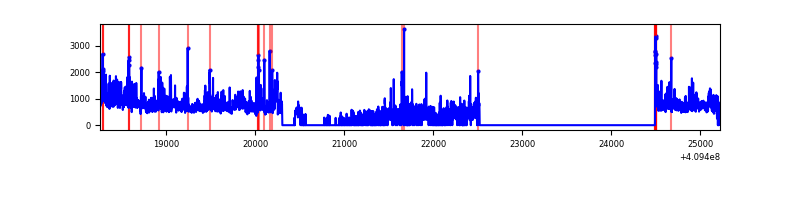 |
Top three noisy pixels from each quadrant. If the there are fewer than three noisy pixels in the level2.evt file, extra rows are filled as -1
| Pixel properties | Quadrant properties | ||||||
|---|---|---|---|---|---|---|---|
| Quadrant | DetID | PixID | Counts | Sigma | Mean | Median | Sigma |
| A | 10 | 83 | 330814 | 3779.63 | 429 | 421 | 87.4 |
| A | 13 | 248 | 57815 | 656.58 | 429 | 421 | 87.4 |
| A | 13 | 254 | 8392 | 91.19 | 429 | 421 | 87.4 |
| B | 5 | 184 | 14279 | 168.74 | 424 | 414 | 82.2 |
| B | 0 | 199 | 13179 | 155.35 | 424 | 414 | 82.2 |
| B | 12 | 111 | 10019 | 116.89 | 424 | 414 | 82.2 |
| C | 15 | 208 | 617603 | 6720.7 | 389 | 392 | 91.8 |
| C | 15 | 214 | 157583 | 1711.62 | 389 | 392 | 91.8 |
| C | 9 | 187 | 17687 | 188.32 | 389 | 392 | 91.8 |
| D | 12 | 235 | 862300 | 8938.86 | 394 | 384 | 96.4 |
| D | 5 | 222 | 176497 | 1826.45 | 394 | 384 | 96.4 |
| D | 2 | 249 | 92445 | 954.76 | 394 | 384 | 96.4 |
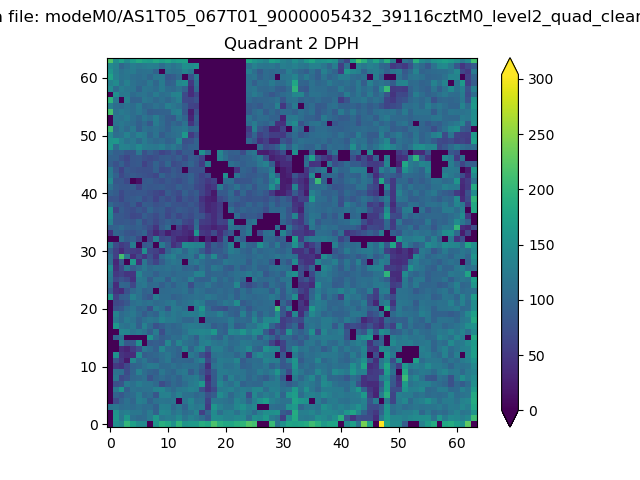
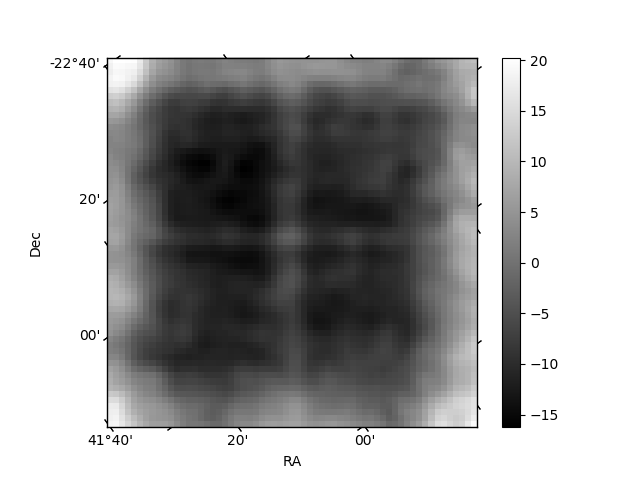
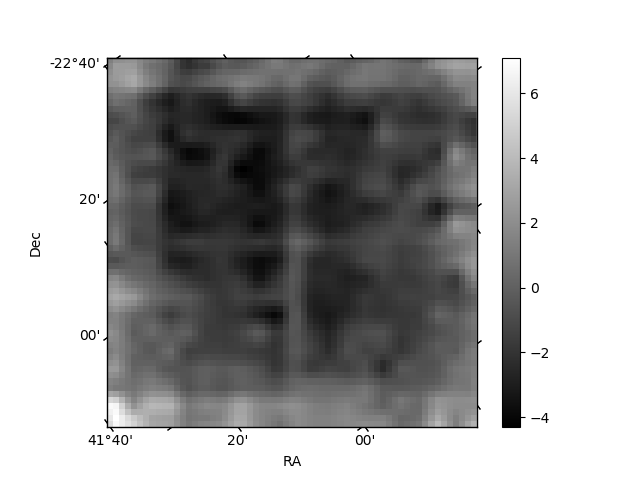
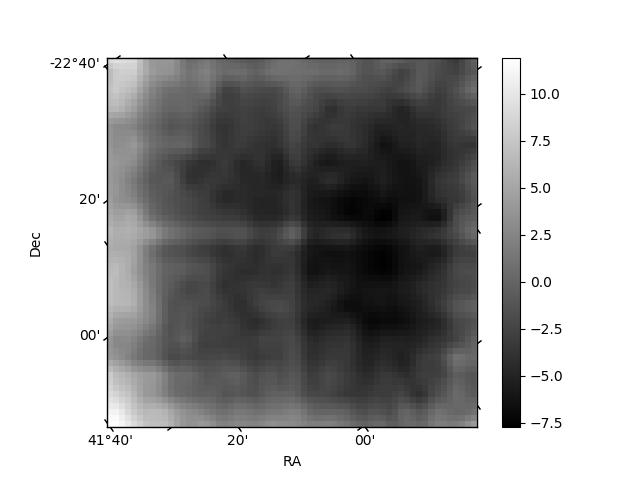
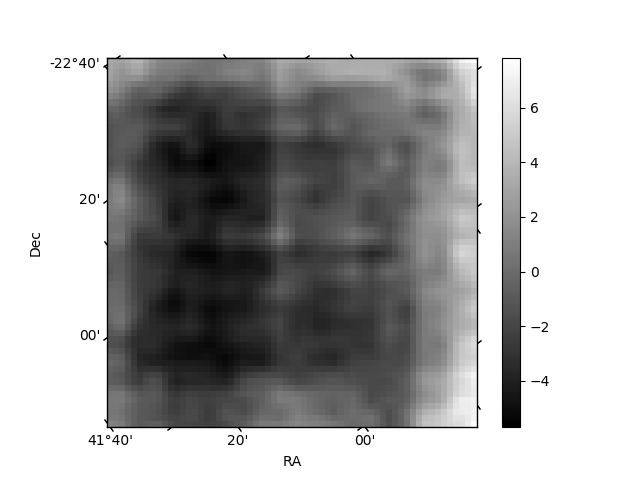
Histogram calculated using DETX and DETY for each event in the final _common_clean file
| Quadrant A | 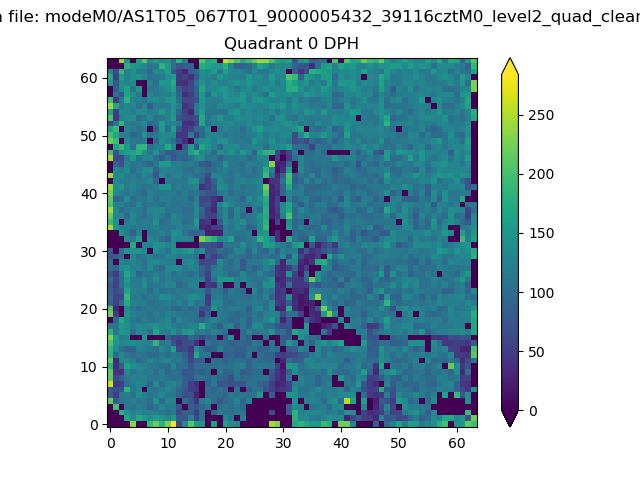 |
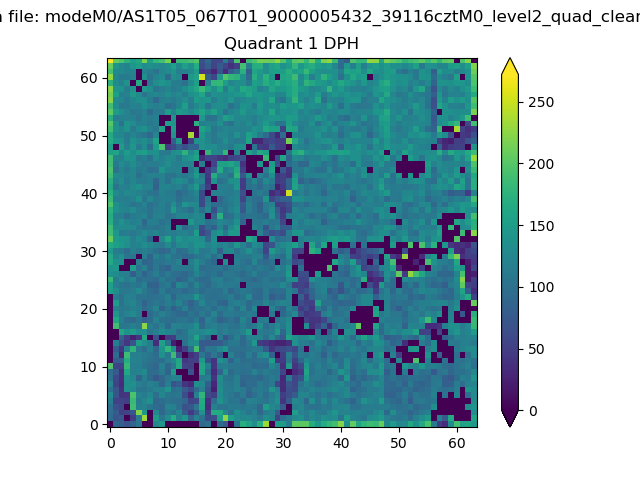 |
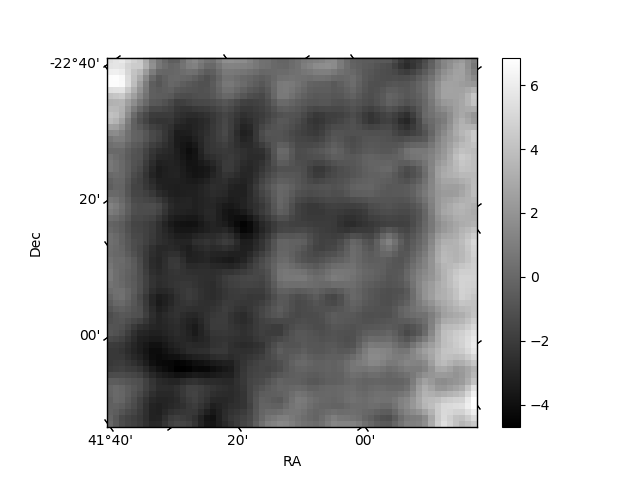
Quadrant B |
|---|---|---|---|
| Quadrant D | 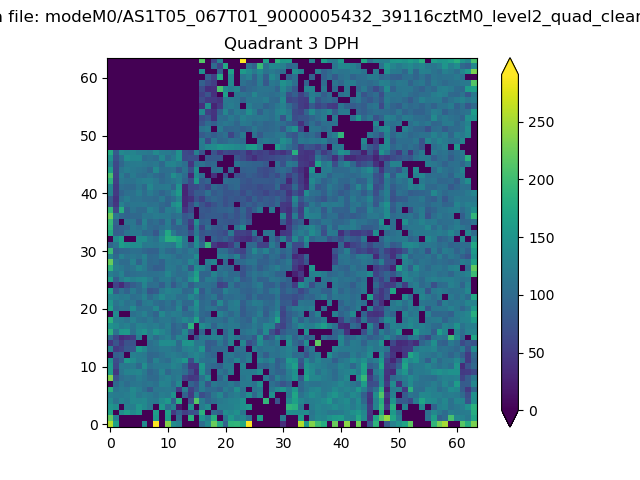 |
 |
Quadrant C |
| Plot type | Count rate plots | Images |
|---|---|---|
| Comparison with Poisson distribution Blue bars denote a histogram of data divided into 1 sec bins. Red curve is a Poisson curve with rate = median count rate of data. |
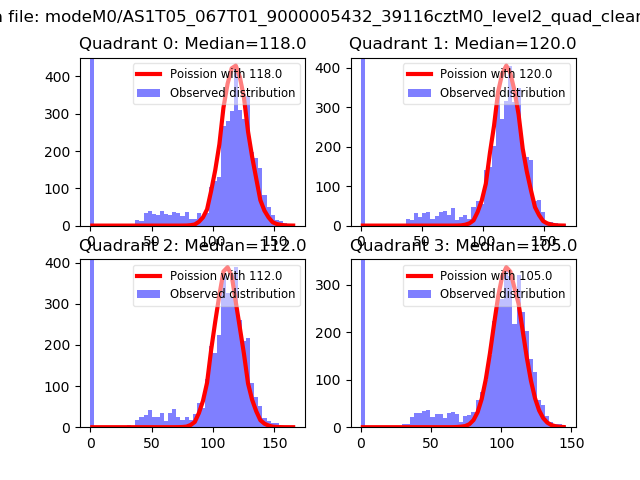 |
 |
| Quadrant-wise count rates Data is divided into 100 sec bins |
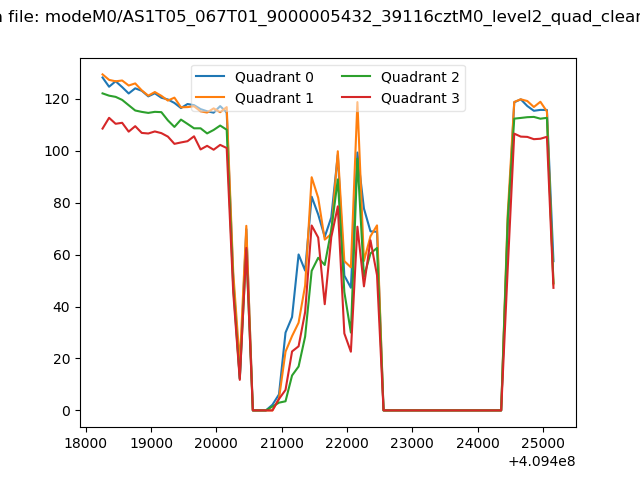 |
|
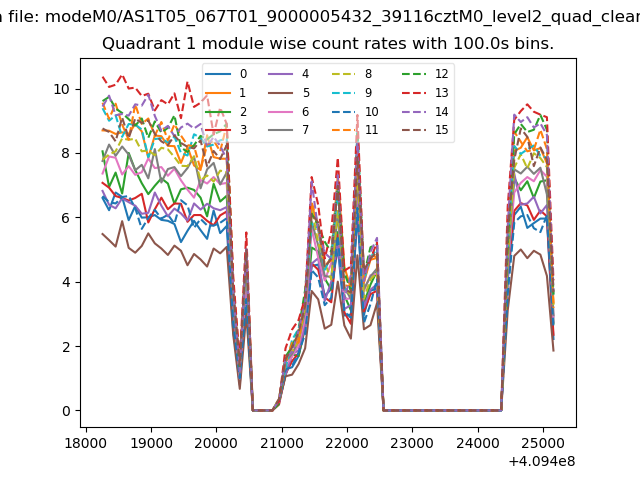
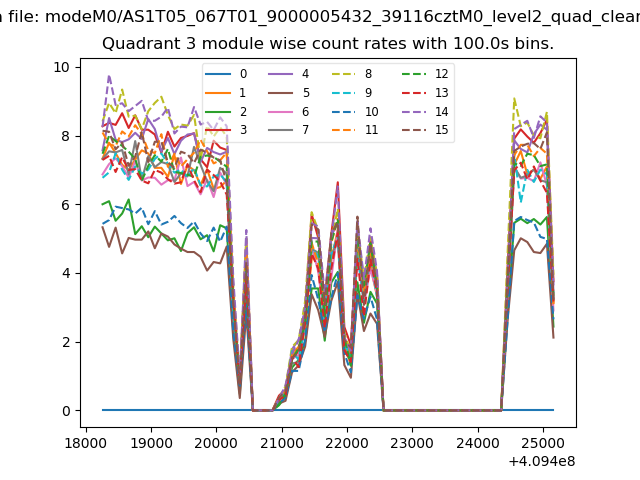
| Module-wise count rates for Quadrant A Data is divided into 100 sec bins |
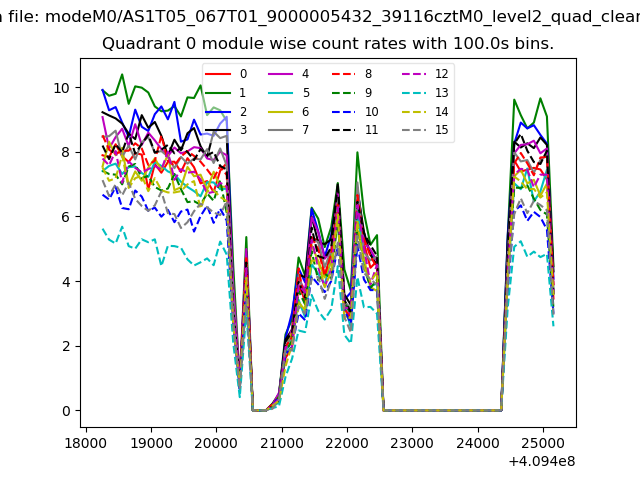 |
 |
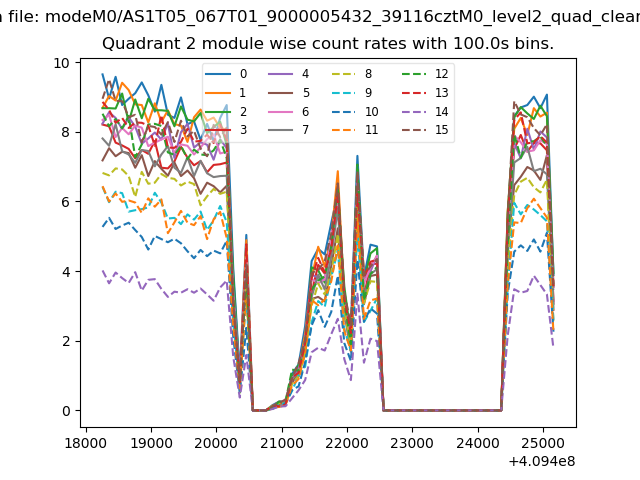
| Module-wise count rates for Quadrant B Data is divided into 100 sec bins |
 |
 |
| Module-wise count rates for Quadrant C Data is divided into 100 sec bins |
 |
 |
| Module-wise count rates for Quadrant D Data is divided into 100 sec bins |
 |
 |
| Parameter | Plot |
|---|---|
| CZT HV Monitor | 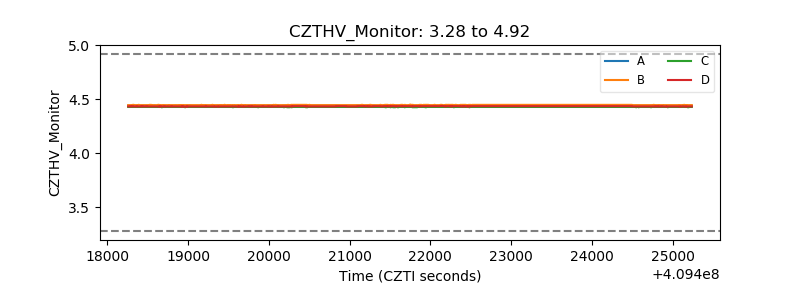 |
| D_VDD | 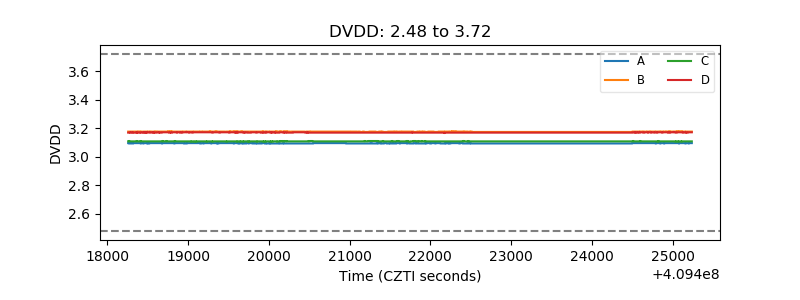 |
| Temperature 1 | 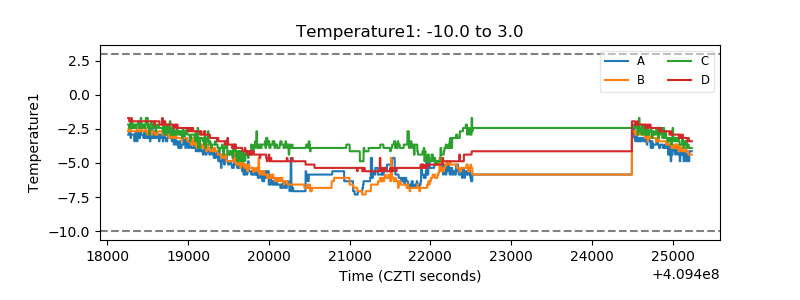 |
| Veto HV Monitor |  |
| Veto LLD | 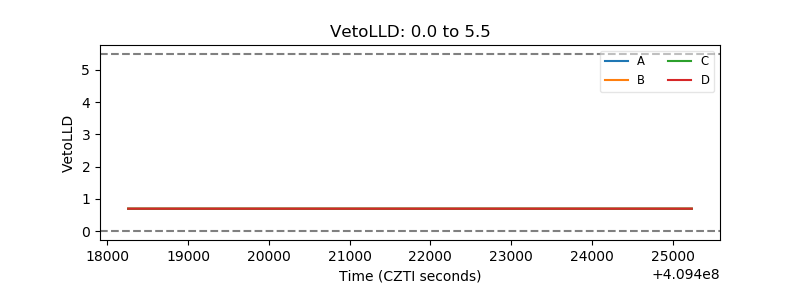 |
| Alpha Counter | 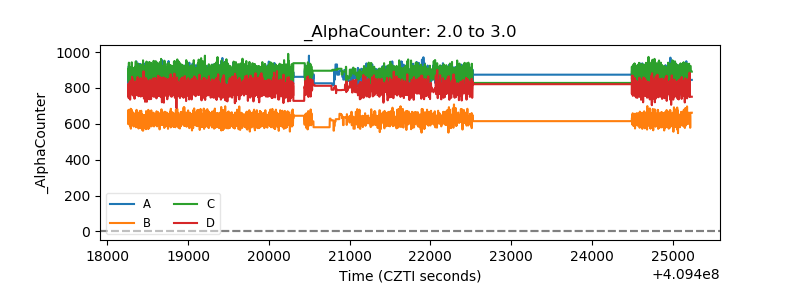 |
| _CPM_Rate | 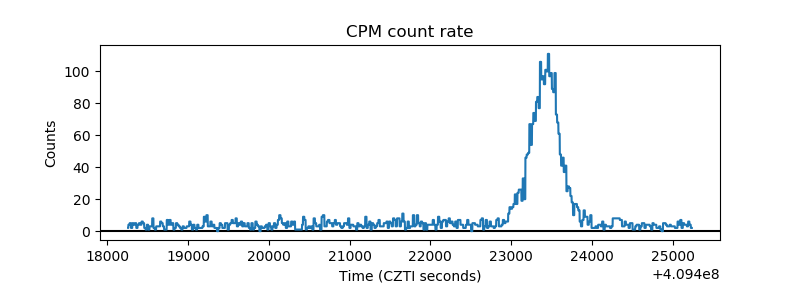 |
| CZT Counter | 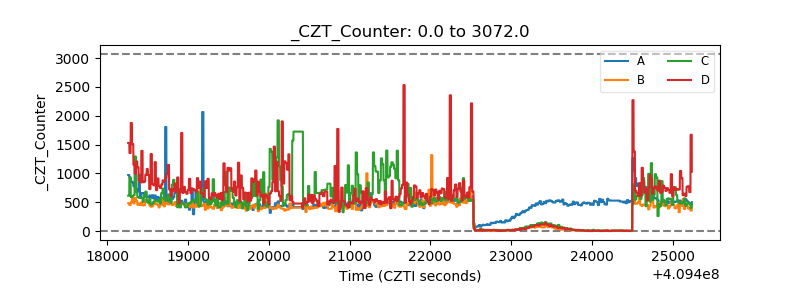 |
| +2.5 Volts monitor | 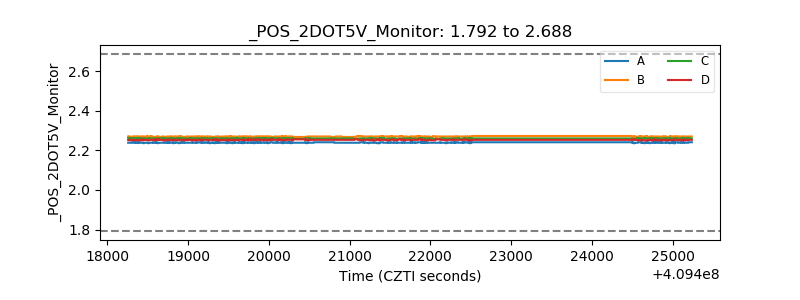 |
| +5 Volts monitor | 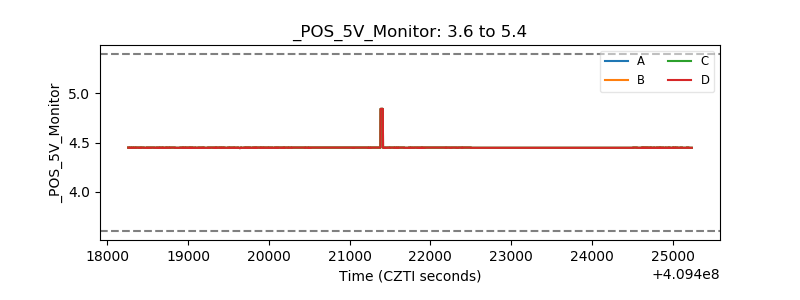 |
| _ROLL_ROT | 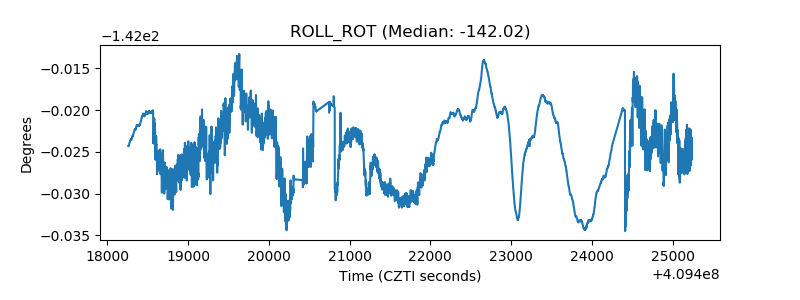 |
| _Roll_DEC | 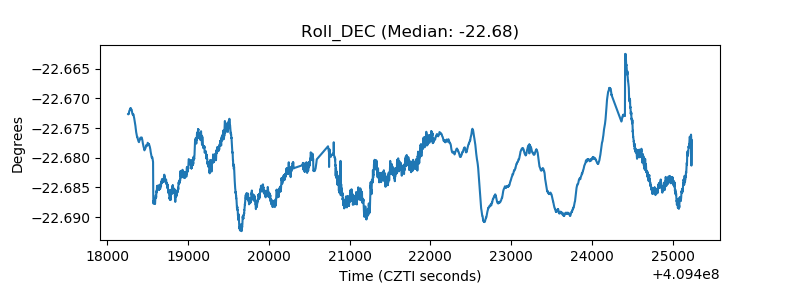 |
| _Roll_RA | 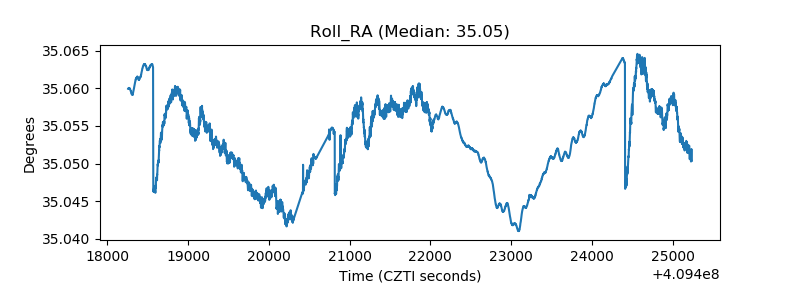 |
| Veto Counter | 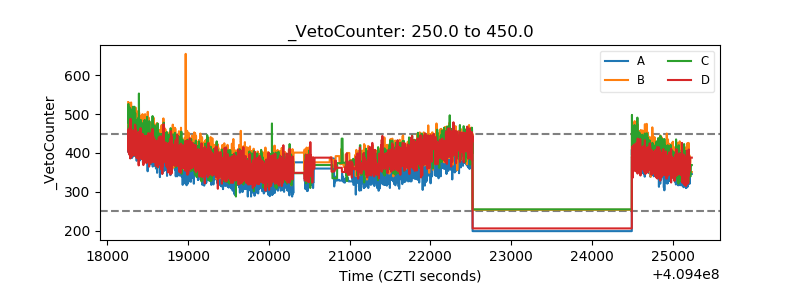 |