| Param | Original file | Final file |
|---|---|---|
| Filename | modeM0/AS1T05_067T01_9000005432_39117cztM0_level2.fits | modeM0/AS1T05_067T01_9000005432_39117cztM0_level2_quad_clean.evt |
| Size (bytes) | 91,287,360 | 23,512,320 |
| Size | 87.1 MB | 22.4 MB |
| Events in quadrant A | 745,142 | 158,113 |
| Events in quadrant B | 596,379 | 159,830 |
| Events in quadrant C | 808,935 | 150,718 |
| Events in quadrant D | 1,119,000 | 140,952 |
| Mode M0 | |||
|---|---|---|---|
| Quadrant | BADHDUFLAG | Total packets | Discarded packets |
| A | 0 | 3092 | 1 |
| B | 0 | 2766 | 1 |
| C | 0 | 3313 | 1 |
| D | 0 | 4334 | 1 |
| Mode SS | |||
|---|---|---|---|
| Quadrant | BADHDUFLAG | Total packets | Discarded packets |
| A | 0 | 28 | 0 |
| B | 0 | 28 | 0 |
| C | 0 | 28 | 0 |
| D | 0 | 28 | 0 |
| Mode M9 | |||
|---|---|---|---|
| Quadrant | BADHDUFLAG | Total packets | Discarded packets |
| A | 0 | 6 | 0 |
| B | 0 | 6 | 0 |
| C | 0 | 6 | 0 |
| D | 0 | 7 | 0 |
| Quadrant | Total seconds | Saturated seconds | Saturation percentage |
|---|---|---|---|
| A | 1372 | 5 | 0.364431% |
| B | 1372 | 1 | 0.072886% |
| C | 1372 | 2 | 0.145773% |
| D | 1372 | 15 | 1.093294% |
Noise dominated data is calculated using 1-second bins in cleaned event files. If a bin has >2000 counts, and if more than 50% of those come from <1% of pixels, then it is considered to be noise-dominated and hence unusable.
| Quadrant | # 1 sec bins | Bins with >0 counts | Bins with >2000 counts | High rate bins dominated by noise | Noise dominated (total time) | Noise dominated (detector-on time) | Marked lightcurve |
|---|---|---|---|---|---|---|---|
| A | 1372 | 1372 | 3 | 3 | 0.22% | 0.22% | 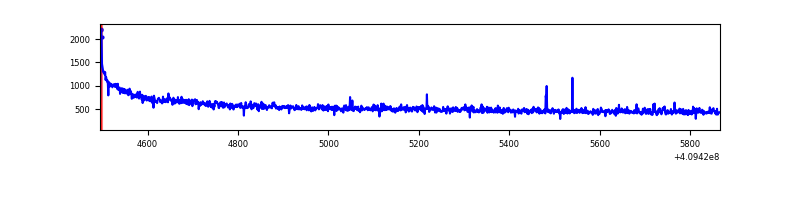 |
| B | 1372 | 1372 | 0 | 0 | 0.00% | 0.00% | 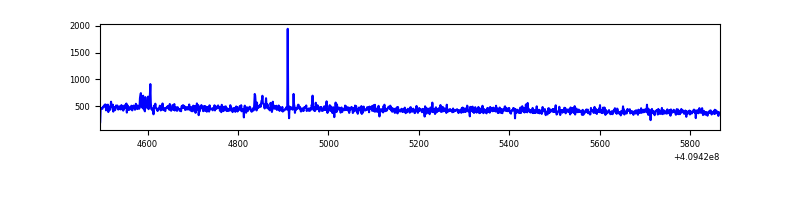 |
| C | 1372 | 1372 | 0 | 0 | 0.00% | 0.00% | 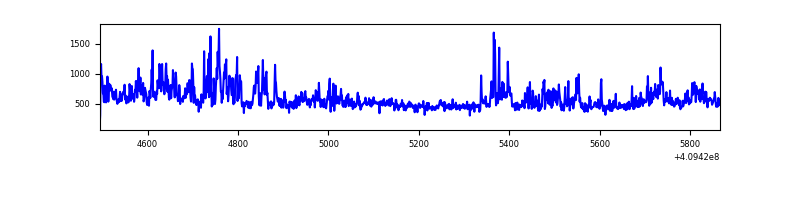 |
| D | 1372 | 1372 | 12 | 12 | 0.87% | 0.87% | 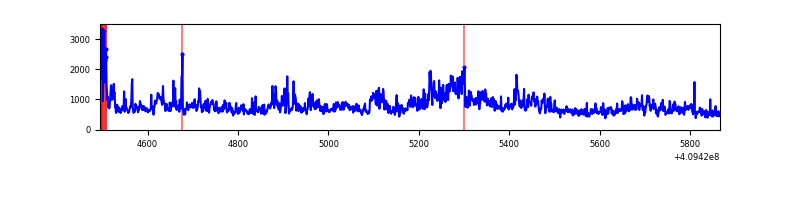 |
Top three noisy pixels from each quadrant. If the there are fewer than three noisy pixels in the level2.evt file, extra rows are filled as -1
| Pixel properties | Quadrant properties | ||||||
|---|---|---|---|---|---|---|---|
| Quadrant | DetID | PixID | Counts | Sigma | Mean | Median | Sigma |
| A | 10 | 83 | 154786 | 4795.12 | 151 | 148 | 32.2 |
| A | 13 | 254 | 2649 | 77.55 | 151 | 148 | 32.2 |
| A | 13 | 248 | 2648 | 77.52 | 151 | 148 | 32.2 |
| B | 15 | 85 | 4883 | 155.84 | 148 | 145 | 30.4 |
| B | 0 | 214 | 3864 | 122.32 | 148 | 145 | 30.4 |
| B | 12 | 111 | 3569 | 112.62 | 148 | 145 | 30.4 |
| C | 15 | 208 | 161646 | 4640.21 | 141 | 142 | 34.8 |
| C | 15 | 214 | 61542 | 1764.1 | 141 | 142 | 34.8 |
| C | 9 | 187 | 25097 | 716.99 | 141 | 142 | 34.8 |
| D | 12 | 235 | 307003 | 8443.94 | 141 | 137 | 36.3 |
| D | 5 | 222 | 93467 | 2568.13 | 141 | 137 | 36.3 |
| D | 12 | 227 | 50734 | 1392.26 | 141 | 137 | 36.3 |
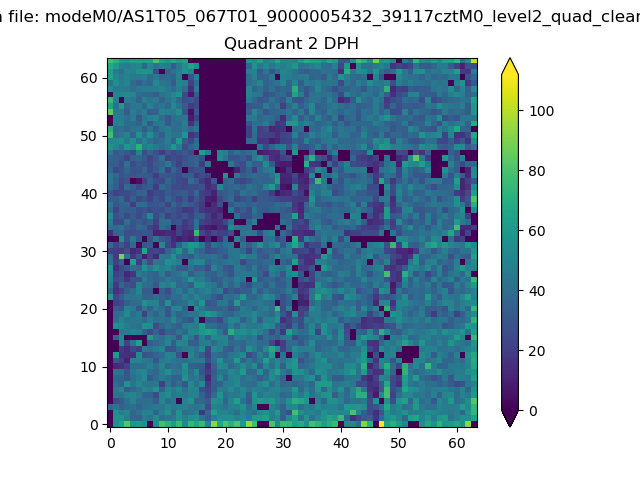
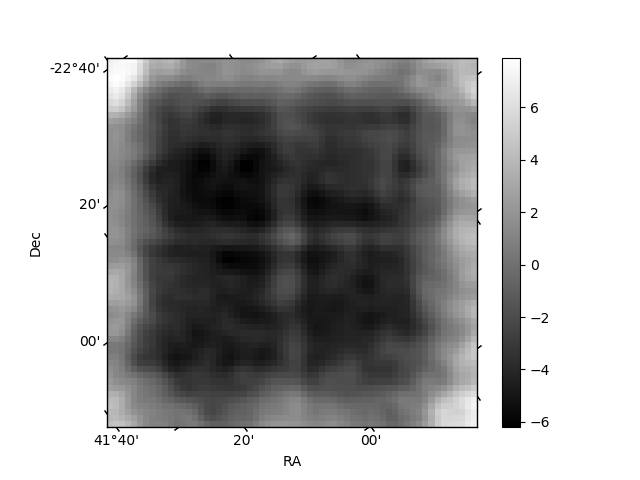
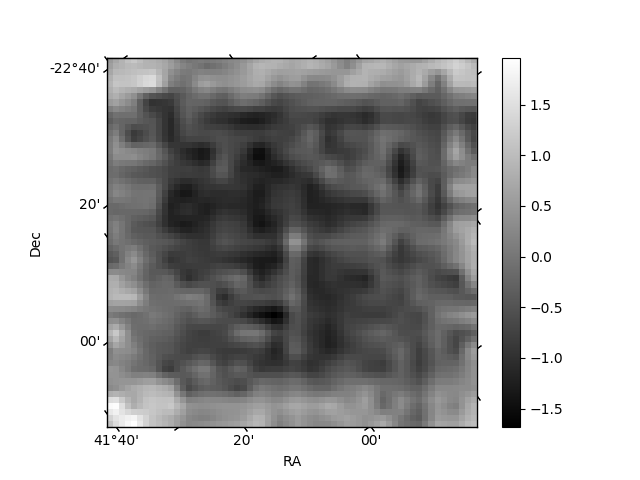
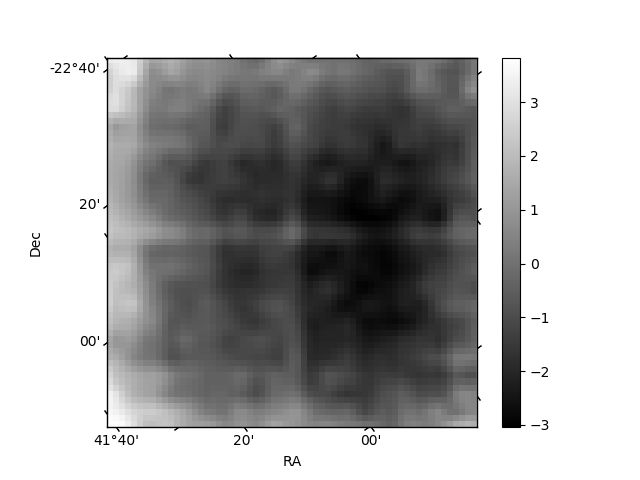
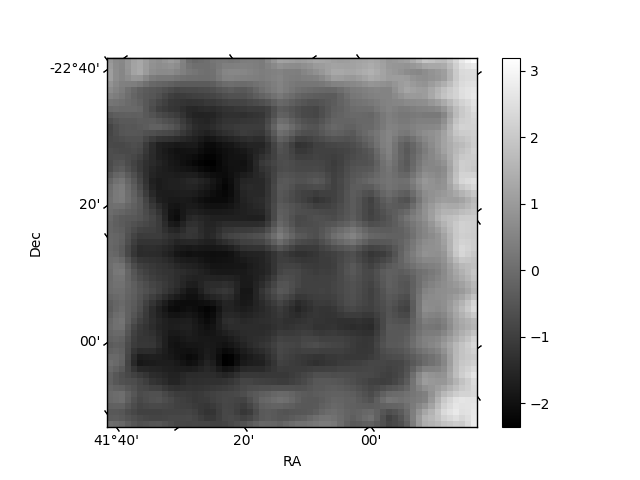
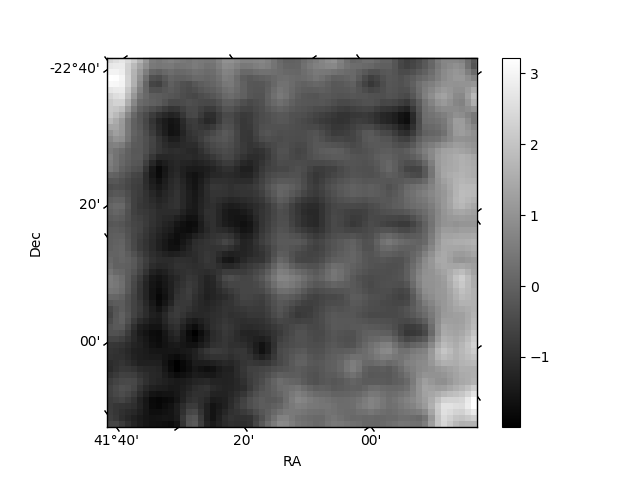
Histogram calculated using DETX and DETY for each event in the final _common_clean file
| Quadrant A | 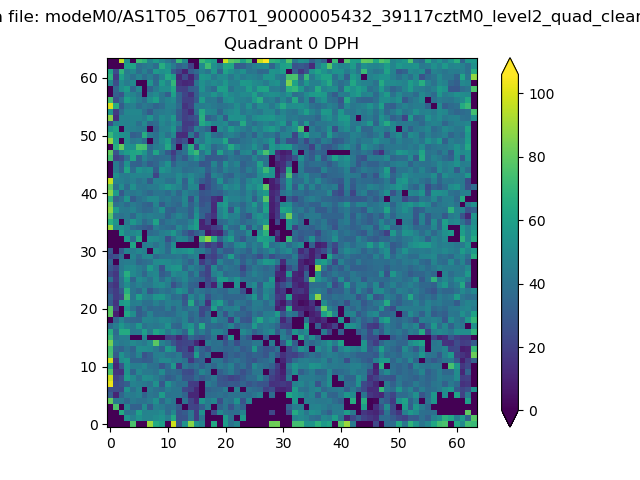 |
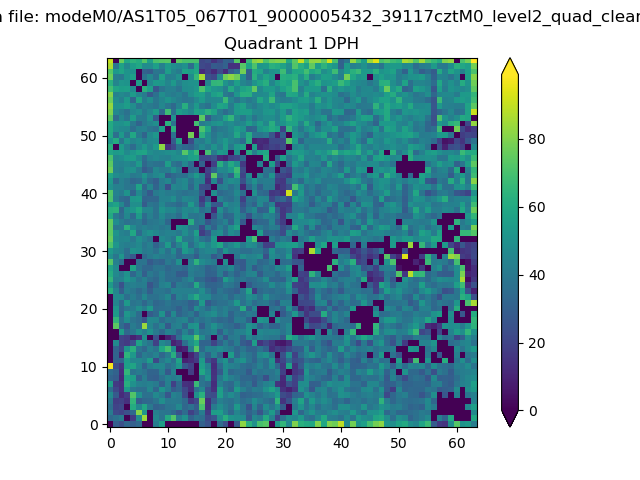 |
Quadrant B |
|---|---|---|---|
| Quadrant D | 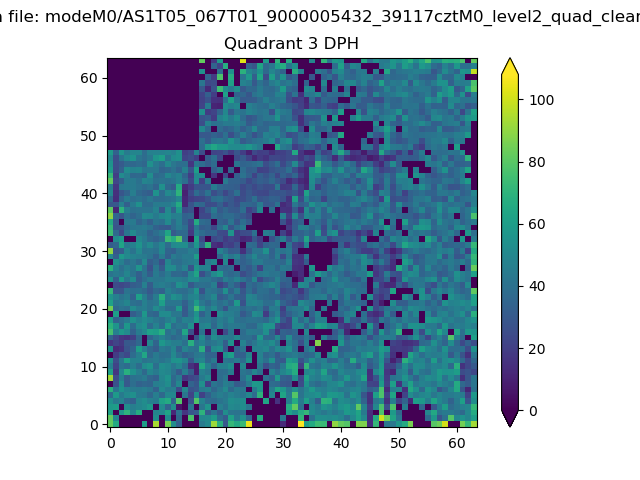 |
 |
Quadrant C |
| Plot type | Count rate plots | Images |
|---|---|---|
| Comparison with Poisson distribution Blue bars denote a histogram of data divided into 1 sec bins. Red curve is a Poisson curve with rate = median count rate of data. |
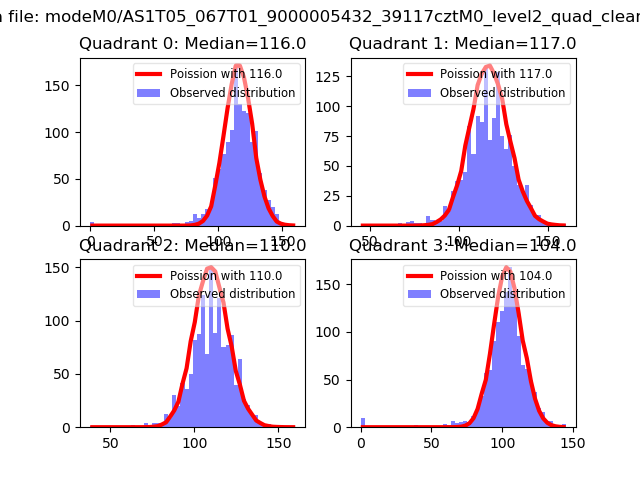 |
 |
| Quadrant-wise count rates Data is divided into 100 sec bins |
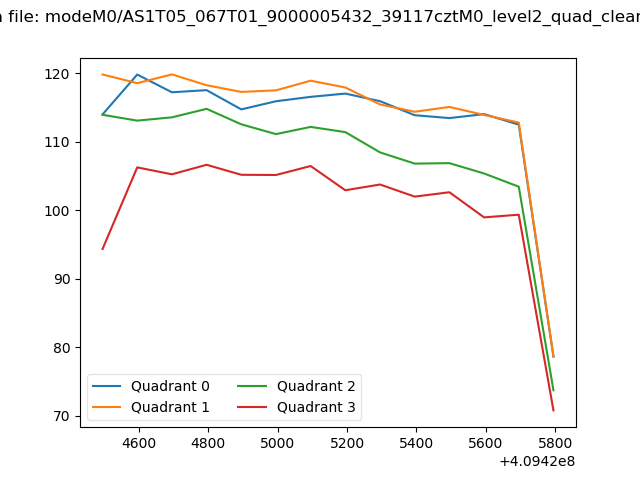 |
|
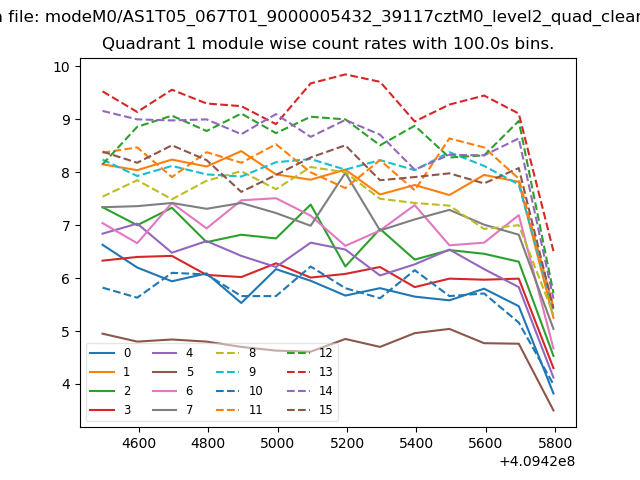
| Module-wise count rates for Quadrant A Data is divided into 100 sec bins |
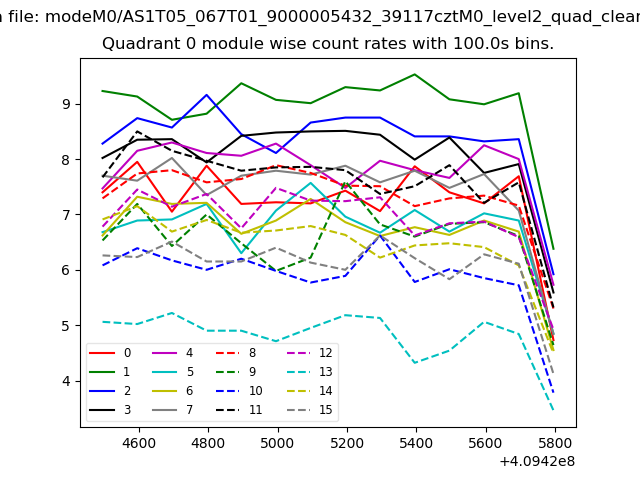 |
 |
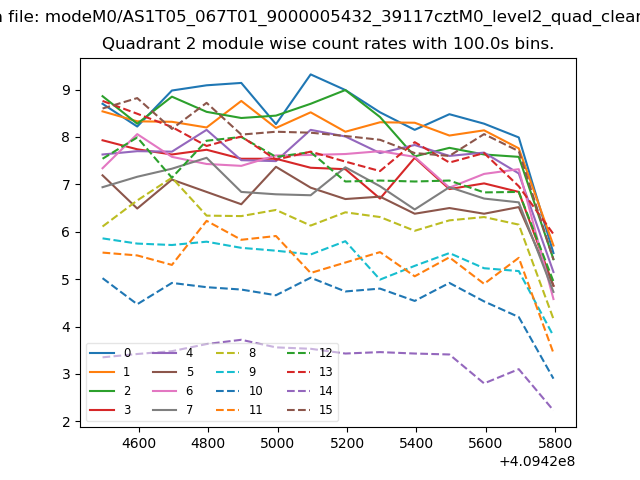
| Module-wise count rates for Quadrant B Data is divided into 100 sec bins |
 |
 |
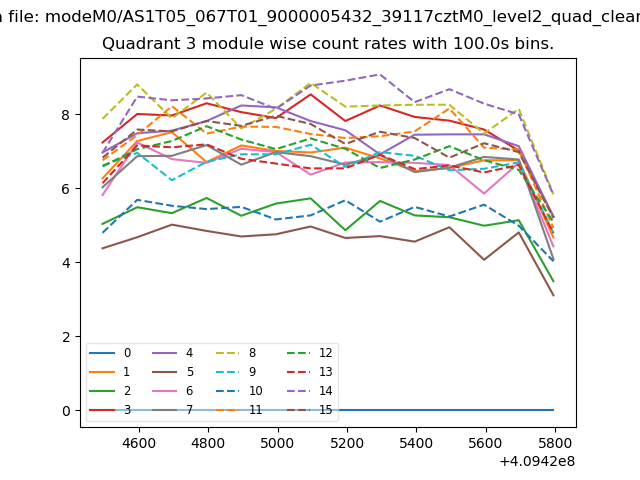
| Module-wise count rates for Quadrant C Data is divided into 100 sec bins |
 |
 |
| Module-wise count rates for Quadrant D Data is divided into 100 sec bins |
 |
 |
| Parameter | Plot |
|---|---|
| CZT HV Monitor | 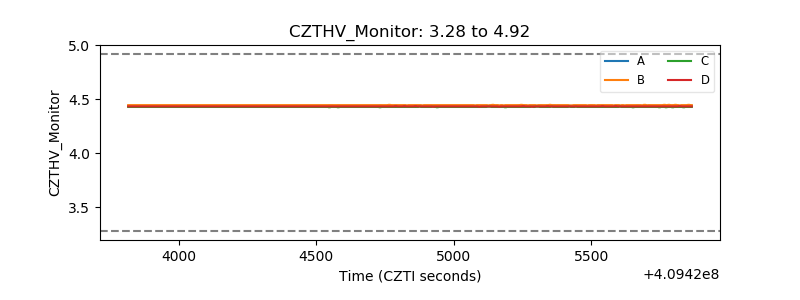 |
| D_VDD | 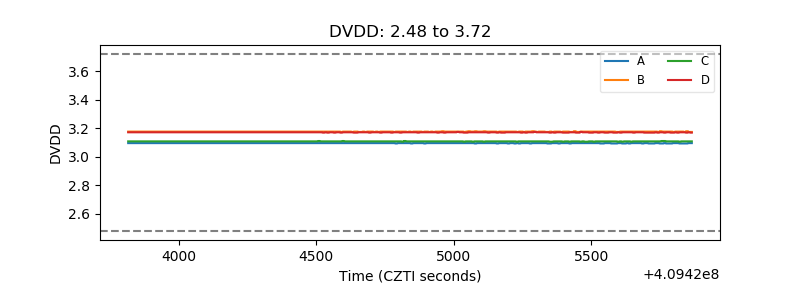 |
| Temperature 1 | 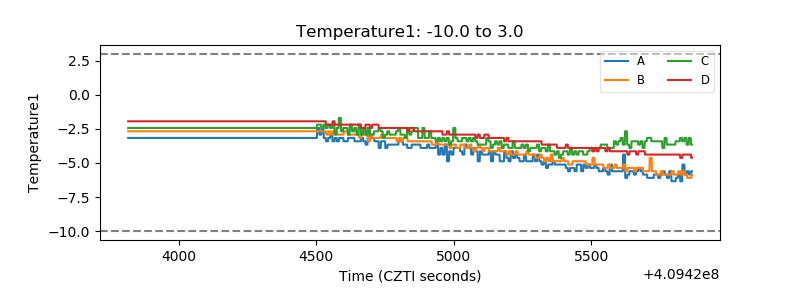 |
| Veto HV Monitor | 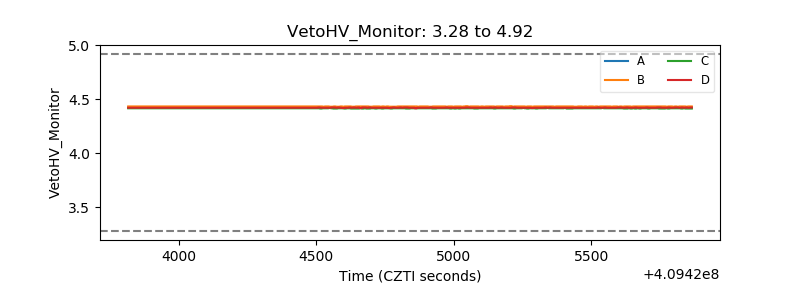 |
| Veto LLD | 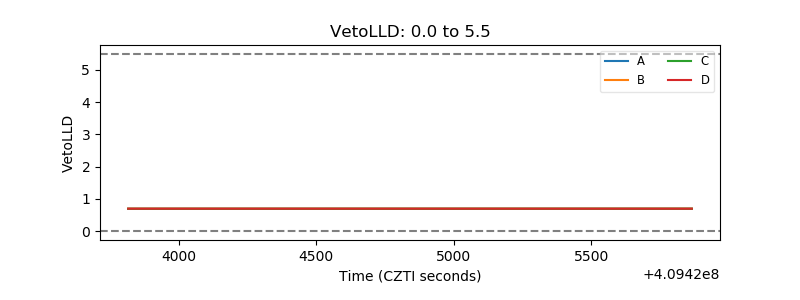 |
| Alpha Counter | 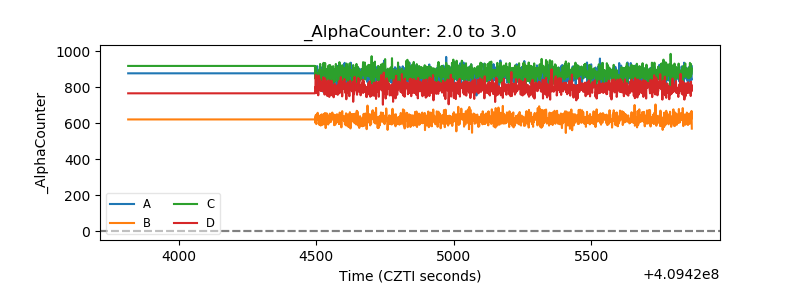 |
| _CPM_Rate | 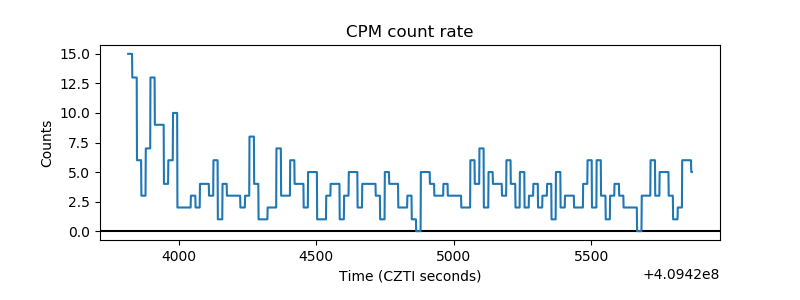 |
| CZT Counter | 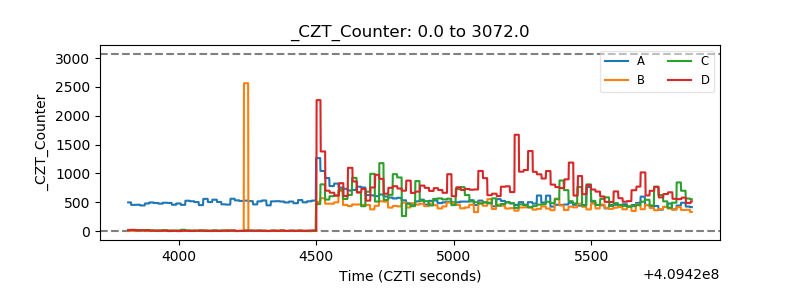 |
| +2.5 Volts monitor | 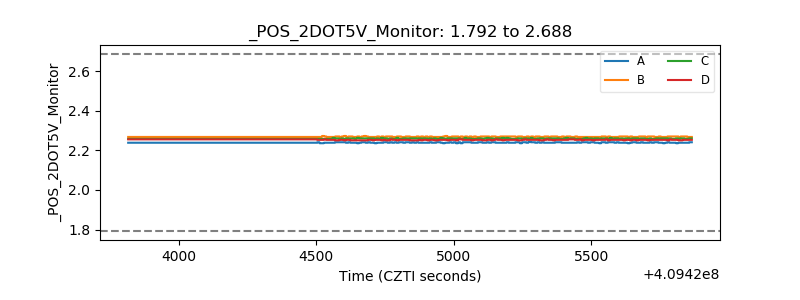 |
| +5 Volts monitor |  |
| _ROLL_ROT | 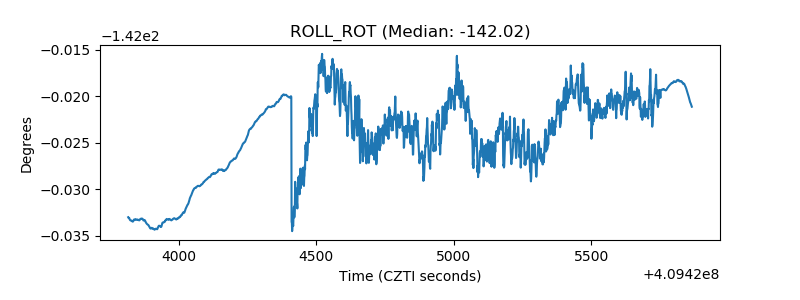 |
| _Roll_DEC | 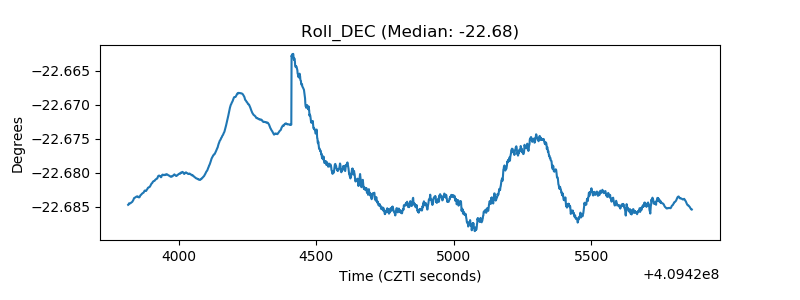 |
| _Roll_RA | 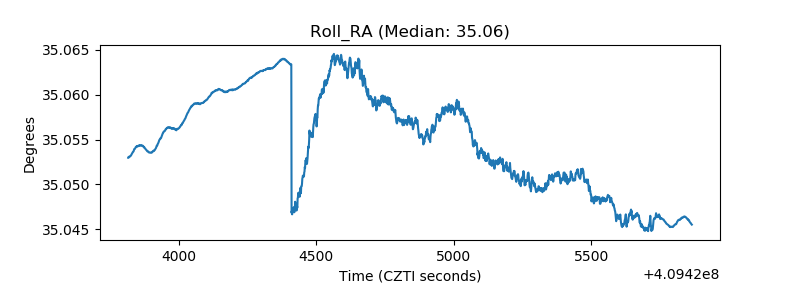 |
| Veto Counter | 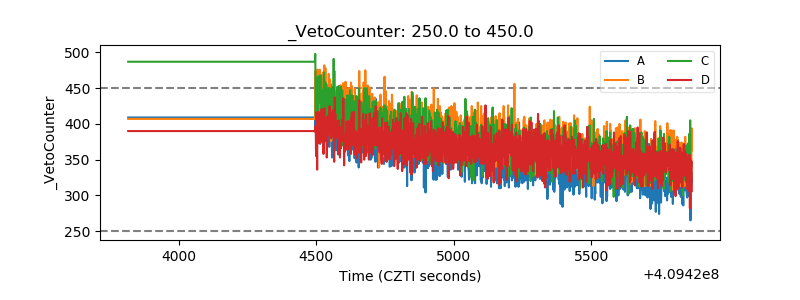 |