| Param | Original file | Final file |
|---|---|---|
| Filename | modeM0/AS1A12_044T04_9000005434_39117cztM0_level2.fits | modeM0/AS1A12_044T04_9000005434_39117cztM0_level2_quad_clean.evt |
| Size (bytes) | 240,560,640 | 57,297,600 |
| Size | 229.4 MB | 54.6 MB |
| Events in quadrant A | 1,738,598 | 391,366 |
| Events in quadrant B | 1,570,613 | 400,670 |
| Events in quadrant C | 2,043,463 | 373,723 |
| Events in quadrant D | 3,285,952 | 328,317 |
| Mode SS | |||
|---|---|---|---|
| Quadrant | BADHDUFLAG | Total packets | Discarded packets |
| A | 0 | 68 | 0 |
| B | 0 | 68 | 0 |
| C | 0 | 68 | 0 |
| D | 0 | 68 | 0 |
| Mode M0 | |||
|---|---|---|---|
| Quadrant | BADHDUFLAG | Total packets | Discarded packets |
| A | 0 | 7214 | 2 |
| B | 0 | 6958 | 1 |
| C | 0 | 8244 | 1 |
| D | 0 | 12150 | 1 |
| Mode M9 | |||
|---|---|---|---|
| Quadrant | BADHDUFLAG | Total packets | Discarded packets |
| A | 0 | 17 | 0 |
| B | 0 | 17 | 0 |
| C | 0 | 17 | 0 |
| D | 0 | 17 | 0 |
| Quadrant | Total seconds | Saturated seconds | Saturation percentage |
|---|---|---|---|
| A | 3405 | 7 | 0.205580% |
| B | 3405 | 7 | 0.205580% |
| C | 3405 | 24 | 0.704846% |
| D | 3405 | 256 | 7.518355% |
Noise dominated data is calculated using 1-second bins in cleaned event files. If a bin has >2000 counts, and if more than 50% of those come from <1% of pixels, then it is considered to be noise-dominated and hence unusable.
| Quadrant | # 1 sec bins | Bins with >0 counts | Bins with >2000 counts | High rate bins dominated by noise | Noise dominated (total time) | Noise dominated (detector-on time) | Marked lightcurve |
|---|---|---|---|---|---|---|---|
| A | 5077 | 3406 | 3 | 3 | 0.06% | 0.09% | 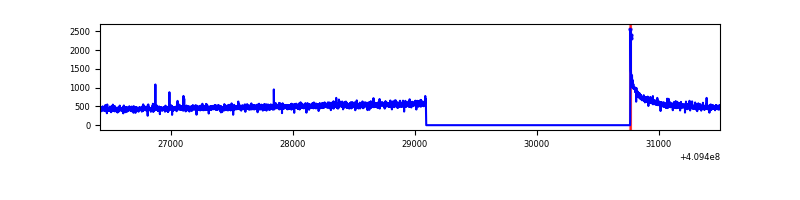 |
| B | 5077 | 3406 | 1 | 1 | 0.02% | 0.03% | 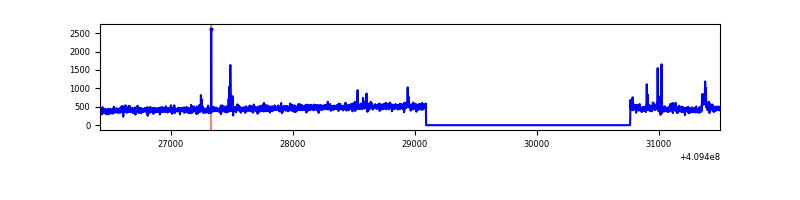 |
| C | 5077 | 3406 | 20 | 20 | 0.39% | 0.59% | 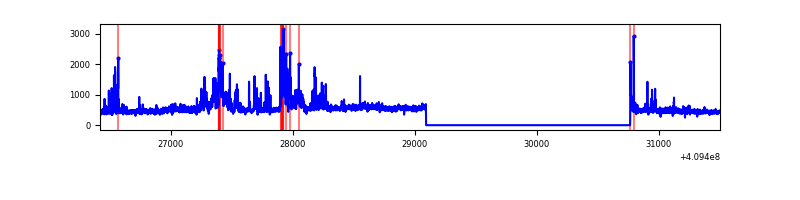 |
| D | 5077 | 3406 | 259 | 259 | 5.10% | 7.60% | 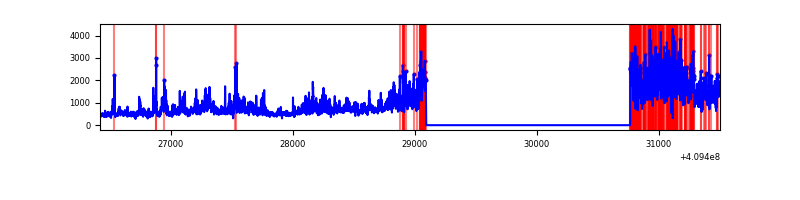 |
Top three noisy pixels from each quadrant. If the there are fewer than three noisy pixels in the level2.evt file, extra rows are filled as -1
| Pixel properties | Quadrant properties | ||||||
|---|---|---|---|---|---|---|---|
| Quadrant | DetID | PixID | Counts | Sigma | Mean | Median | Sigma |
| A | 10 | 83 | 246481 | 3114.5 | 383 | 375 | 79.0 |
| A | 13 | 254 | 5661 | 66.89 | 383 | 375 | 79.0 |
| A | 3 | 137 | 4251 | 49.05 | 383 | 375 | 79.0 |
| B | 5 | 184 | 19940 | 261.2 | 383 | 372 | 74.9 |
| B | 5 | 172 | 17999 | 235.29 | 383 | 372 | 74.9 |
| B | 0 | 229 | 13110 | 170.03 | 383 | 372 | 74.9 |
| C | 9 | 187 | 286730 | 3260.45 | 373 | 375 | 87.8 |
| C | 15 | 214 | 141865 | 1611.01 | 373 | 375 | 87.8 |
| C | 15 | 208 | 140400 | 1594.33 | 373 | 375 | 87.8 |
| D | 12 | 235 | 1208718 | 13658.4 | 363 | 353 | 88.5 |
| D | 2 | 249 | 431579 | 4874.24 | 363 | 353 | 88.5 |
| D | 5 | 222 | 85622 | 963.81 | 363 | 353 | 88.5 |
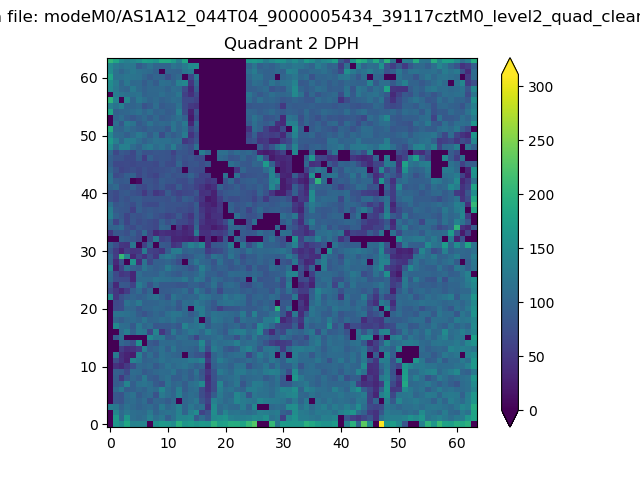
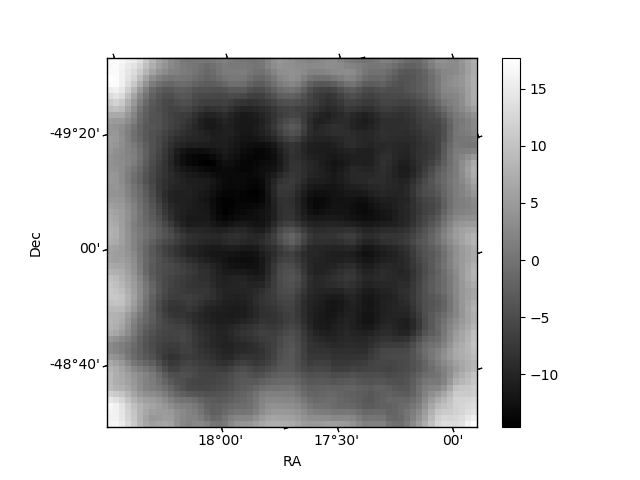
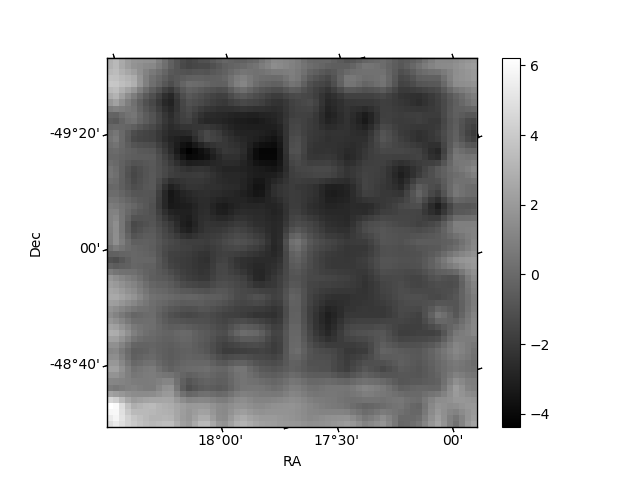
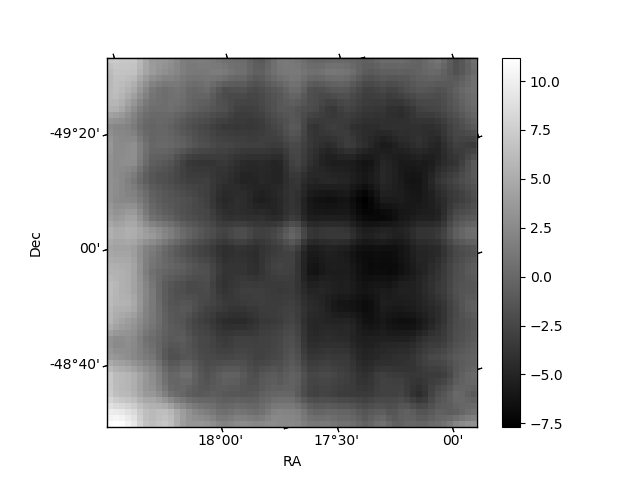
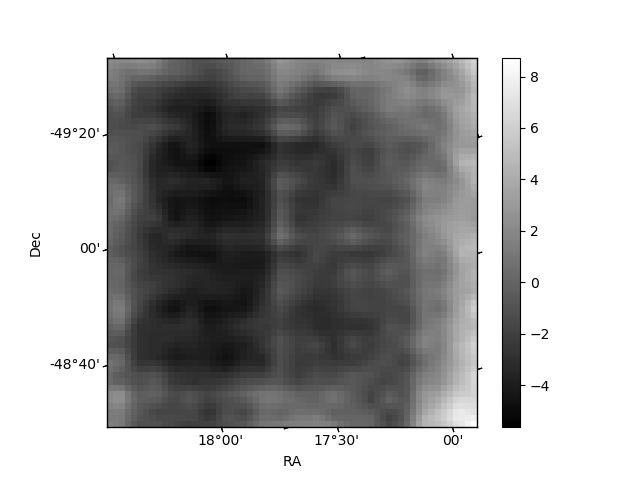
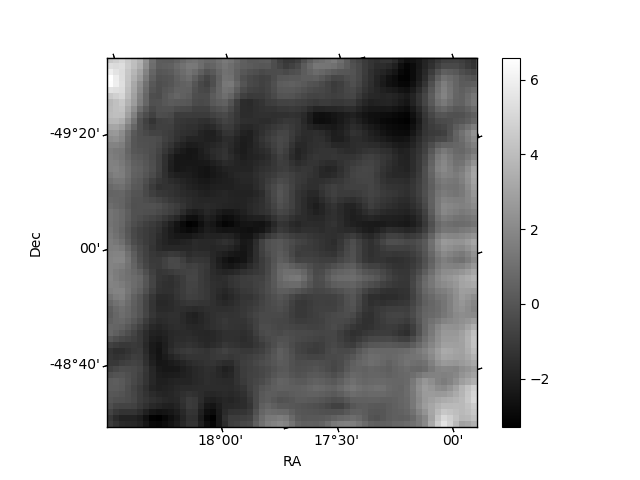
Histogram calculated using DETX and DETY for each event in the final _common_clean file
| Quadrant A | 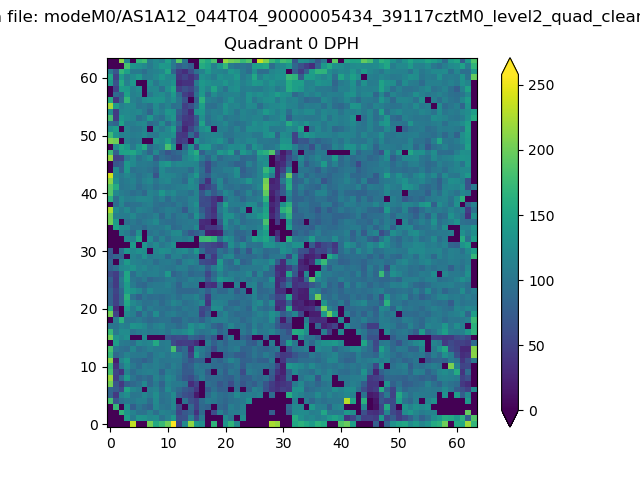 |
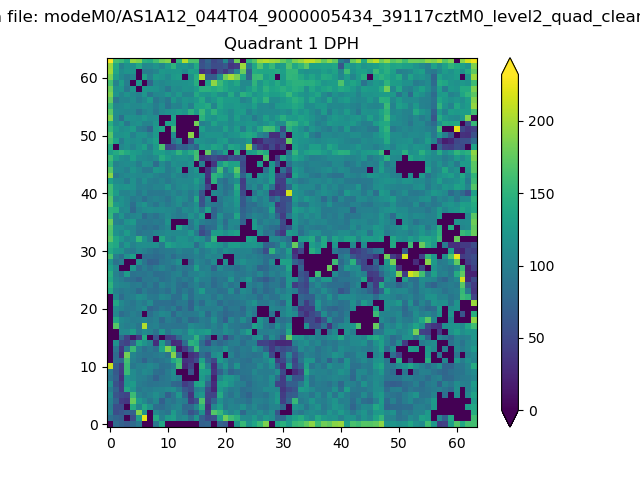 |
Quadrant B |
|---|---|---|---|
| Quadrant D | 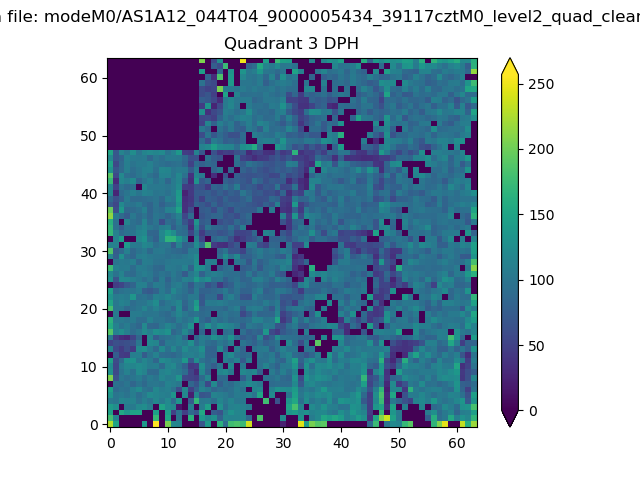 |
 |
Quadrant C |
| Plot type | Count rate plots | Images |
|---|---|---|
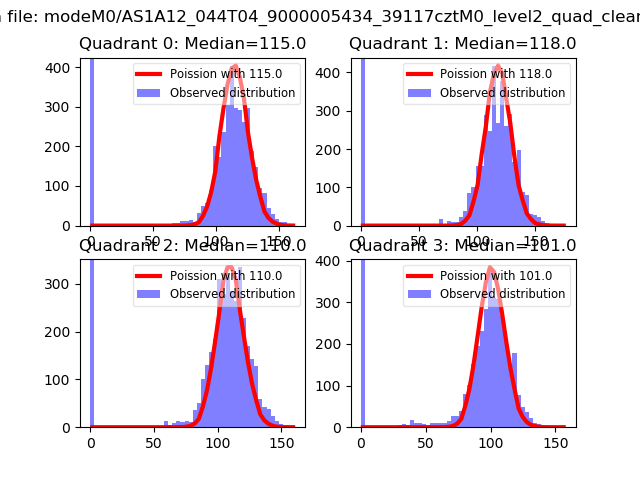
| Comparison with Poisson distribution Blue bars denote a histogram of data divided into 1 sec bins. Red curve is a Poisson curve with rate = median count rate of data. |
 |
 |
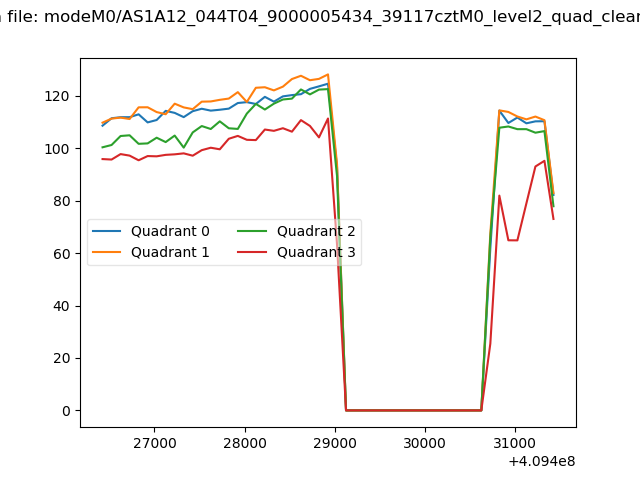
| Quadrant-wise count rates Data is divided into 100 sec bins |
 |
|
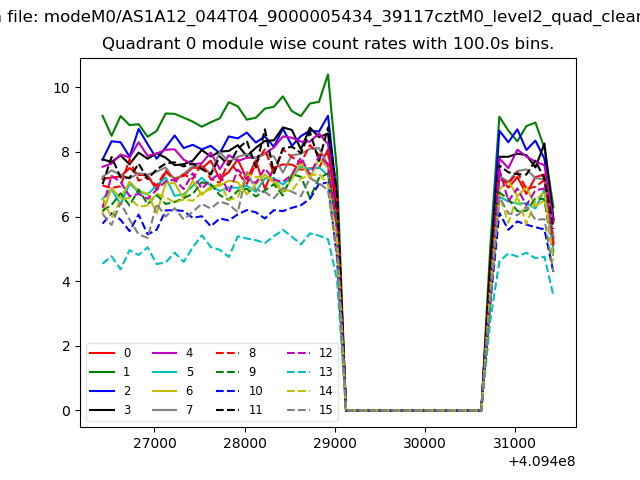
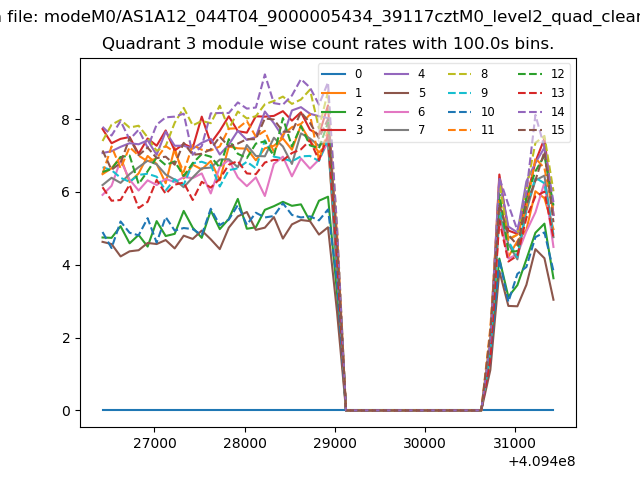
| Module-wise count rates for Quadrant A Data is divided into 100 sec bins |
 |
 |
| Module-wise count rates for Quadrant B Data is divided into 100 sec bins |
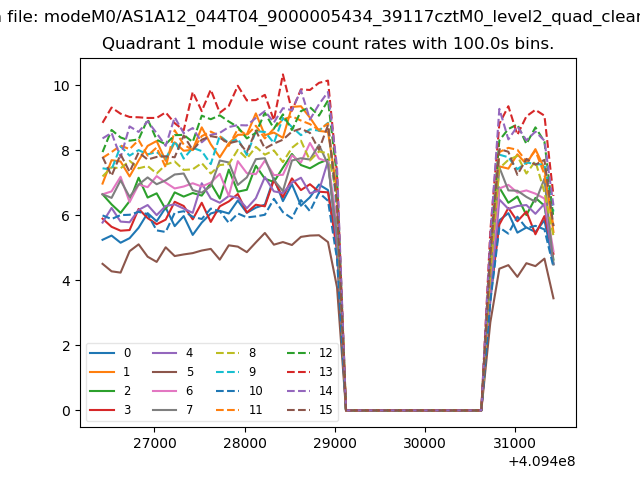 |
 |
| Module-wise count rates for Quadrant C Data is divided into 100 sec bins |
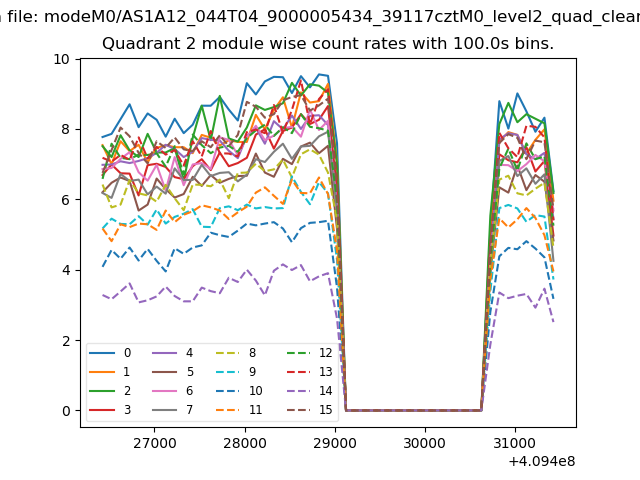 |
 |
| Module-wise count rates for Quadrant D Data is divided into 100 sec bins |
 |
 |
| Parameter | Plot |
|---|---|
| CZT HV Monitor | 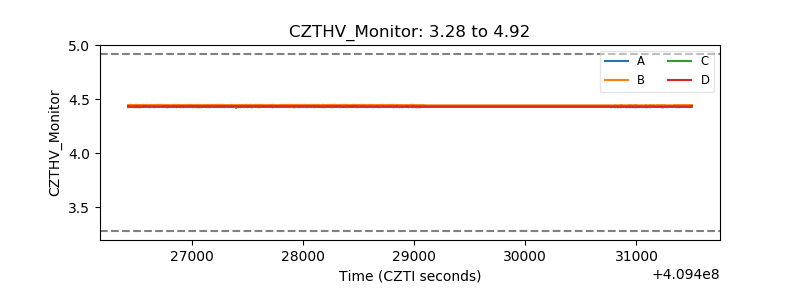 |
| D_VDD | 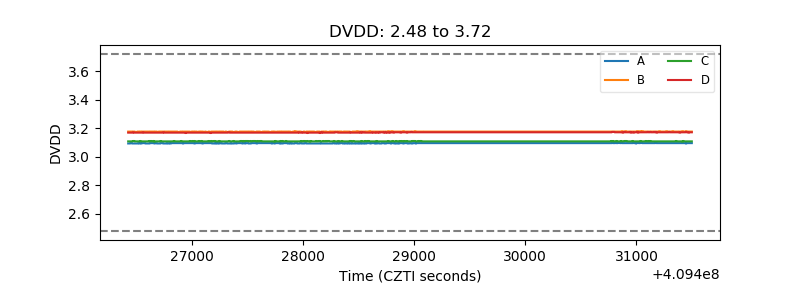 |
| Temperature 1 | 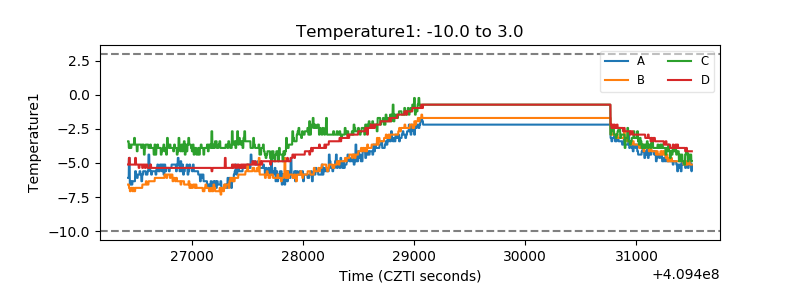 |
| Veto HV Monitor | 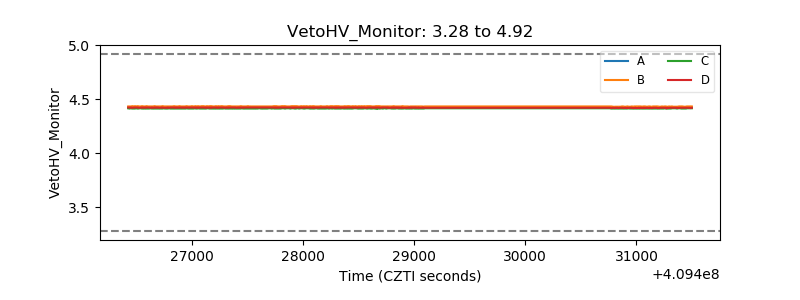 |
| Veto LLD | 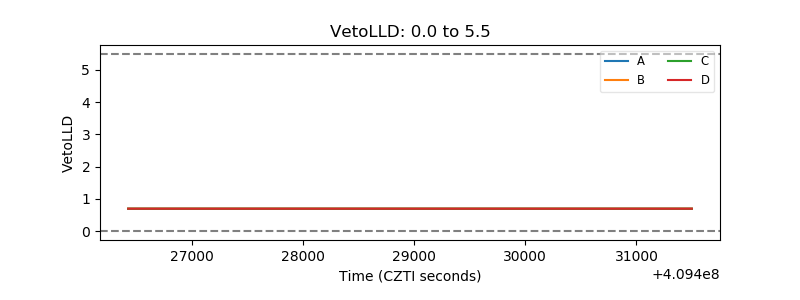 |
| Alpha Counter | 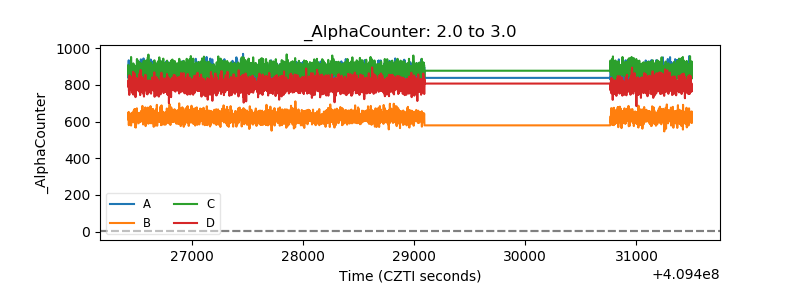 |
| _CPM_Rate | 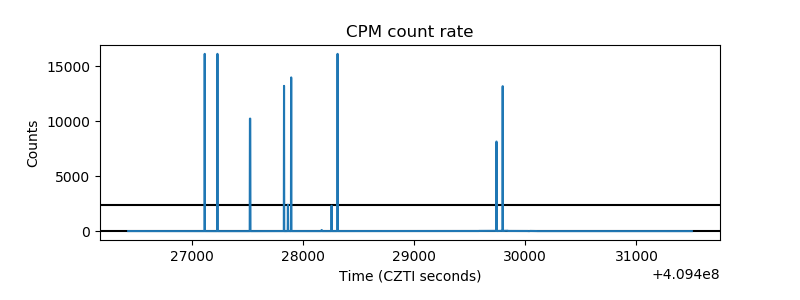 |
| CZT Counter | 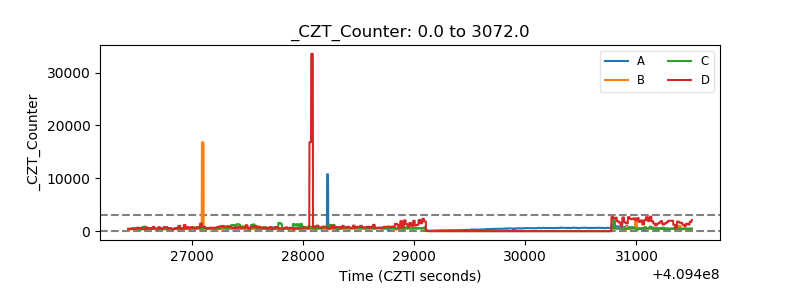 |
| +2.5 Volts monitor | 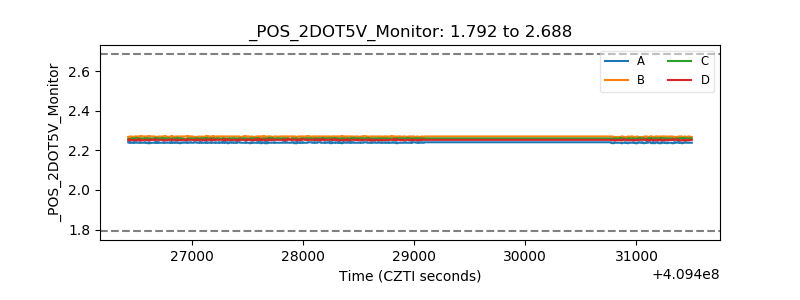 |
| +5 Volts monitor | 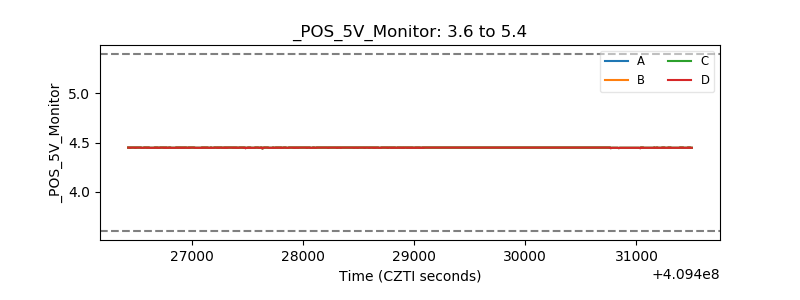 |
| _ROLL_ROT | 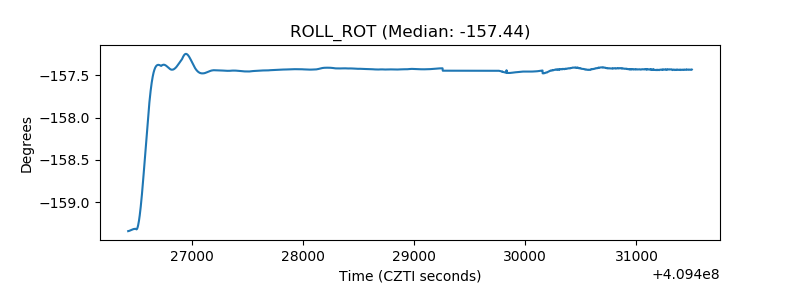 |
| _Roll_DEC | 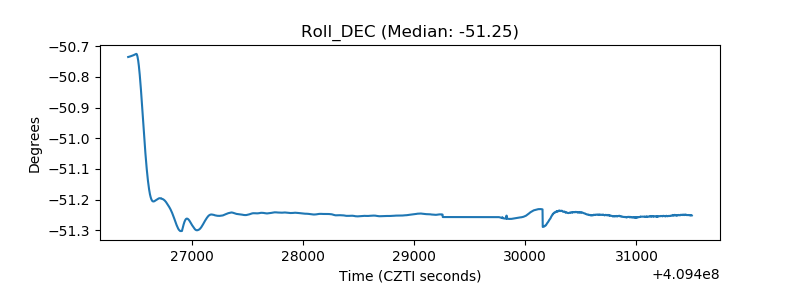 |
| _Roll_RA | 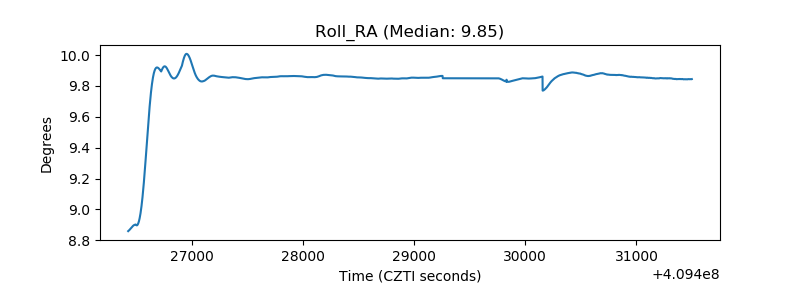 |
| Veto Counter | 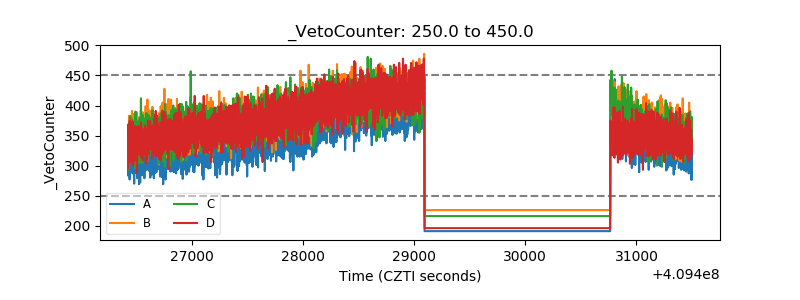 |