| Param | Original file | Final file |
|---|---|---|
| Filename | modeM0/AS1A12_044T04_9000005434_39118cztM0_level2.fits | modeM0/AS1A12_044T04_9000005434_39118cztM0_level2_quad_clean.evt |
| Size (bytes) | 420,252,480 | 90,878,400 |
| Size | 400.8 MB | 86.7 MB |
| Events in quadrant A | 2,851,728 | 622,902 |
| Events in quadrant B | 2,804,334 | 627,606 |
| Events in quadrant C | 2,650,740 | 600,289 |
| Events in quadrant D | 6,816,952 | 510,882 |
| Mode SS | |||
|---|---|---|---|
| Quadrant | BADHDUFLAG | Total packets | Discarded packets |
| A | 0 | 114 | 0 |
| B | 0 | 114 | 0 |
| C | 0 | 114 | 0 |
| D | 0 | 114 | 0 |
| Mode M0 | |||
|---|---|---|---|
| Quadrant | BADHDUFLAG | Total packets | Discarded packets |
| A | 0 | 11964 | 17 |
| B | 0 | 12266 | 27 |
| C | 0 | 11430 | 18 |
| D | 0 | 24294 | 49 |
| Mode M9 | |||
|---|---|---|---|
| Quadrant | BADHDUFLAG | Total packets | Discarded packets |
| A | 0 | 23 | 0 |
| B | 0 | 23 | 0 |
| C | 0 | 23 | 0 |
| D | 0 | 24 | 1 |
| Quadrant | Total seconds | Saturated seconds | Saturation percentage |
|---|---|---|---|
| A | 5573 | 16 | 0.287099% |
| B | 5569 | 100 | 1.795655% |
| C | 5572 | 5 | 0.089734% |
| D | 5569 | 642 | 11.528102% |
Noise dominated data is calculated using 1-second bins in cleaned event files. If a bin has >2000 counts, and if more than 50% of those come from <1% of pixels, then it is considered to be noise-dominated and hence unusable.
| Quadrant | # 1 sec bins | Bins with >0 counts | Bins with >2000 counts | High rate bins dominated by noise | Noise dominated (total time) | Noise dominated (detector-on time) | Marked lightcurve |
|---|---|---|---|---|---|---|---|
| A | 6980 | 5577 | 6 | 6 | 0.09% | 0.11% | 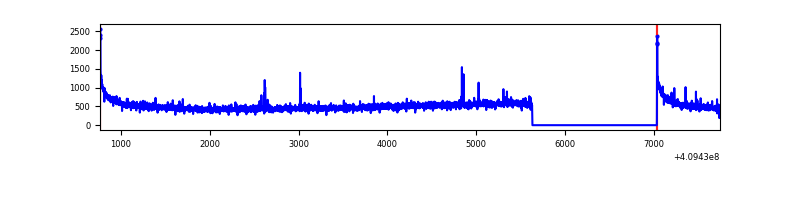 |
| B | 6980 | 5574 | 51 | 51 | 0.73% | 0.91% | 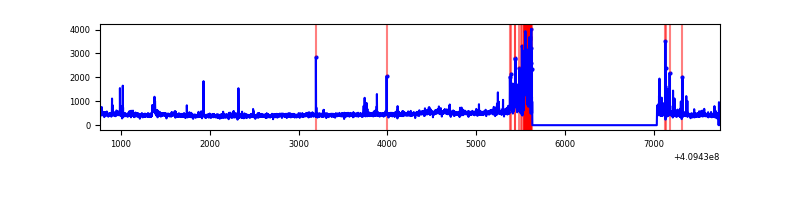 |
| C | 6979 | 5574 | 5 | 5 | 0.07% | 0.09% | 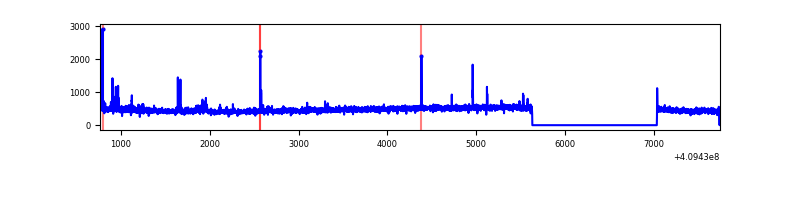 |
| D | 6976 | 5573 | 559 | 559 | 8.01% | 10.03% | 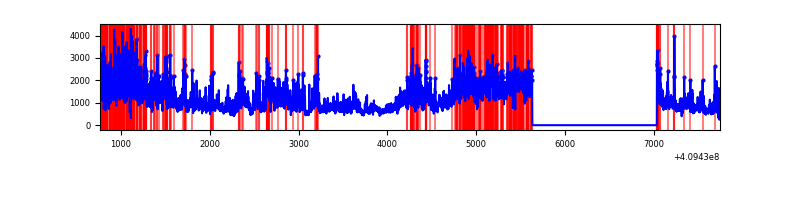 |
Top three noisy pixels from each quadrant. If the there are fewer than three noisy pixels in the level2.evt file, extra rows are filled as -1
| Pixel properties | Quadrant properties | ||||||
|---|---|---|---|---|---|---|---|
| Quadrant | DetID | PixID | Counts | Sigma | Mean | Median | Sigma |
| A | 10 | 83 | 448525 | 3601.9 | 611 | 597 | 124.4 |
| A | 13 | 248 | 20199 | 157.62 | 611 | 597 | 124.4 |
| A | 13 | 254 | 8219 | 61.29 | 611 | 597 | 124.4 |
| B | 5 | 172 | 139726 | 1183.88 | 606 | 589 | 117.5 |
| B | 0 | 186 | 130947 | 1109.18 | 606 | 589 | 117.5 |
| B | 5 | 184 | 51462 | 432.87 | 606 | 589 | 117.5 |
| C | 15 | 214 | 235157 | 1699.95 | 593 | 596 | 138.0 |
| C | 9 | 187 | 47973 | 343.36 | 593 | 596 | 138.0 |
| C | 15 | 208 | 34006 | 242.13 | 593 | 596 | 138.0 |
| D | 12 | 235 | 3754357 | 26781.12 | 571 | 554 | 140.2 |
| D | 2 | 249 | 459771 | 3276.24 | 571 | 554 | 140.2 |
| D | 2 | 153 | 88888 | 630.21 | 571 | 554 | 140.2 |
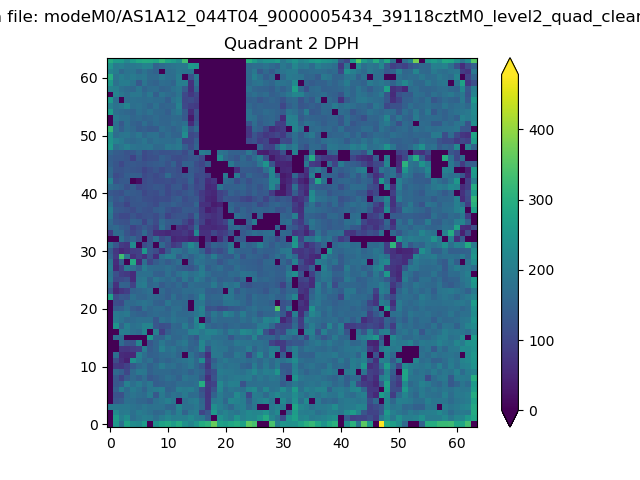
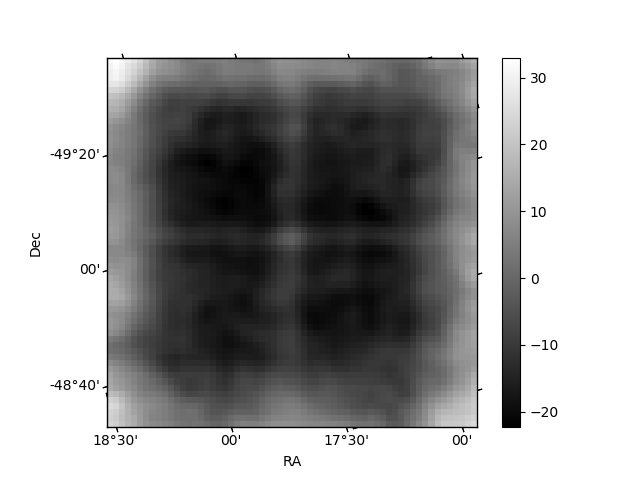
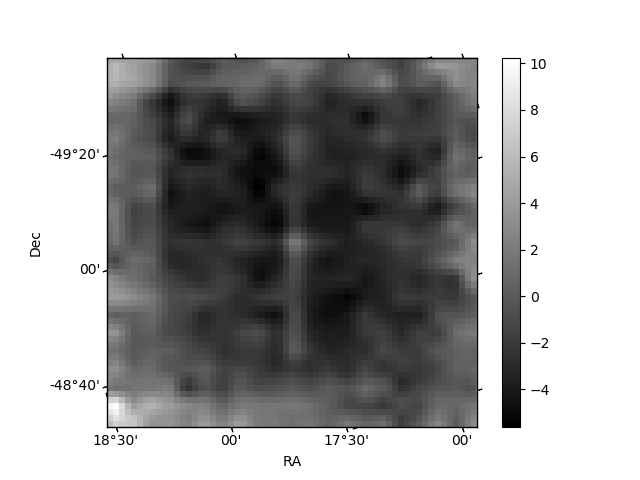
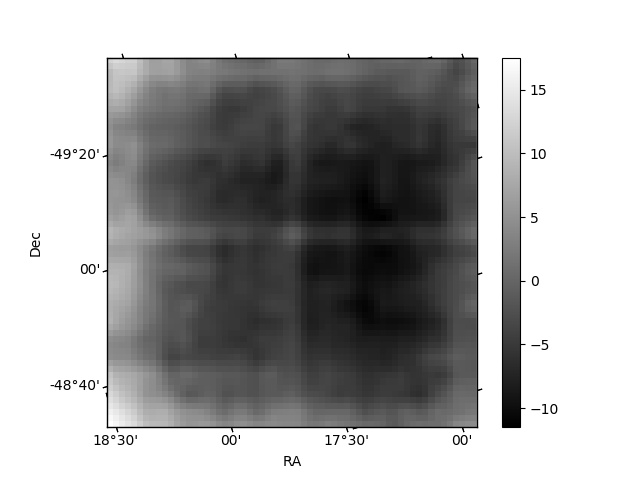
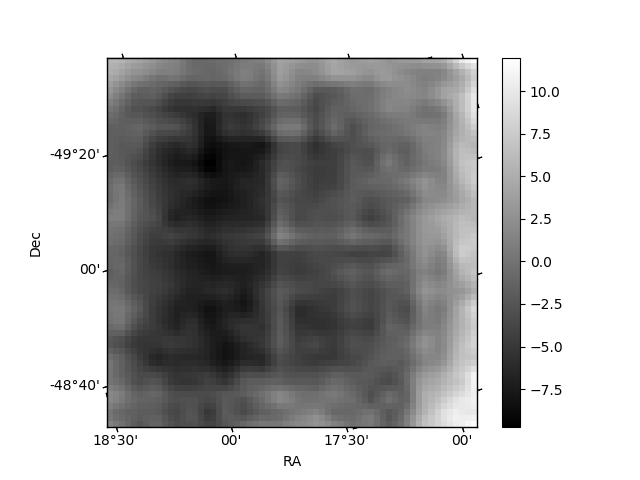
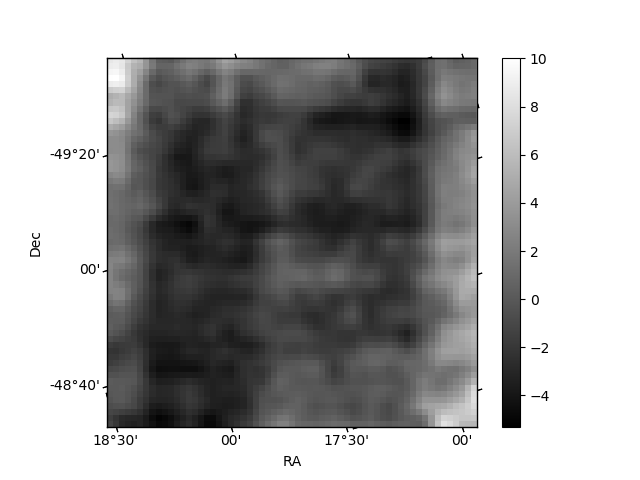
Histogram calculated using DETX and DETY for each event in the final _common_clean file
| Quadrant A | 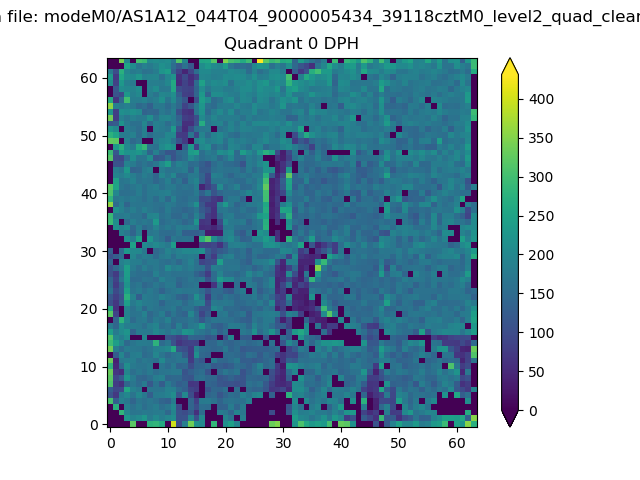 |
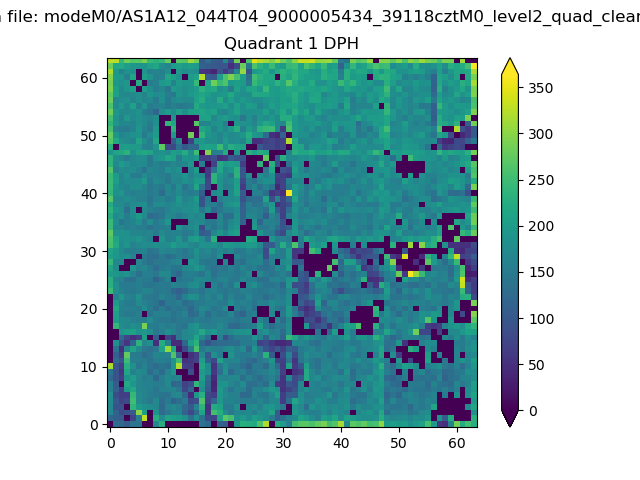 |
Quadrant B |
|---|---|---|---|
| Quadrant D | 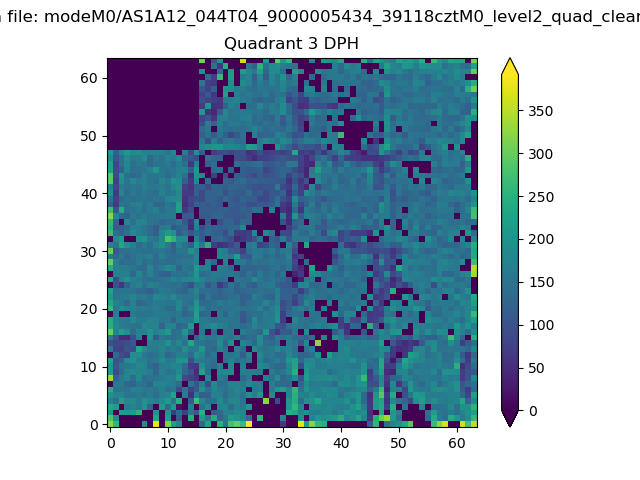 |
 |
Quadrant C |
| Plot type | Count rate plots | Images |
|---|---|---|
| Comparison with Poisson distribution Blue bars denote a histogram of data divided into 1 sec bins. Red curve is a Poisson curve with rate = median count rate of data. |
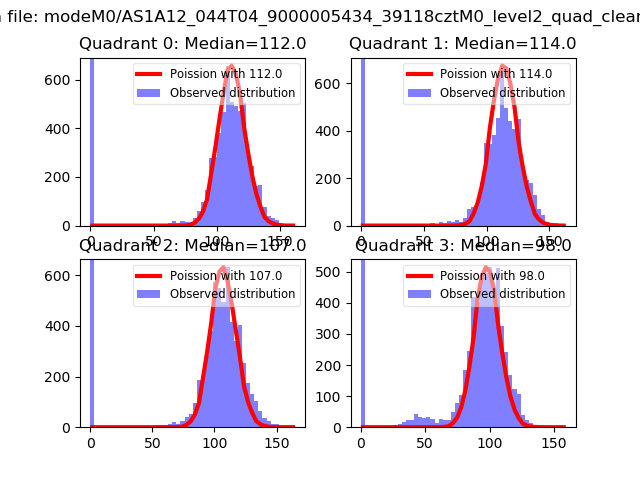 |
 |
| Quadrant-wise count rates Data is divided into 100 sec bins |
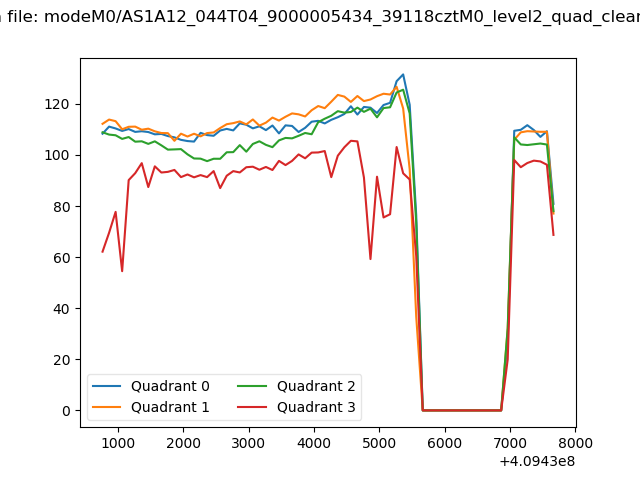 |
|
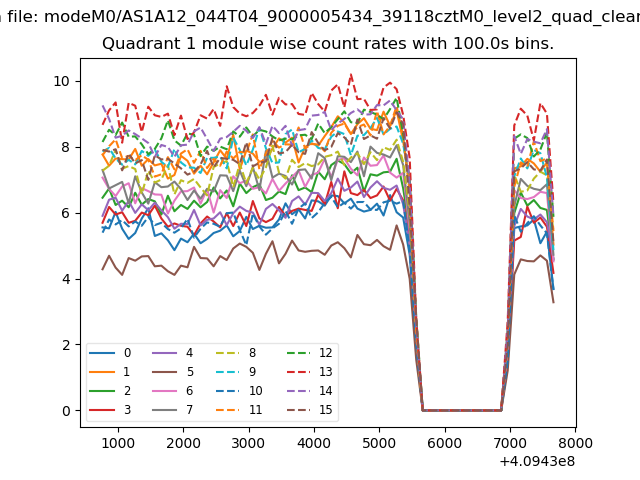
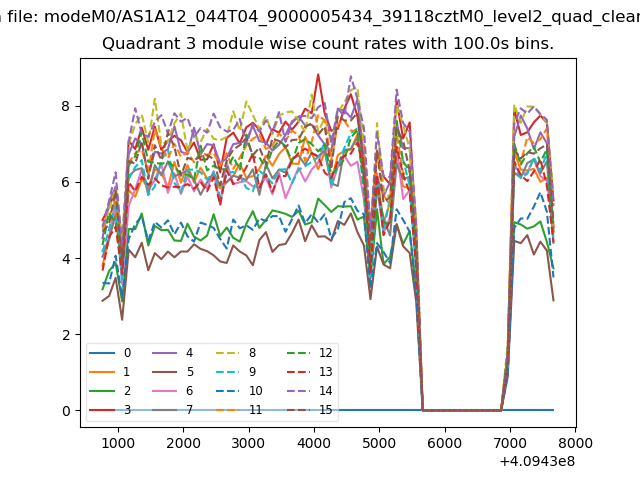
| Module-wise count rates for Quadrant A Data is divided into 100 sec bins |
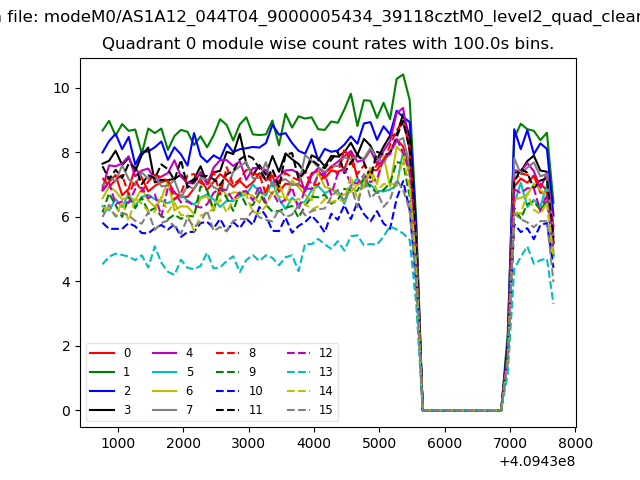 |
 |
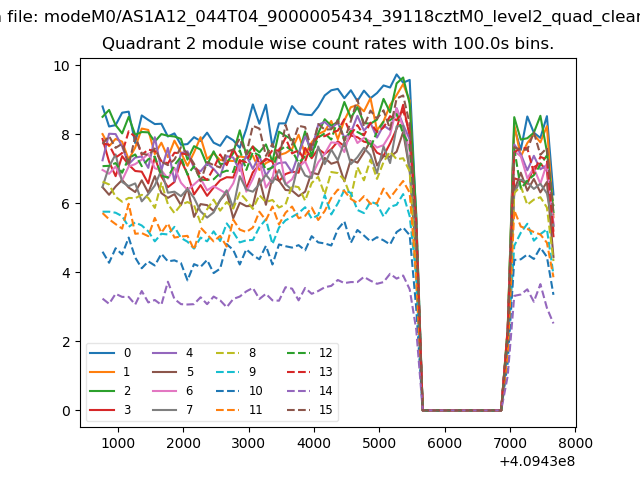
| Module-wise count rates for Quadrant B Data is divided into 100 sec bins |
 |
 |
| Module-wise count rates for Quadrant C Data is divided into 100 sec bins |
 |
 |
| Module-wise count rates for Quadrant D Data is divided into 100 sec bins |
 |
 |
| Parameter | Plot |
|---|---|
| CZT HV Monitor |  |
| D_VDD | 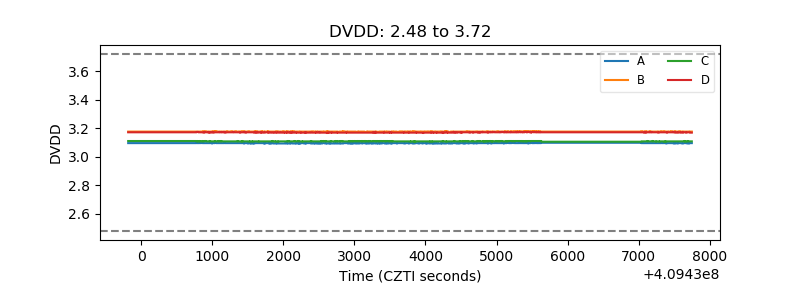 |
| Temperature 1 | 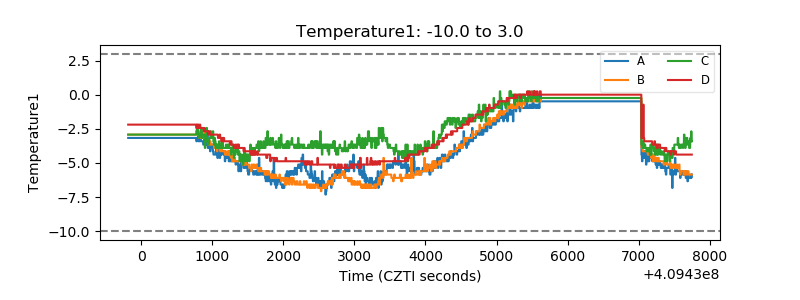 |
| Veto HV Monitor | 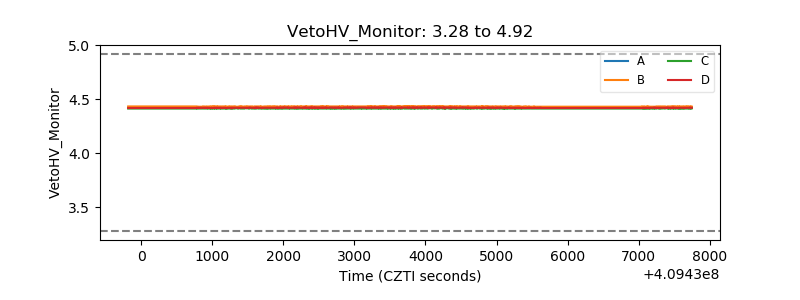 |
| Veto LLD | 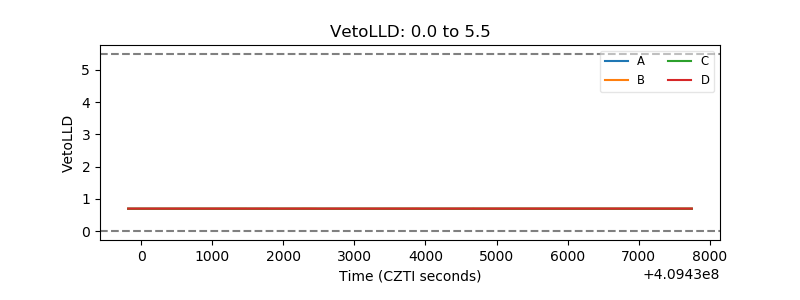 |
| Alpha Counter | 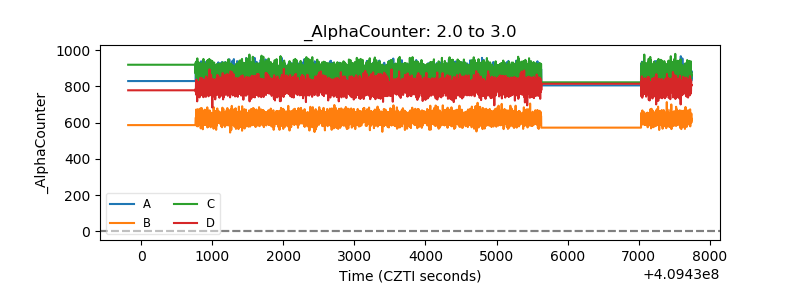 |
| _CPM_Rate | 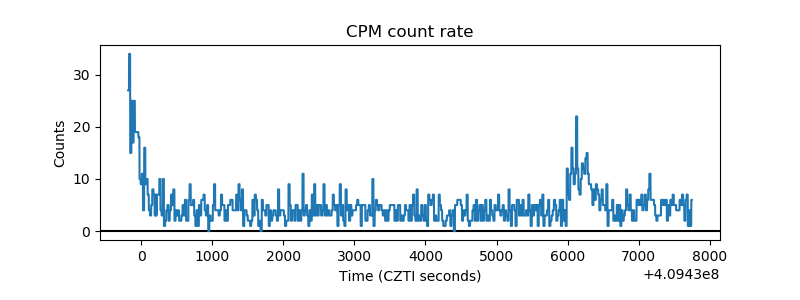 |
| CZT Counter | 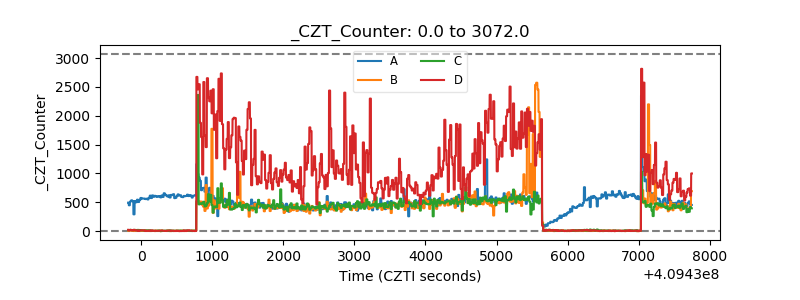 |
| +2.5 Volts monitor | 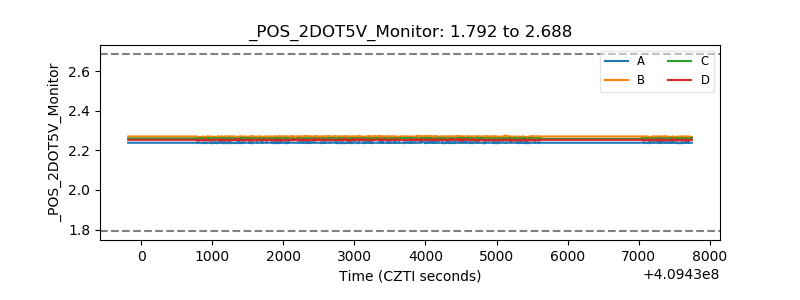 |
| +5 Volts monitor | 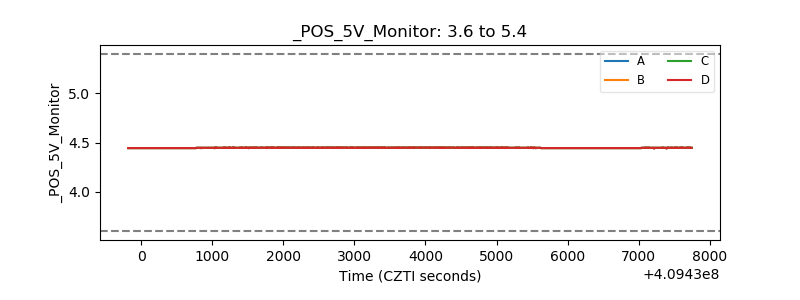 |
| _ROLL_ROT | 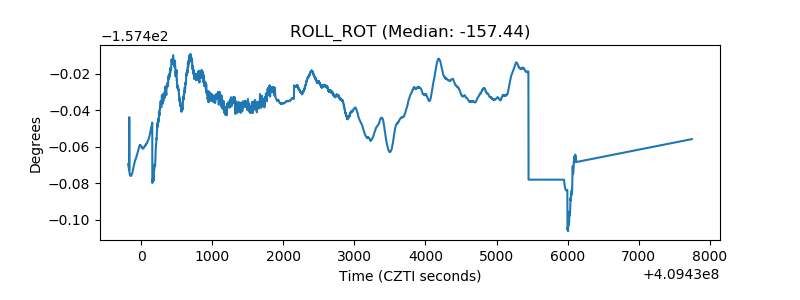 |
| _Roll_DEC | 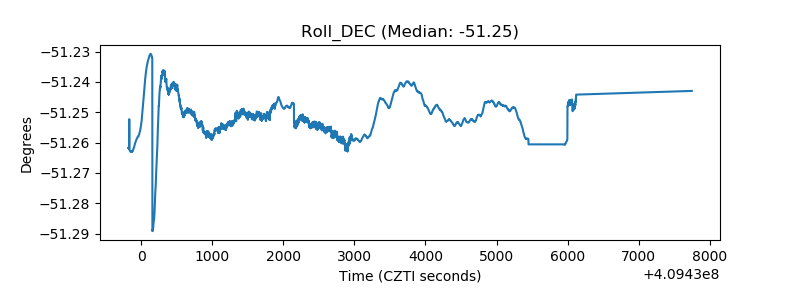 |
| _Roll_RA | 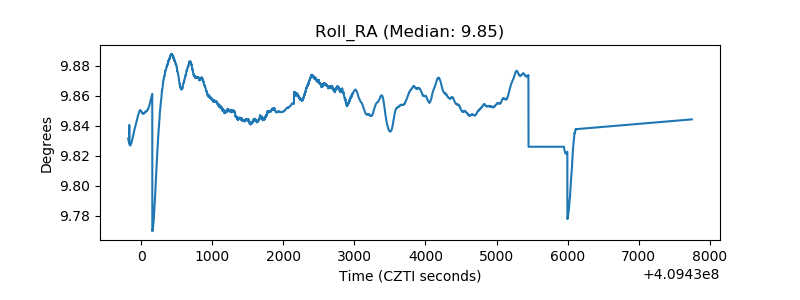 |
| Veto Counter | 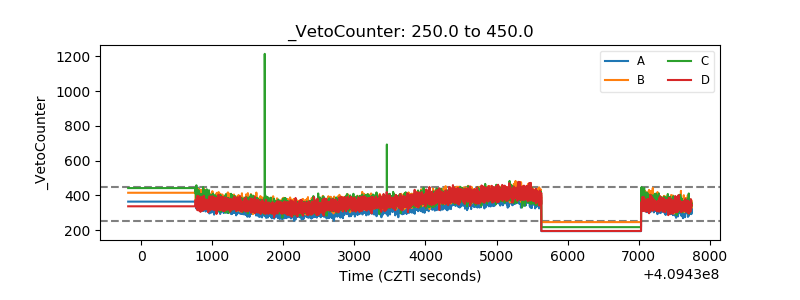 |