| Param | Original file | Final file |
|---|---|---|
| Filename | modeM0/AS1A12_044T04_9000005434_39122cztM0_level2.fits | modeM0/AS1A12_044T04_9000005434_39122cztM0_level2_quad_clean.evt |
| Size (bytes) | 1,028,177,280 | 257,016,960 |
| Size | 980.5 MB | 245.1 MB |
| Events in quadrant A | 9,059,208 | 1,712,352 |
| Events in quadrant B | 8,127,760 | 1,771,444 |
| Events in quadrant C | 7,578,415 | 1,686,546 |
| Events in quadrant D | 12,067,066 | 1,517,452 |
| Mode SS | |||
|---|---|---|---|
| Quadrant | BADHDUFLAG | Total packets | Discarded packets |
| A | 0 | 327 | 5 |
| B | 0 | 328 | 6 |
| C | 0 | 329 | 7 |
| D | 0 | 327 | 5 |
| Mode M0 | |||
|---|---|---|---|
| Quadrant | BADHDUFLAG | Total packets | Discarded packets |
| A | 0 | 37057 | 561 |
| B | 0 | 35290 | 525 |
| C | 0 | 33136 | 677 |
| D | 0 | 47140 | 698 |
| Mode M9 | |||
|---|---|---|---|
| Quadrant | BADHDUFLAG | Total packets | Discarded packets |
| A | 0 | 55 | 4 |
| B | 0 | 57 | 6 |
| C | 0 | 54 | 3 |
| D | 0 | 53 | 2 |
| Quadrant | Total seconds | Saturated seconds | Saturation percentage |
|---|---|---|---|
| A | 15865 | 317 | 1.998109% |
| B | 15861 | 195 | 1.229431% |
| C | 15857 | 15 | 0.094595% |
| D | 15856 | 300 | 1.892028% |
Noise dominated data is calculated using 1-second bins in cleaned event files. If a bin has >2000 counts, and if more than 50% of those come from <1% of pixels, then it is considered to be noise-dominated and hence unusable.
| Quadrant | # 1 sec bins | Bins with >0 counts | Bins with >2000 counts | High rate bins dominated by noise | Noise dominated (total time) | Noise dominated (detector-on time) | Marked lightcurve |
|---|---|---|---|---|---|---|---|
| A | 30964 | 15874 | 254 | 254 | 0.82% | 1.60% | 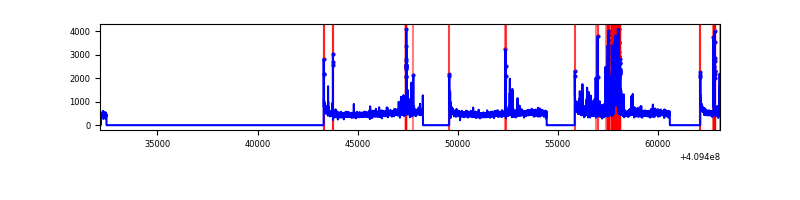 |
| B | 30963 | 15873 | 108 | 108 | 0.35% | 0.68% | 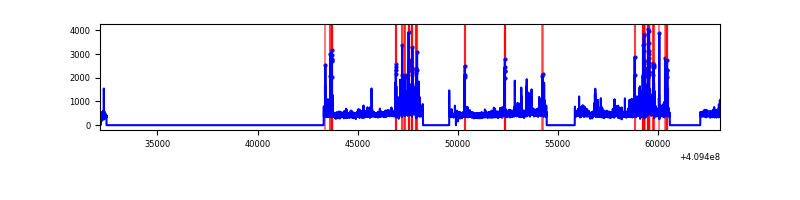 |
| C | 30969 | 15875 | 3 | 3 | 0.01% | 0.02% | 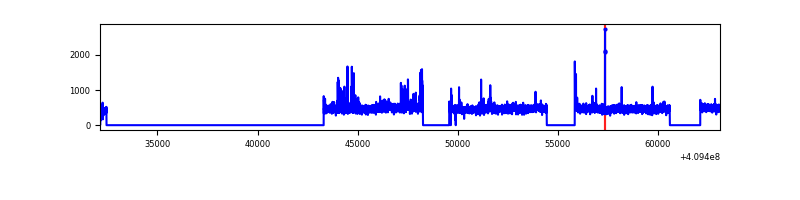 |
| D | 30965 | 15874 | 279 | 279 | 0.90% | 1.76% | 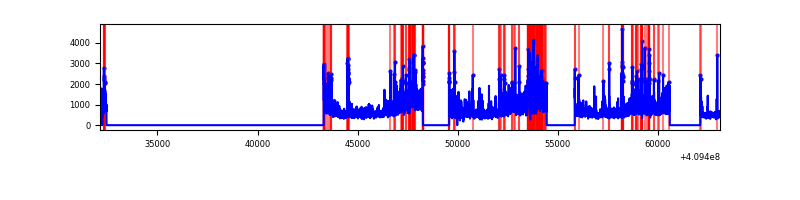 |
Top three noisy pixels from each quadrant. If the there are fewer than three noisy pixels in the level2.evt file, extra rows are filled as -1
| Pixel properties | Quadrant properties | ||||||
|---|---|---|---|---|---|---|---|
| Quadrant | DetID | PixID | Counts | Sigma | Mean | Median | Sigma |
| A | 10 | 83 | 1157720 | 3263.78 | 1741 | 1705 | 354.2 |
| A | 13 | 248 | 1129081 | 3182.92 | 1741 | 1705 | 354.2 |
| A | 13 | 6 | 28926 | 76.85 | 1741 | 1705 | 354.2 |
| B | 5 | 172 | 633907 | 1913.98 | 1732 | 1682 | 330.3 |
| B | 0 | 213 | 214094 | 643.05 | 1732 | 1682 | 330.3 |
| B | 0 | 229 | 154991 | 464.12 | 1732 | 1682 | 330.3 |
| C | 15 | 214 | 658077 | 1662.41 | 1697 | 1701 | 394.8 |
| C | 9 | 187 | 236951 | 595.82 | 1697 | 1701 | 394.8 |
| C | 3 | 233 | 65159 | 160.72 | 1697 | 1701 | 394.8 |
| D | 12 | 235 | 3974260 | 9551.58 | 1688 | 1637 | 415.9 |
| D | 13 | 171 | 363405 | 869.82 | 1688 | 1637 | 415.9 |
| D | 2 | 249 | 316119 | 756.12 | 1688 | 1637 | 415.9 |
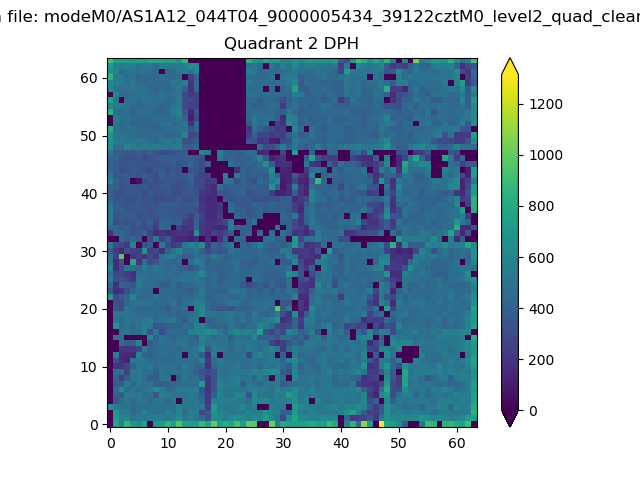
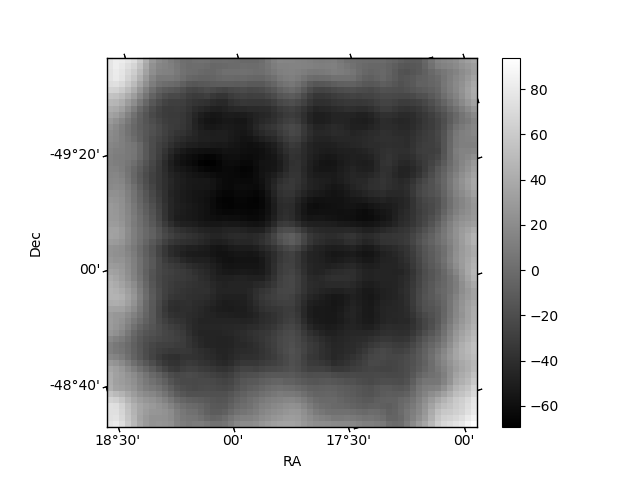
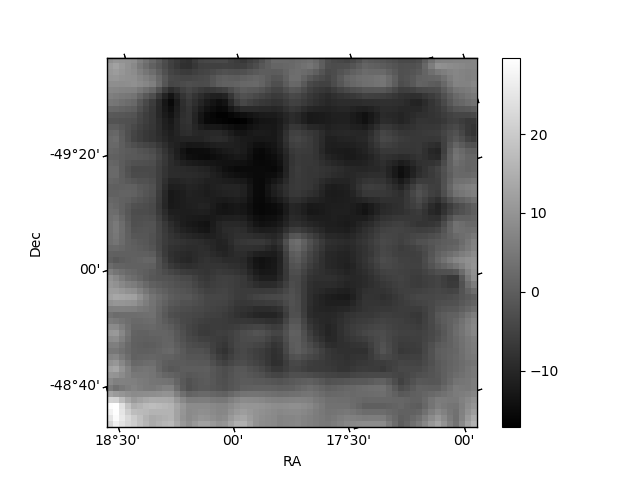
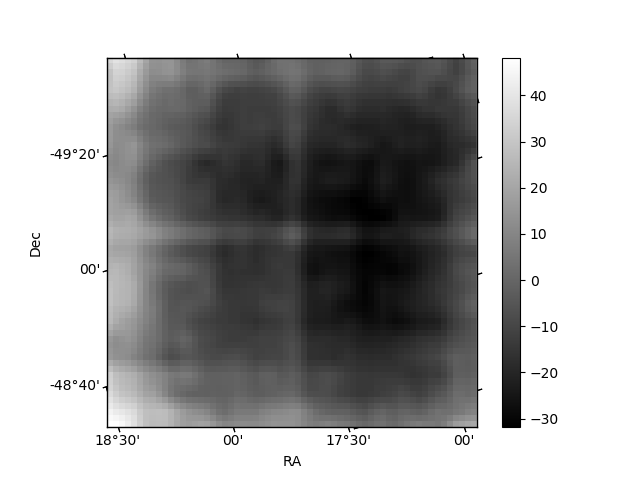
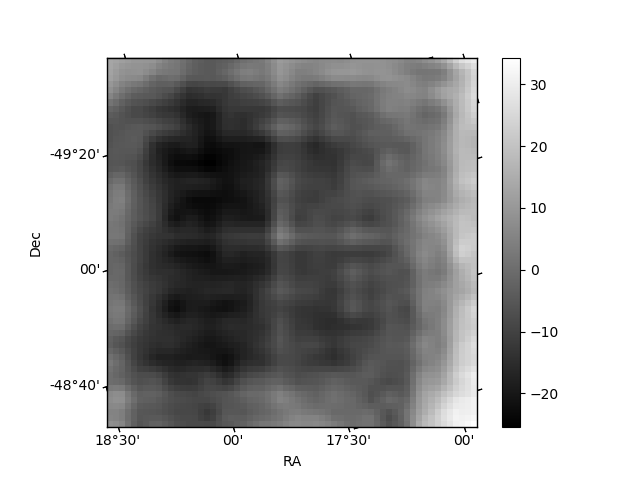
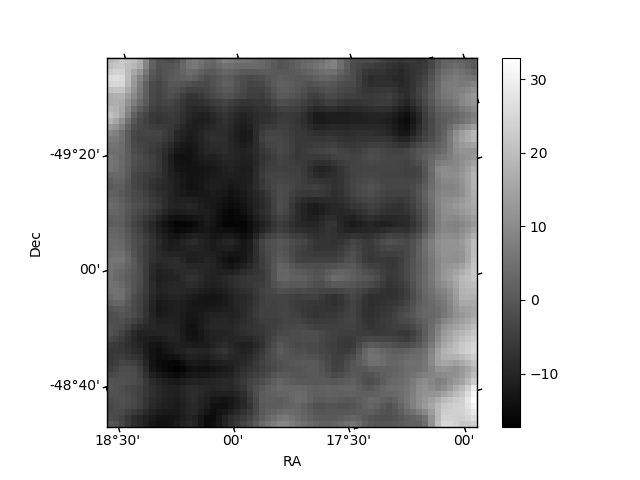
Histogram calculated using DETX and DETY for each event in the final _common_clean file
| Quadrant A | 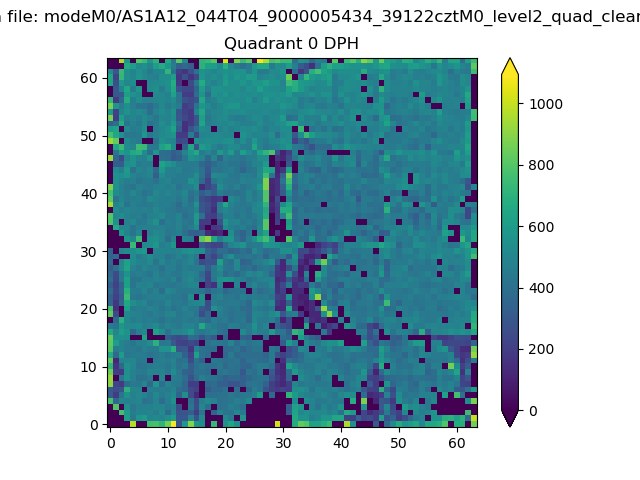 |
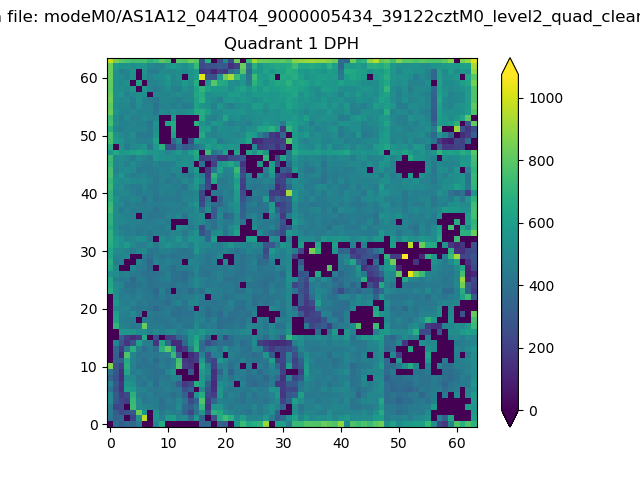 |
Quadrant B |
|---|---|---|---|
| Quadrant D | 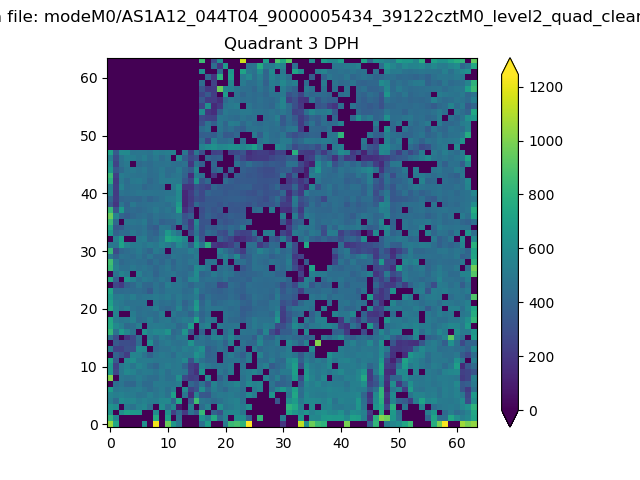 |
 |
Quadrant C |
| Plot type | Count rate plots | Images |
|---|---|---|
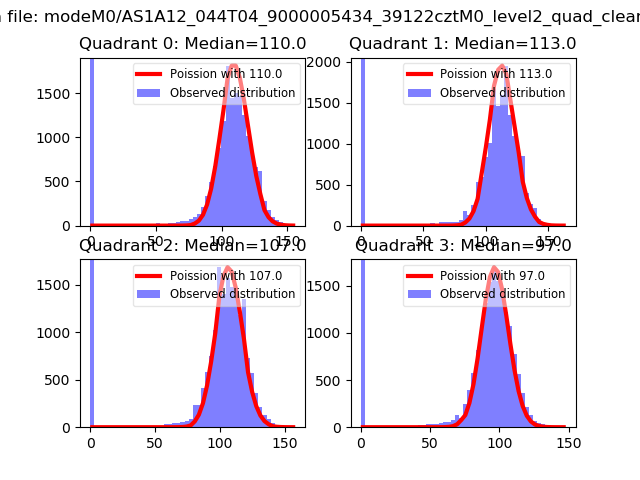
| Comparison with Poisson distribution Blue bars denote a histogram of data divided into 1 sec bins. Red curve is a Poisson curve with rate = median count rate of data. |
 |
 |
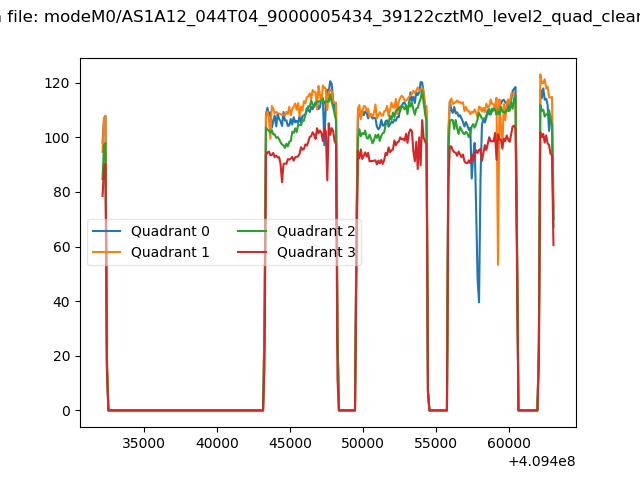
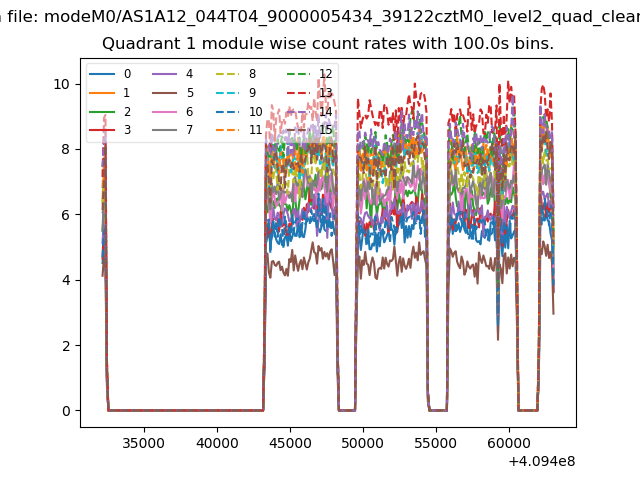
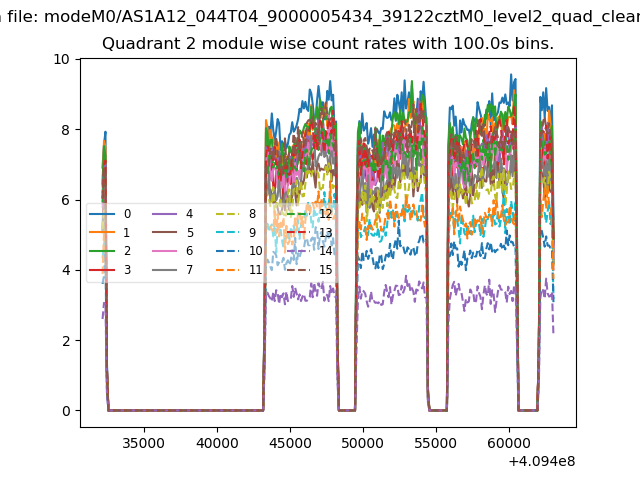
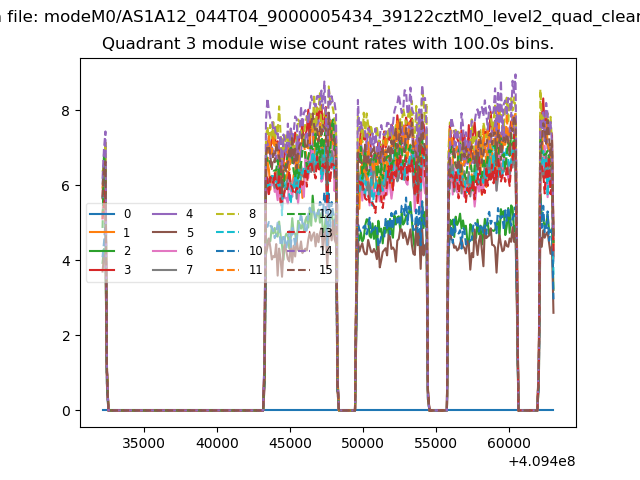
| Quadrant-wise count rates Data is divided into 100 sec bins |
 |
|
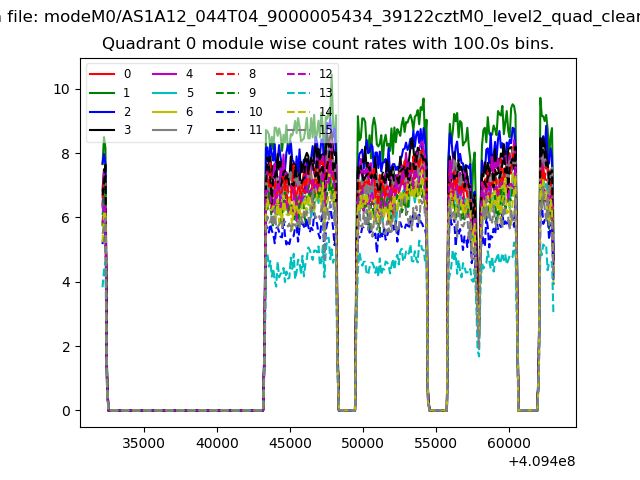
| Module-wise count rates for Quadrant A Data is divided into 100 sec bins |
 |
 |
| Module-wise count rates for Quadrant B Data is divided into 100 sec bins |
 |
 |
| Module-wise count rates for Quadrant C Data is divided into 100 sec bins |
 |
 |
| Module-wise count rates for Quadrant D Data is divided into 100 sec bins |
 |
 |
| Parameter | Plot |
|---|---|
| CZT HV Monitor | 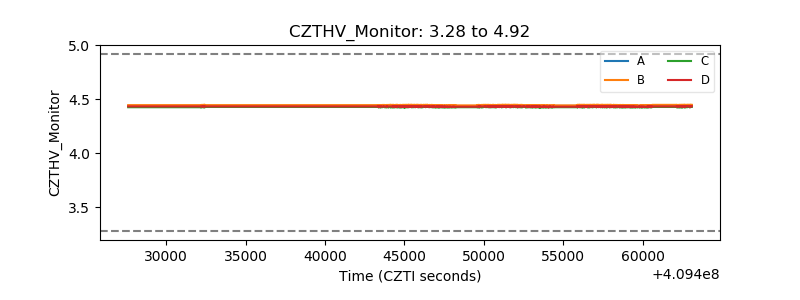 |
| D_VDD | 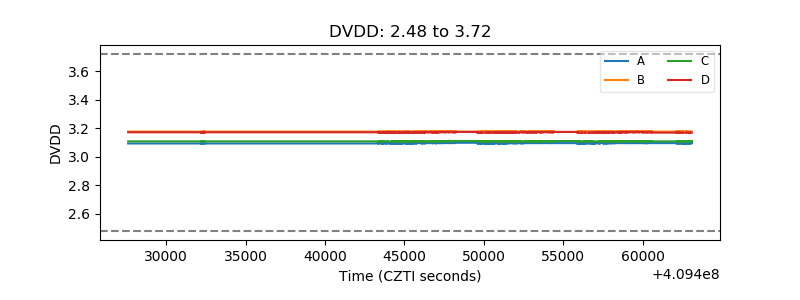 |
| Temperature 1 | 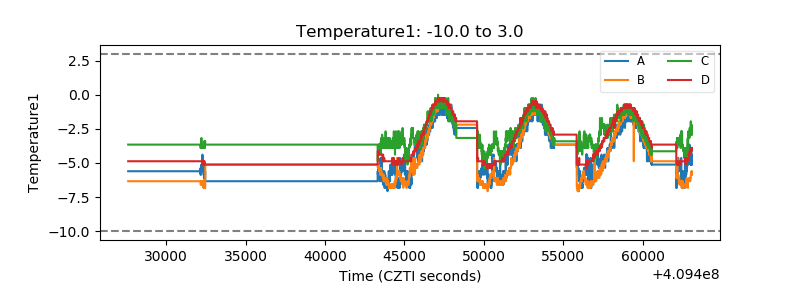 |
| Veto HV Monitor |  |
| Veto LLD | 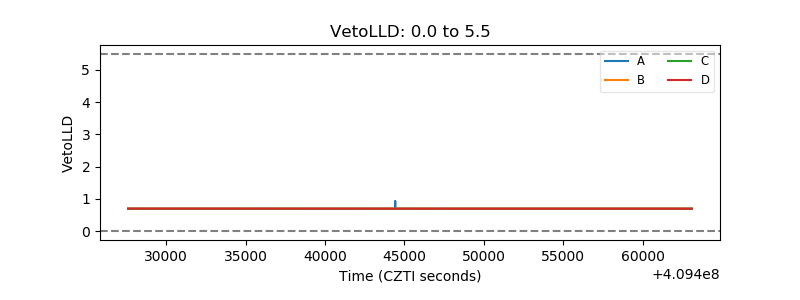 |
| Alpha Counter | 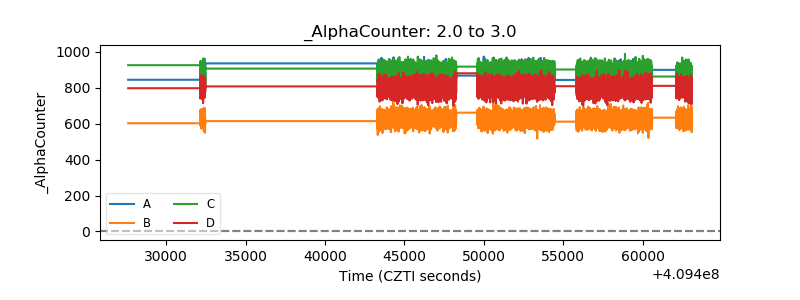 |
| _CPM_Rate | 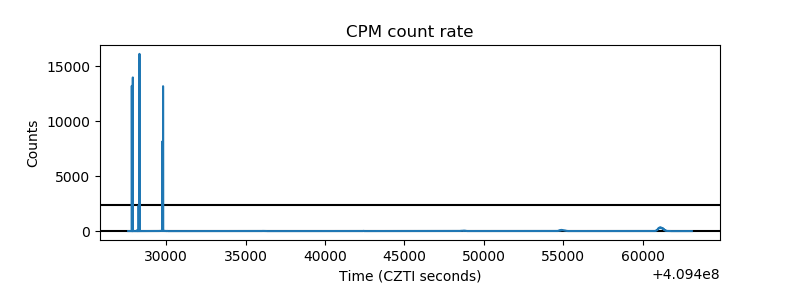 |
| CZT Counter | 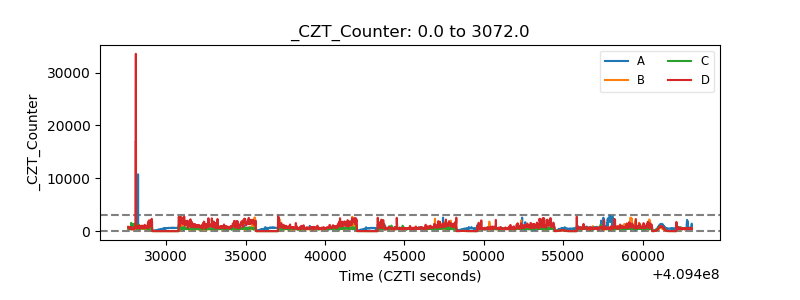 |
| +2.5 Volts monitor | 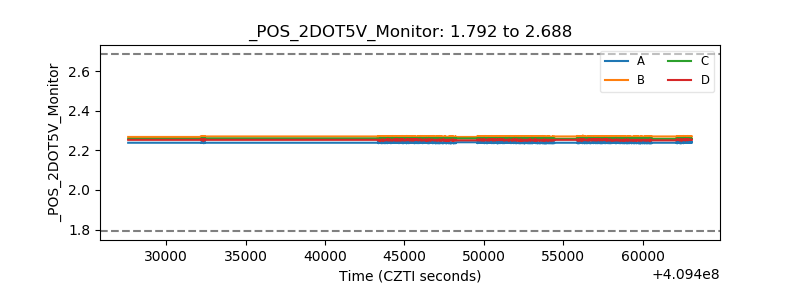 |
| +5 Volts monitor | 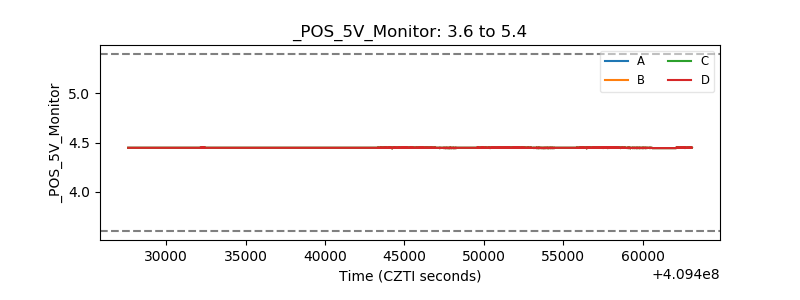 |
| _ROLL_ROT | 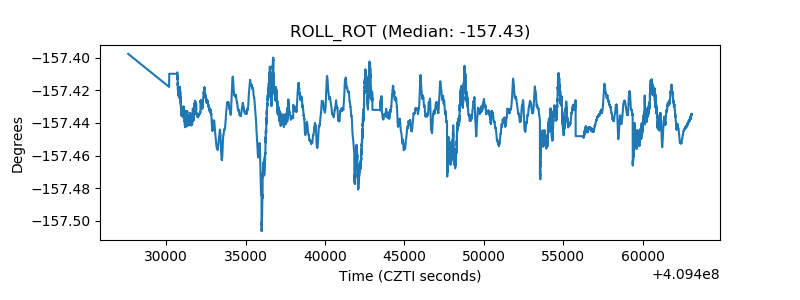 |
| _Roll_DEC | 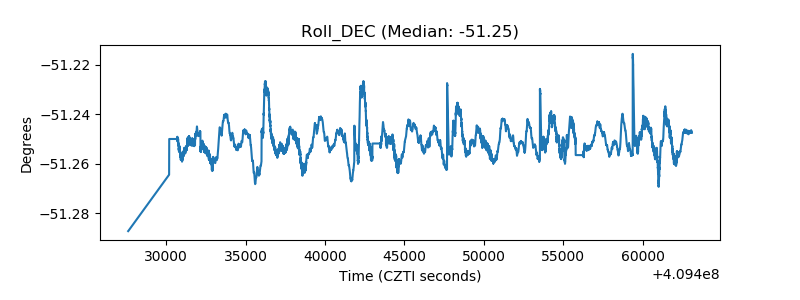 |
| _Roll_RA | 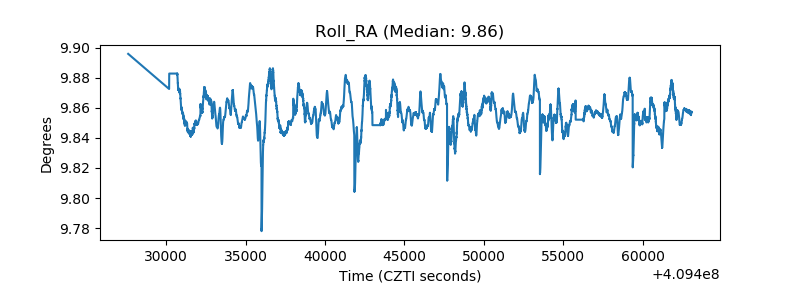 |
| Veto Counter | 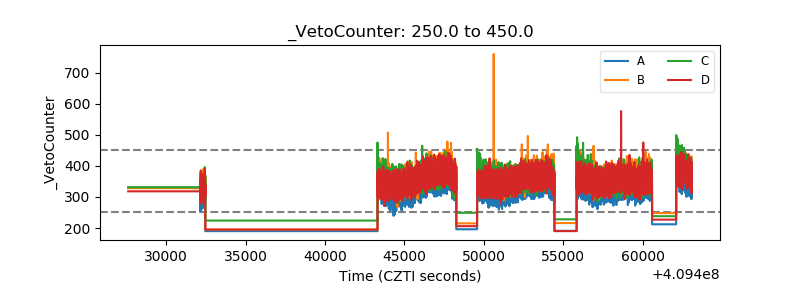 |