| Param | Original file | Final file |
|---|---|---|
| Filename | modeM0/AS1A12_044T04_9000005434_39123cztM0_level2.fits | modeM0/AS1A12_044T04_9000005434_39123cztM0_level2_quad_clean.evt |
| Size (bytes) | 2,038,478,400 | 492,387,840 |
| Size | 1.9 GB | 469.6 MB |
| Events in quadrant A | 16,212,035 | 3,321,129 |
| Events in quadrant B | 15,321,685 | 3,394,923 |
| Events in quadrant C | 14,369,609 | 3,238,526 |
| Events in quadrant D | 27,232,583 | 2,886,726 |
| Mode SS | |||
|---|---|---|---|
| Quadrant | BADHDUFLAG | Total packets | Discarded packets |
| A | 0 | 614 | 0 |
| B | 0 | 614 | 0 |
| C | 0 | 614 | 0 |
| D | 0 | 614 | 0 |
| Mode M0 | |||
|---|---|---|---|
| Quadrant | BADHDUFLAG | Total packets | Discarded packets |
| A | 0 | 66348 | 7 |
| B | 0 | 65895 | 6 |
| C | 0 | 61498 | 6 |
| D | 0 | 101465 | 6 |
| Mode M9 | |||
|---|---|---|---|
| Quadrant | BADHDUFLAG | Total packets | Discarded packets |
| A | 0 | 86 | 0 |
| B | 0 | 86 | 0 |
| C | 0 | 86 | 0 |
| D | 0 | 87 | 0 |
| Quadrant | Total seconds | Saturated seconds | Saturation percentage |
|---|---|---|---|
| A | 30062 | 346 | 1.150955% |
| B | 30062 | 404 | 1.343889% |
| C | 30062 | 37 | 0.123079% |
| D | 30062 | 1549 | 5.152684% |
Noise dominated data is calculated using 1-second bins in cleaned event files. If a bin has >2000 counts, and if more than 50% of those come from <1% of pixels, then it is considered to be noise-dominated and hence unusable.
| Quadrant | # 1 sec bins | Bins with >0 counts | Bins with >2000 counts | High rate bins dominated by noise | Noise dominated (total time) | Noise dominated (detector-on time) | Marked lightcurve |
|---|---|---|---|---|---|---|---|
| A | 38662 | 30068 | 262 | 262 | 0.68% | 0.87% | 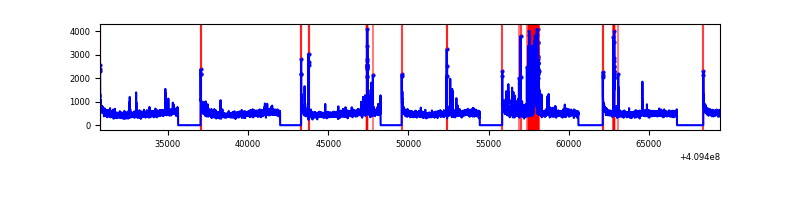 |
| B | 38662 | 30068 | 225 | 225 | 0.58% | 0.75% | 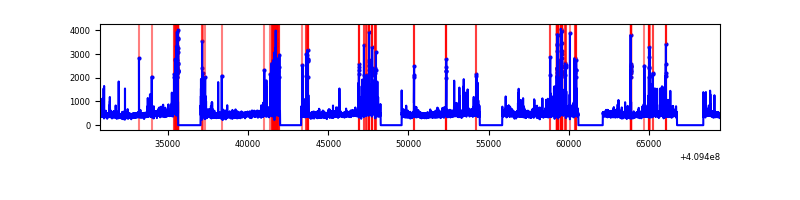 |
| C | 38662 | 30068 | 13 | 13 | 0.03% | 0.04% | 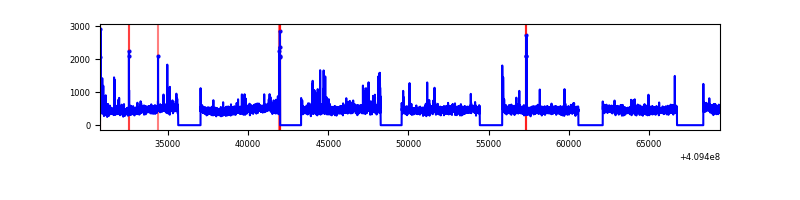 |
| D | 38662 | 30068 | 1385 | 1385 | 3.58% | 4.61% | 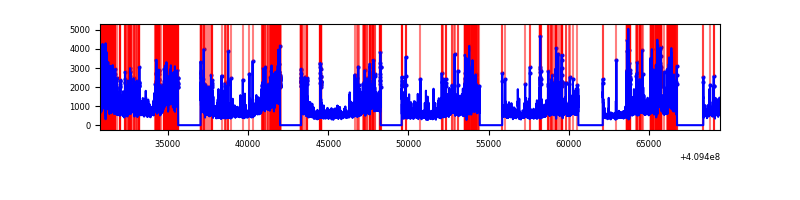 |
Top three noisy pixels from each quadrant. If the there are fewer than three noisy pixels in the level2.evt file, extra rows are filled as -1
| Pixel properties | Quadrant properties | ||||||
|---|---|---|---|---|---|---|---|
| Quadrant | DetID | PixID | Counts | Sigma | Mean | Median | Sigma |
| A | 10 | 83 | 2138174 | 3181.5 | 3322 | 3260 | 671.0 |
| A | 13 | 248 | 1166951 | 1734.16 | 3322 | 3260 | 671.0 |
| A | 13 | 254 | 39544 | 54.07 | 3322 | 3260 | 671.0 |
| B | 5 | 172 | 1195191 | 1898.03 | 3297 | 3199 | 628.0 |
| B | 0 | 213 | 237412 | 372.94 | 3297 | 3199 | 628.0 |
| B | 0 | 186 | 214641 | 336.68 | 3297 | 3199 | 628.0 |
| C | 15 | 214 | 1249191 | 1661.45 | 3232 | 3243 | 749.9 |
| C | 9 | 187 | 336901 | 444.93 | 3232 | 3243 | 749.9 |
| C | 3 | 233 | 130112 | 169.18 | 3232 | 3243 | 749.9 |
| D | 12 | 235 | 10740344 | 13865.81 | 3183 | 3090 | 774.4 |
| D | 2 | 249 | 1117439 | 1439.04 | 3183 | 3090 | 774.4 |
| D | 13 | 171 | 907815 | 1168.34 | 3183 | 3090 | 774.4 |
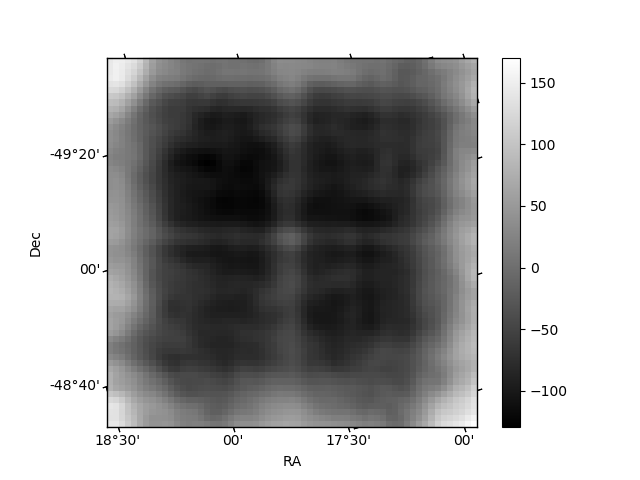
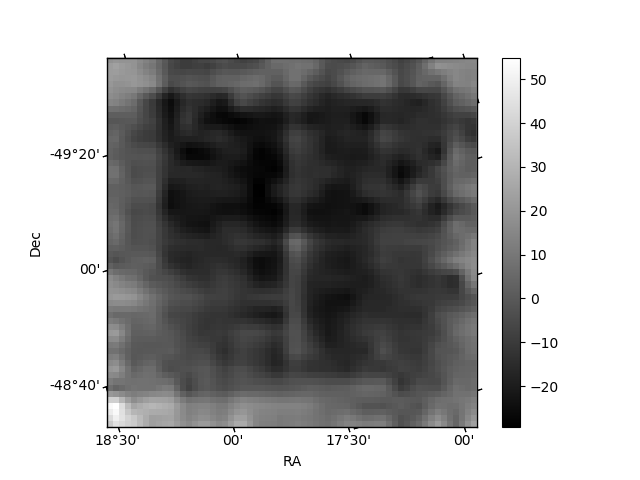
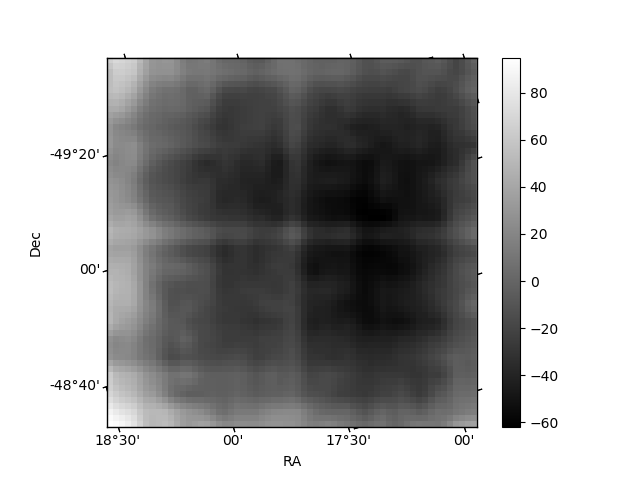
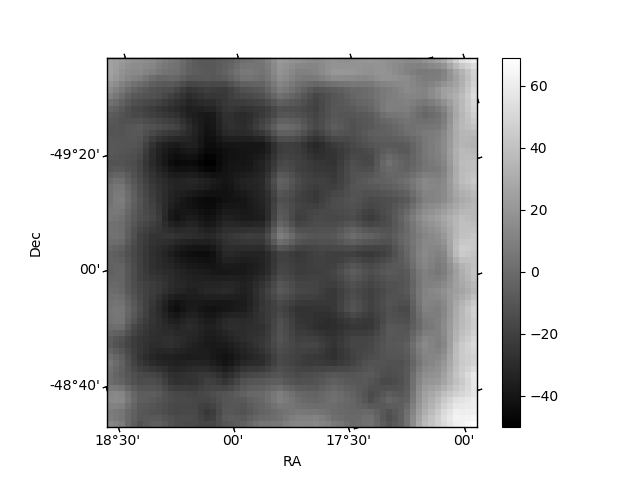
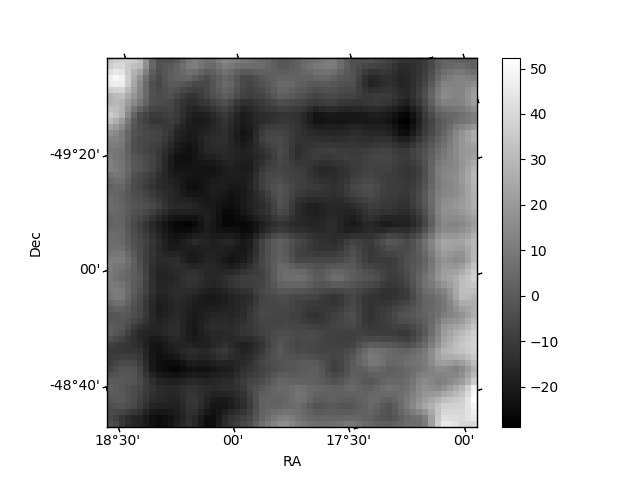
Histogram calculated using DETX and DETY for each event in the final _common_clean file
| Quadrant A | 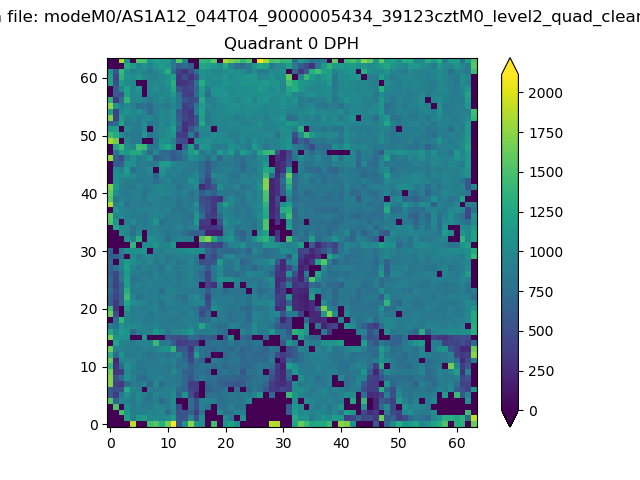 |
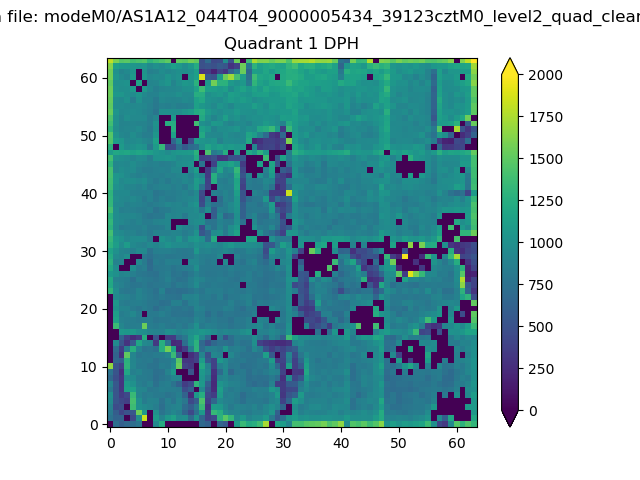 |
Quadrant B |
|---|---|---|---|
| Quadrant D | 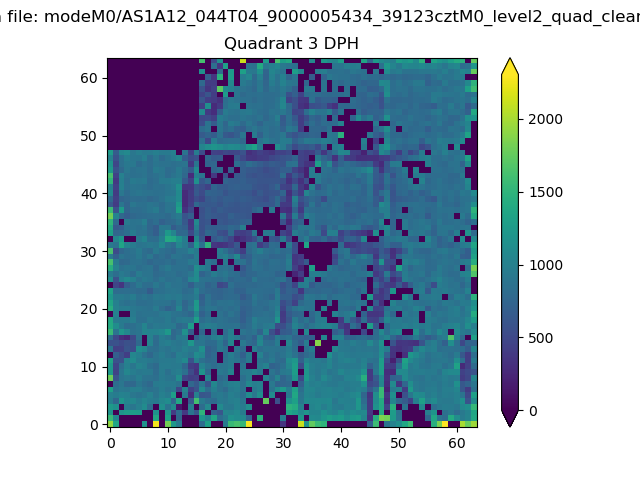 |
 |
Quadrant C |
| Plot type | Count rate plots | Images |
|---|---|---|
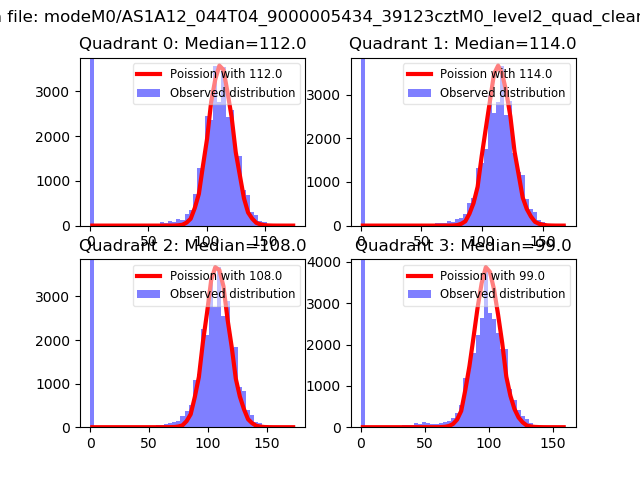
| Comparison with Poisson distribution Blue bars denote a histogram of data divided into 1 sec bins. Red curve is a Poisson curve with rate = median count rate of data. |
 |
 |
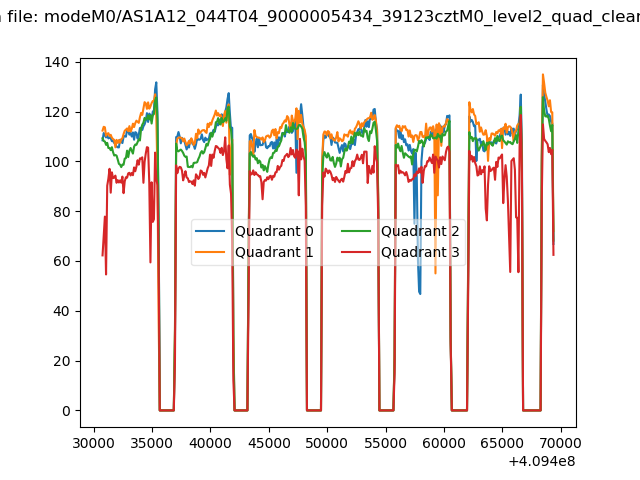
| Quadrant-wise count rates Data is divided into 100 sec bins |
 |
|
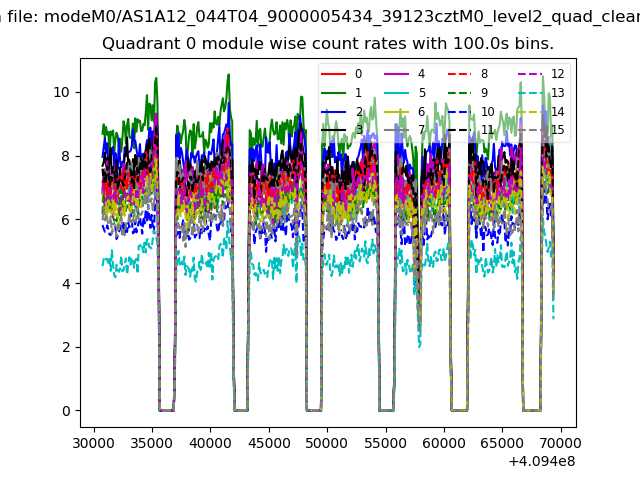
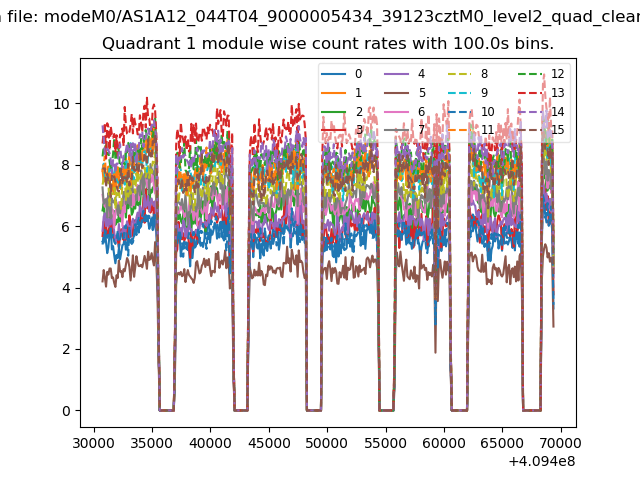
| Module-wise count rates for Quadrant A Data is divided into 100 sec bins |
 |
 |
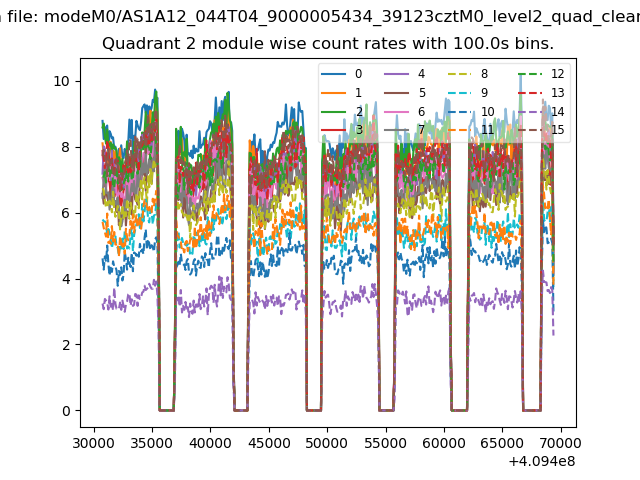
| Module-wise count rates for Quadrant B Data is divided into 100 sec bins |
 |
 |
| Module-wise count rates for Quadrant C Data is divided into 100 sec bins |
 |
 |
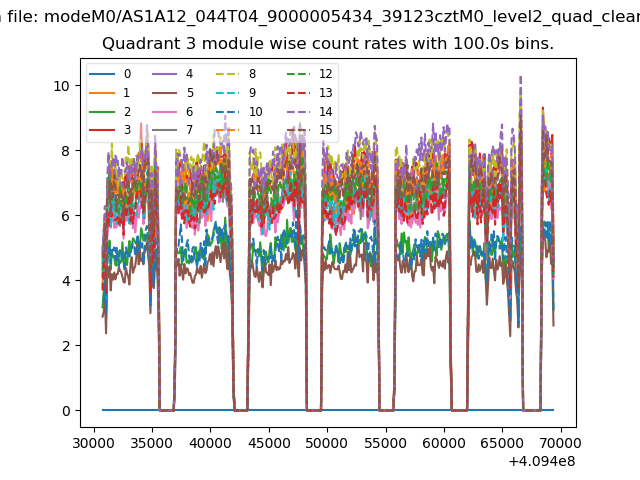
| Module-wise count rates for Quadrant D Data is divided into 100 sec bins |
 |
 |
| Parameter | Plot |
|---|---|
| CZT HV Monitor | 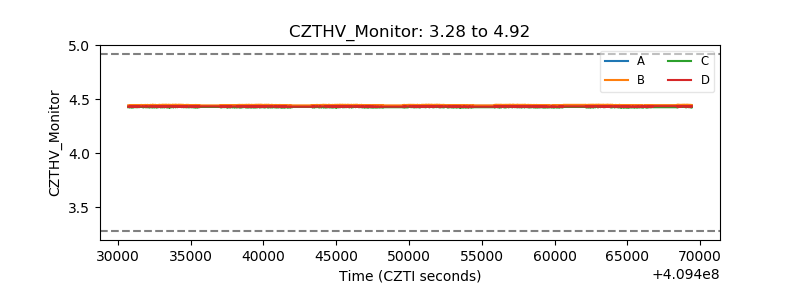 |
| D_VDD | 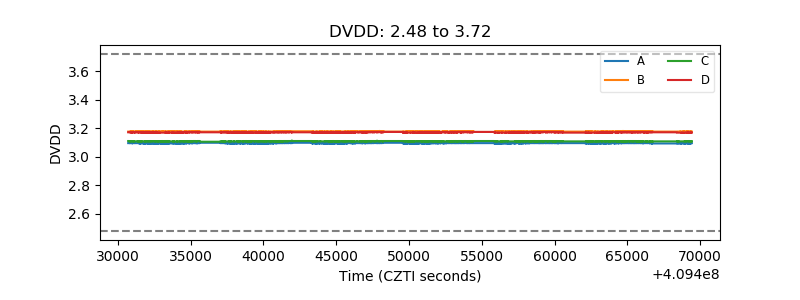 |
| Temperature 1 | 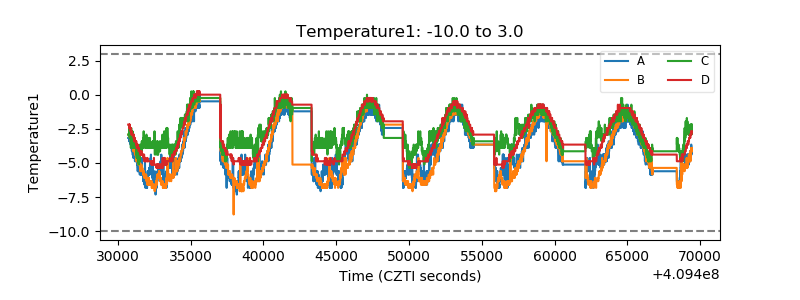 |
| Veto HV Monitor | 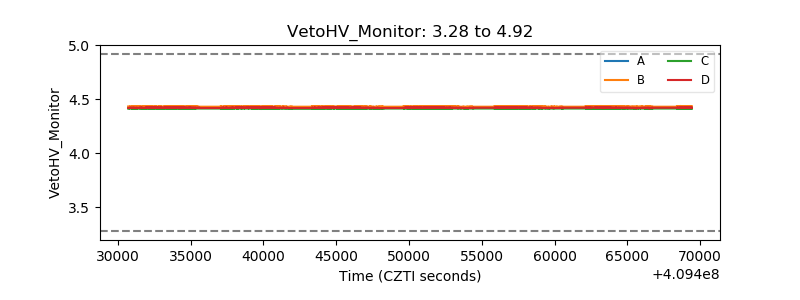 |
| Veto LLD | 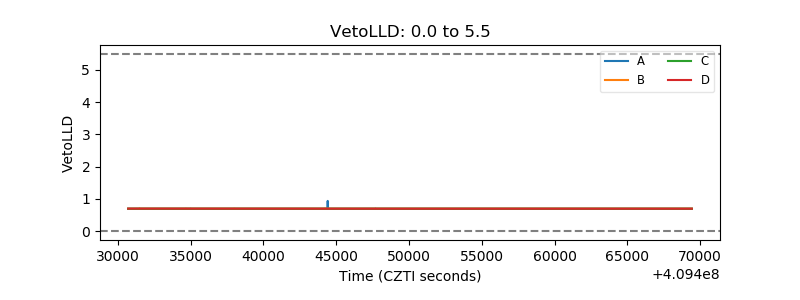 |
| Alpha Counter | 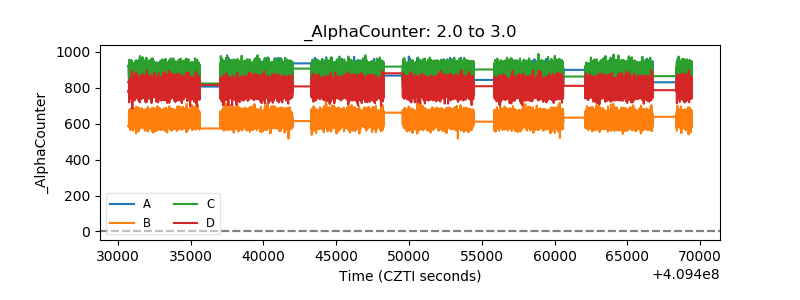 |
| _CPM_Rate | 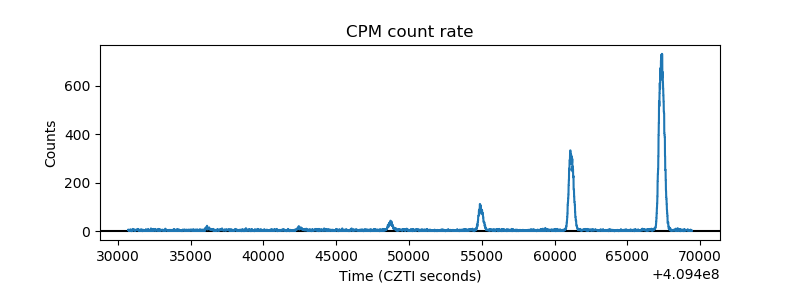 |
| CZT Counter |  |
| +2.5 Volts monitor | 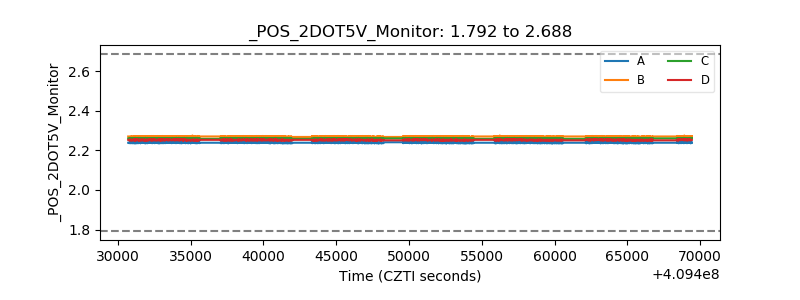 |
| +5 Volts monitor | 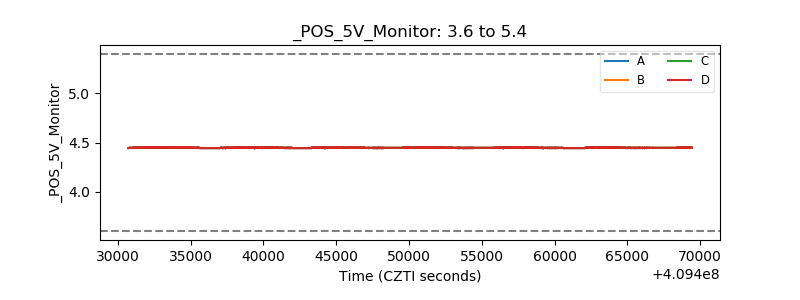 |
| _ROLL_ROT | 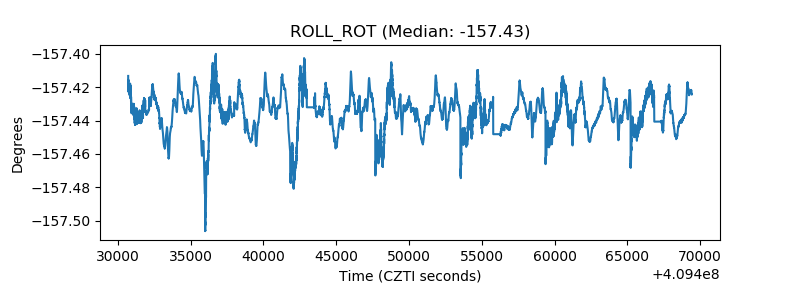 |
| _Roll_DEC |  |
| _Roll_RA | 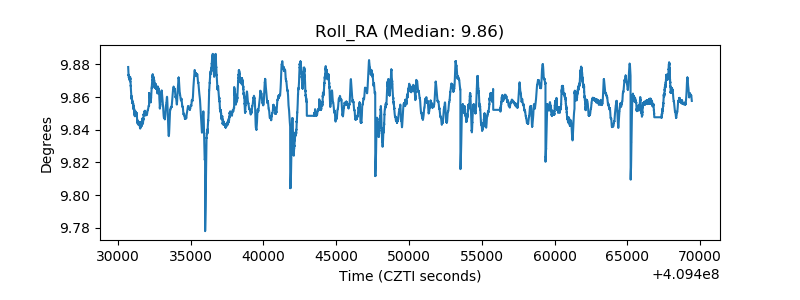 |
| Veto Counter | 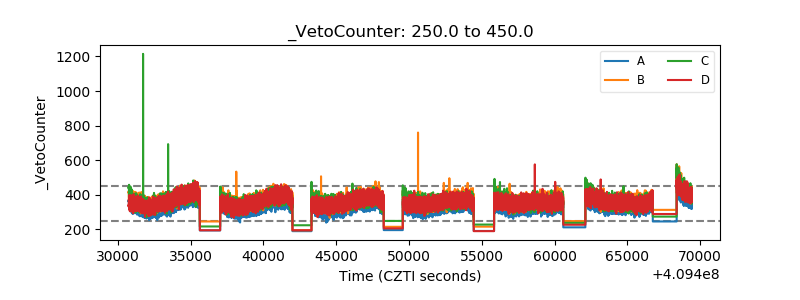 |