| Param | Original file | Final file |
|---|---|---|
| Filename | modeM0/AS1A12_044T04_9000005434_39125cztM0_level2.fits | modeM0/AS1A12_044T04_9000005434_39125cztM0_level2_quad_clean.evt |
| Size (bytes) | 399,021,120 | 92,975,040 |
| Size | 380.5 MB | 88.7 MB |
| Events in quadrant A | 2,851,668 | 630,899 |
| Events in quadrant B | 2,713,439 | 645,415 |
| Events in quadrant C | 2,704,423 | 617,607 |
| Events in quadrant D | 6,085,737 | 547,362 |
| Mode SS | |||
|---|---|---|---|
| Quadrant | BADHDUFLAG | Total packets | Discarded packets |
| A | 0 | 108 | 0 |
| B | 0 | 108 | 0 |
| C | 0 | 108 | 0 |
| D | 0 | 108 | 0 |
| Mode M0 | |||
|---|---|---|---|
| Quadrant | BADHDUFLAG | Total packets | Discarded packets |
| A | 0 | 11662 | 3 |
| B | 0 | 11501 | 2 |
| C | 0 | 11180 | 2 |
| D | 0 | 21986 | 2 |
| Mode M9 | |||
|---|---|---|---|
| Quadrant | BADHDUFLAG | Total packets | Discarded packets |
| A | 0 | 27 | 0 |
| B | 0 | 27 | 0 |
| C | 0 | 27 | 0 |
| D | 0 | 28 | 0 |
| Quadrant | Total seconds | Saturated seconds | Saturation percentage |
|---|---|---|---|
| A | 5346 | 11 | 0.205761% |
| B | 5346 | 61 | 1.141040% |
| C | 5346 | 5 | 0.093528% |
| D | 5346 | 389 | 7.276468% |
Noise dominated data is calculated using 1-second bins in cleaned event files. If a bin has >2000 counts, and if more than 50% of those come from <1% of pixels, then it is considered to be noise-dominated and hence unusable.
| Quadrant | # 1 sec bins | Bins with >0 counts | Bins with >2000 counts | High rate bins dominated by noise | Noise dominated (total time) | Noise dominated (detector-on time) | Marked lightcurve |
|---|---|---|---|---|---|---|---|
| A | 7108 | 5347 | 5 | 5 | 0.07% | 0.09% | 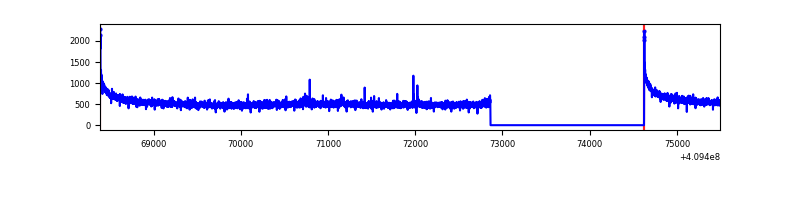 |
| B | 7108 | 5347 | 39 | 39 | 0.55% | 0.73% | 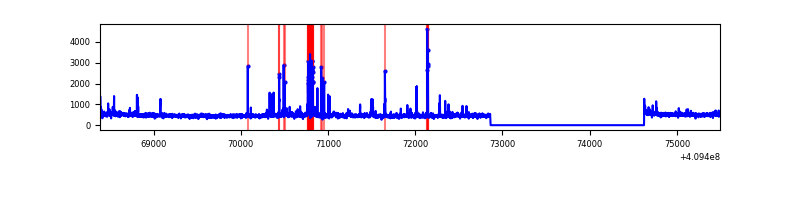 |
| C | 7108 | 5347 | 1 | 1 | 0.01% | 0.02% | 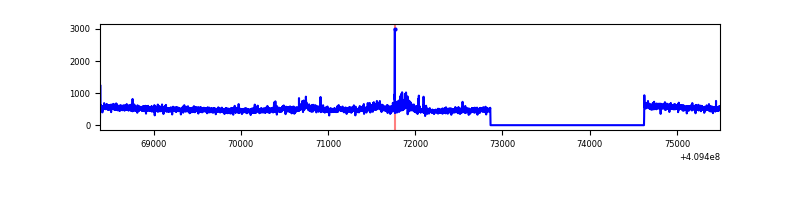 |
| D | 7108 | 5347 | 495 | 495 | 6.96% | 9.26% | 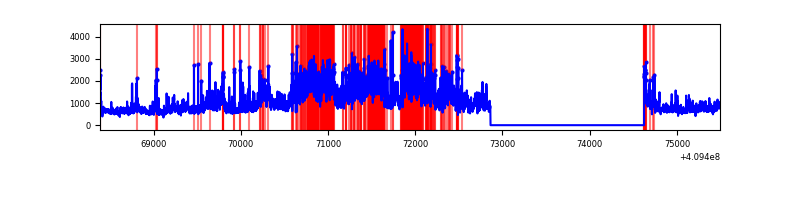 |
Top three noisy pixels from each quadrant. If the there are fewer than three noisy pixels in the level2.evt file, extra rows are filled as -1
| Pixel properties | Quadrant properties | ||||||
|---|---|---|---|---|---|---|---|
| Quadrant | DetID | PixID | Counts | Sigma | Mean | Median | Sigma |
| A | 10 | 83 | 457373 | 3699.16 | 613 | 601 | 123.5 |
| A | 13 | 248 | 16283 | 127.0 | 613 | 601 | 123.5 |
| A | 13 | 254 | 7286 | 54.14 | 613 | 601 | 123.5 |
| B | 5 | 172 | 227205 | 1966.24 | 607 | 591 | 115.3 |
| B | 0 | 190 | 32618 | 277.89 | 607 | 591 | 115.3 |
| B | 0 | 230 | 24274 | 205.49 | 607 | 591 | 115.3 |
| C | 15 | 214 | 229769 | 1648.63 | 596 | 597 | 139.0 |
| C | 3 | 233 | 108169 | 773.86 | 596 | 597 | 139.0 |
| C | 9 | 187 | 37190 | 263.25 | 596 | 597 | 139.0 |
| D | 12 | 235 | 2934427 | 20270.39 | 586 | 567 | 144.7 |
| D | 2 | 249 | 335060 | 2311.05 | 586 | 567 | 144.7 |
| D | 12 | 233 | 87477 | 600.47 | 586 | 567 | 144.7 |
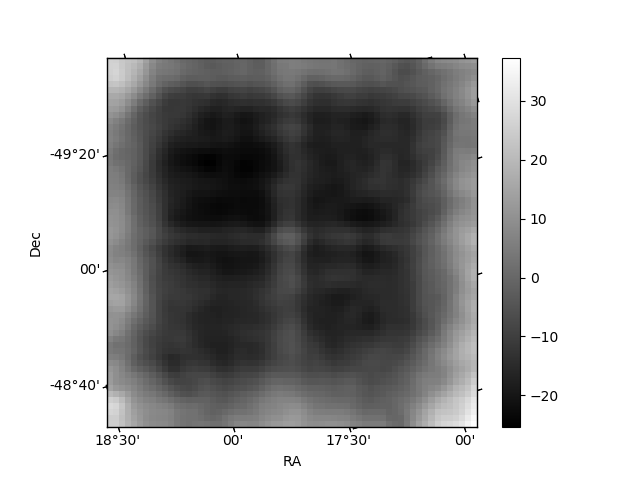
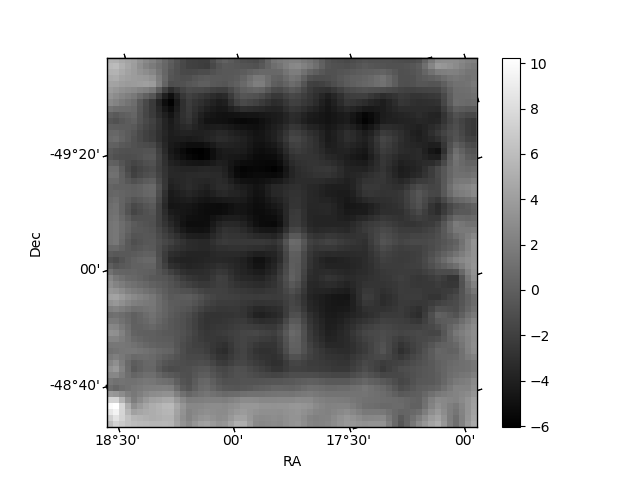
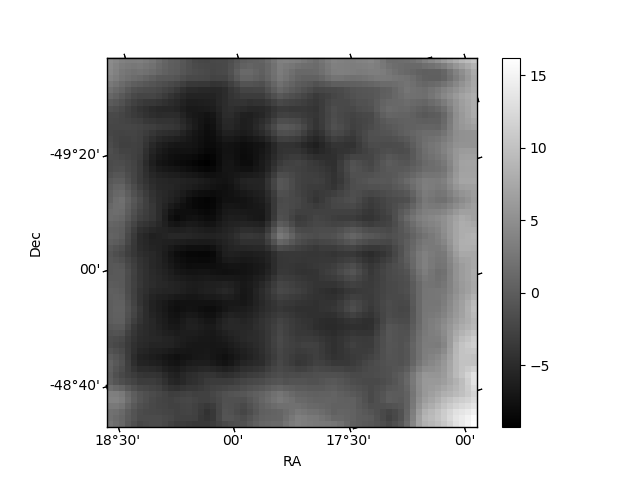
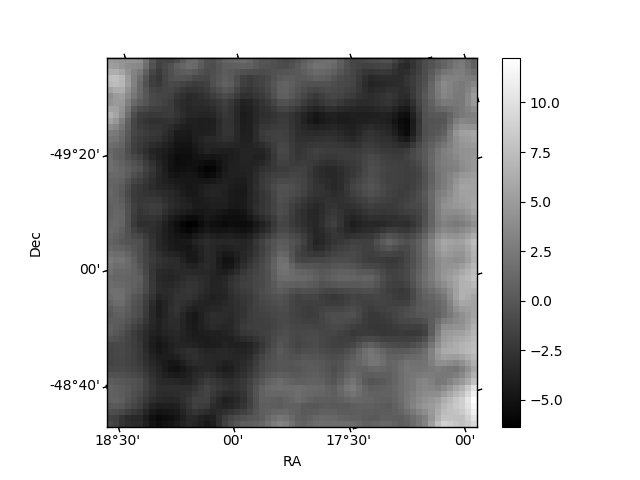
Histogram calculated using DETX and DETY for each event in the final _common_clean file
| Quadrant A | 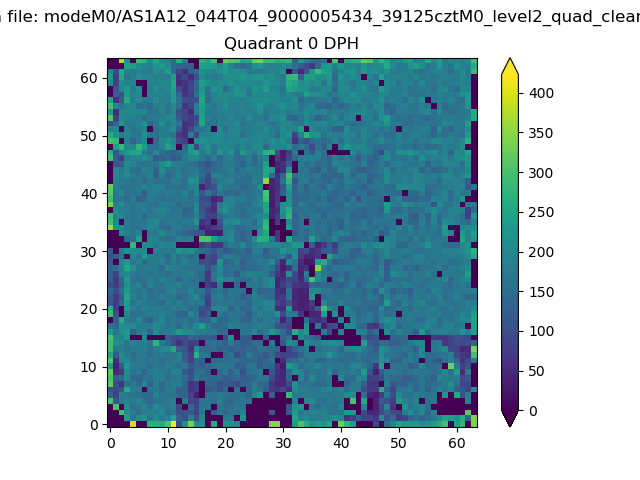 |
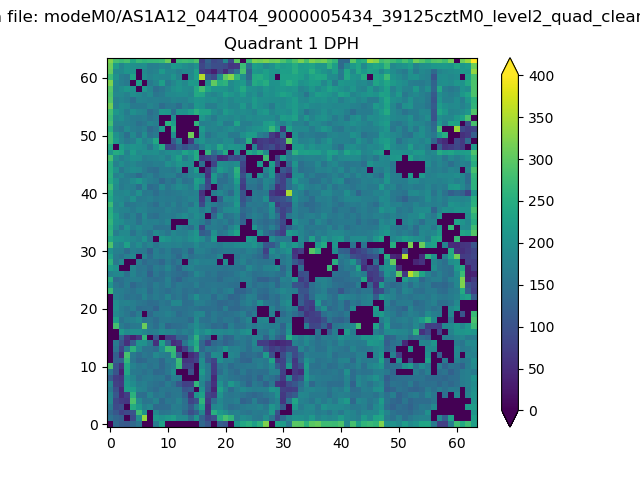 |
Quadrant B |
|---|---|---|---|
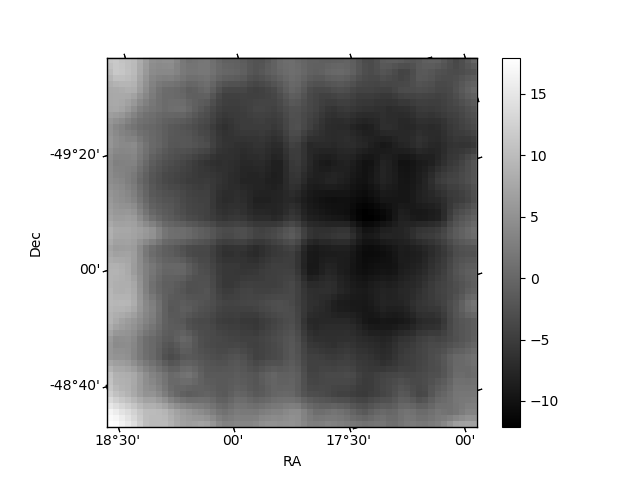
| Quadrant D | 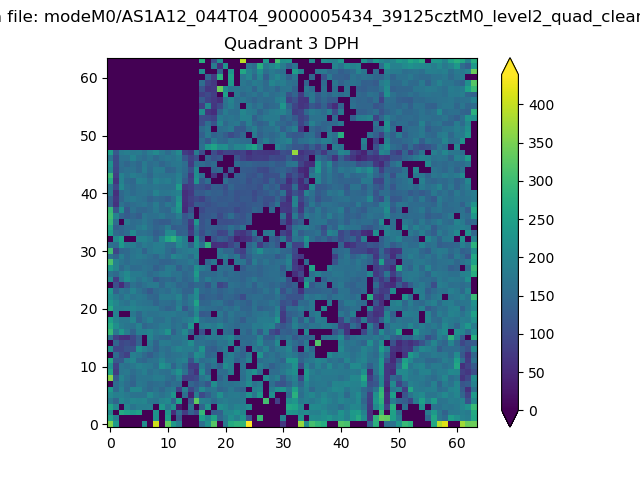 |
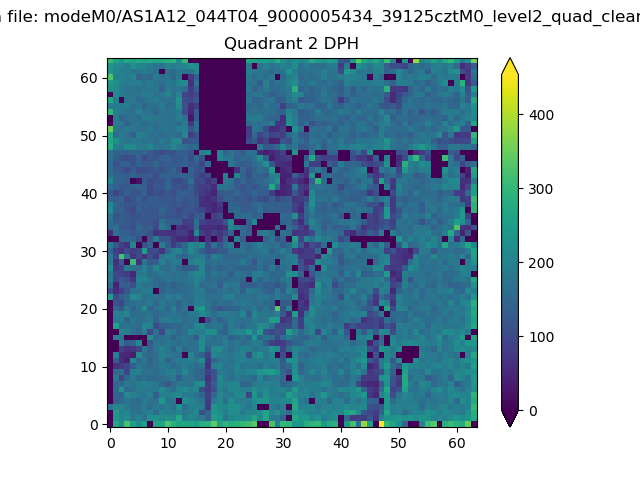 |
Quadrant C |
| Plot type | Count rate plots | Images |
|---|---|---|
| Comparison with Poisson distribution Blue bars denote a histogram of data divided into 1 sec bins. Red curve is a Poisson curve with rate = median count rate of data. |
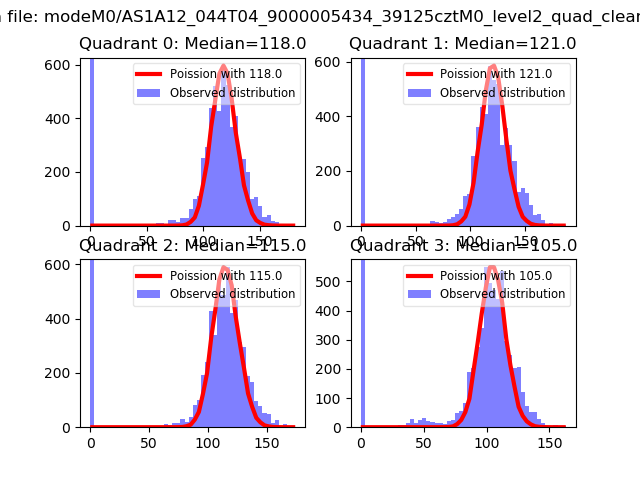 |
 |
| Quadrant-wise count rates Data is divided into 100 sec bins |
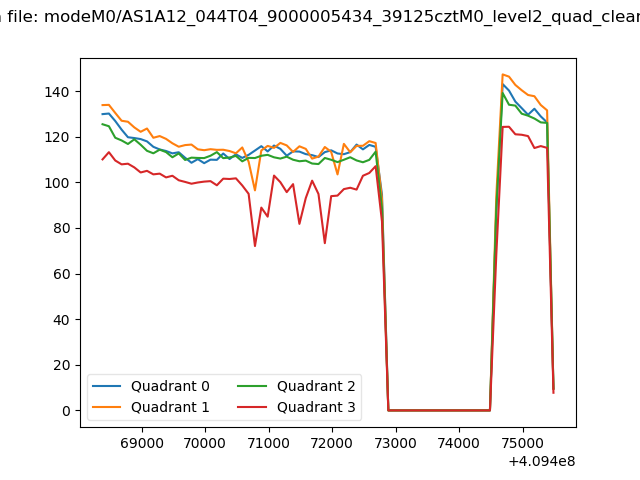 |
|
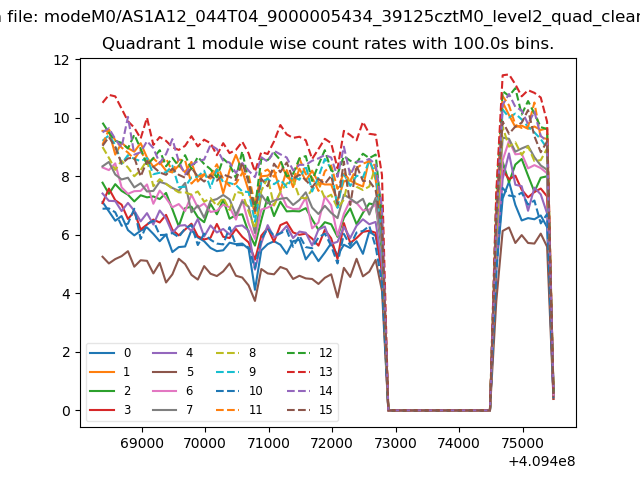
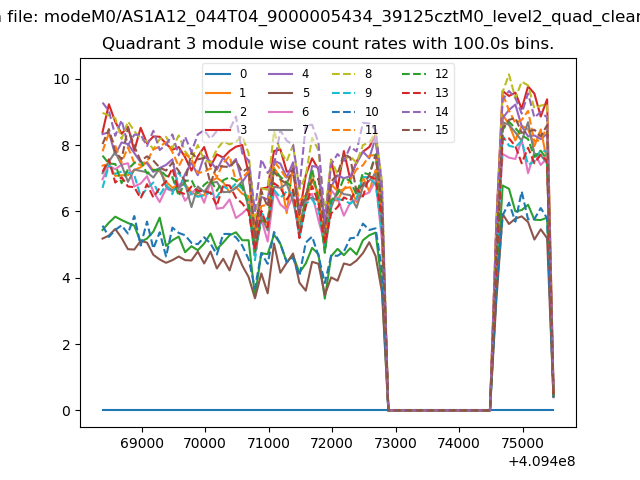
| Module-wise count rates for Quadrant A Data is divided into 100 sec bins |
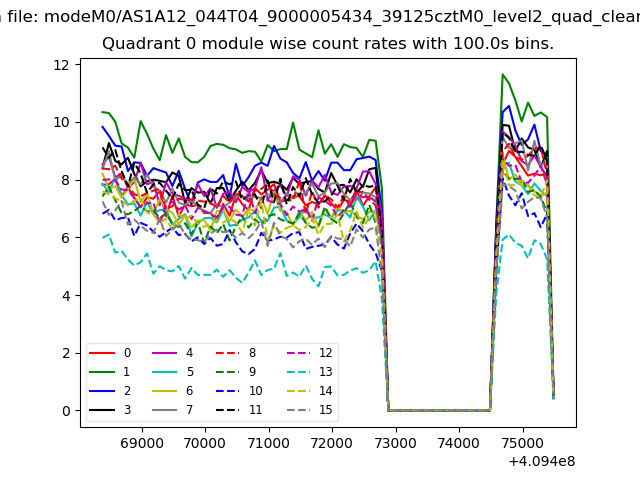 |
 |
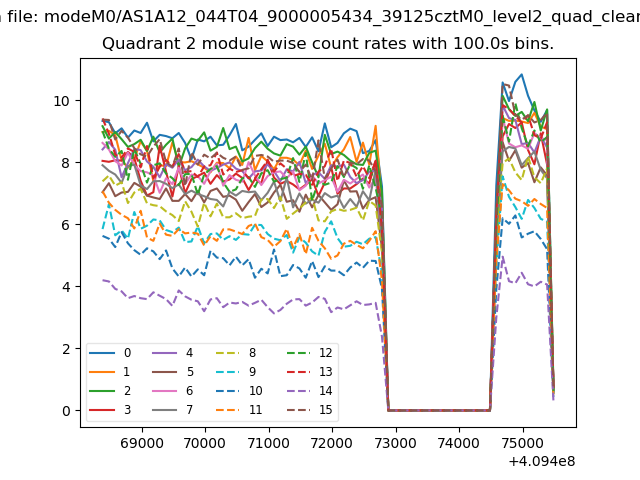
| Module-wise count rates for Quadrant B Data is divided into 100 sec bins |
 |
 |
| Module-wise count rates for Quadrant C Data is divided into 100 sec bins |
 |
 |
| Module-wise count rates for Quadrant D Data is divided into 100 sec bins |
 |
 |
| Parameter | Plot |
|---|---|
| CZT HV Monitor |  |
| D_VDD | 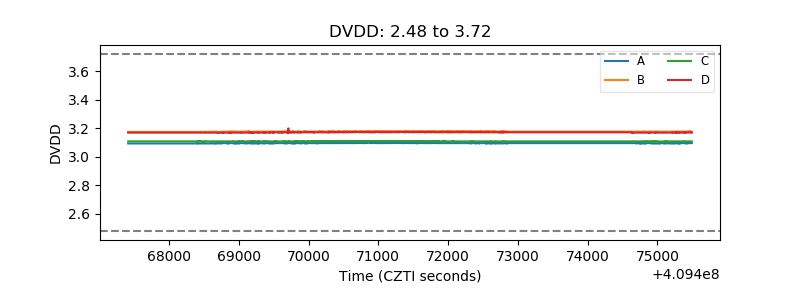 |
| Temperature 1 | 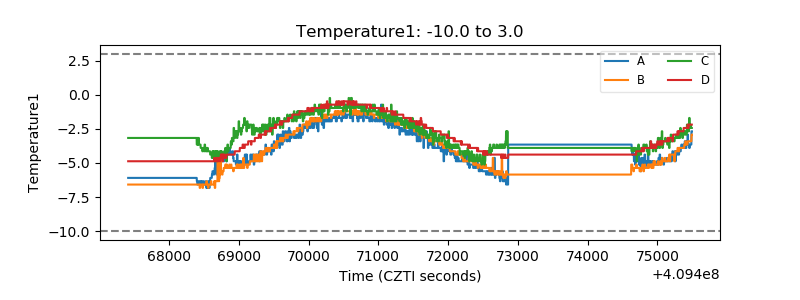 |
| Veto HV Monitor | 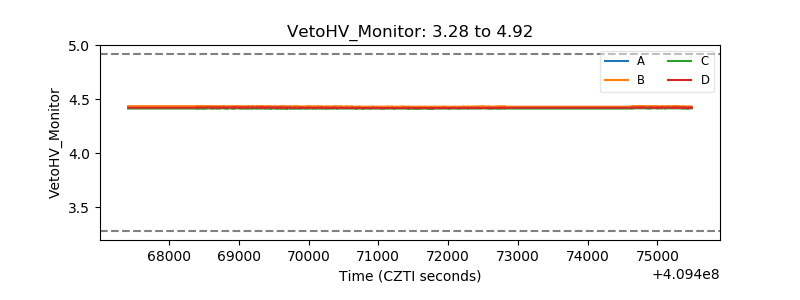 |
| Veto LLD | 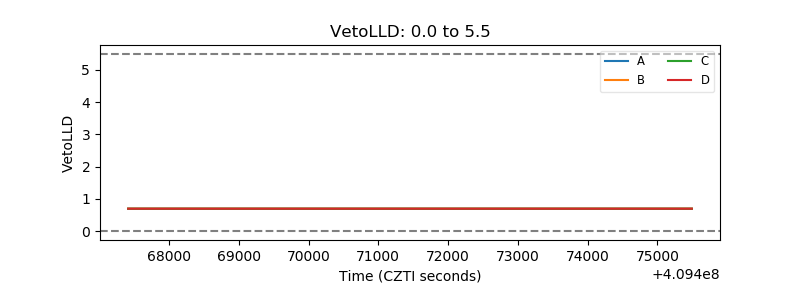 |
| Alpha Counter | 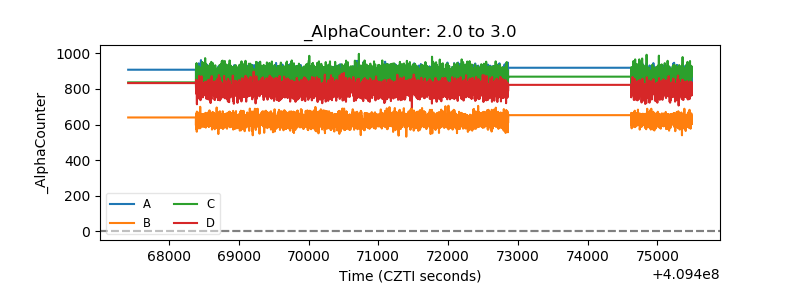 |
| _CPM_Rate | 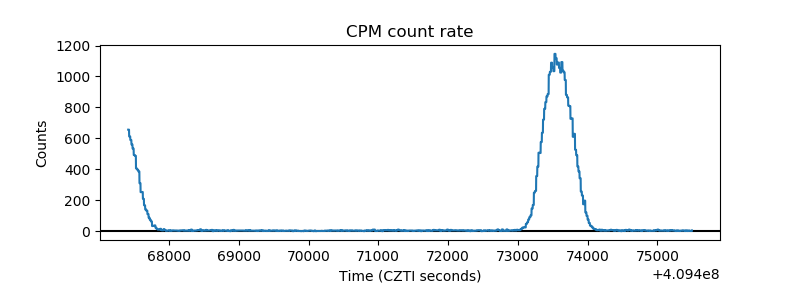 |
| CZT Counter | 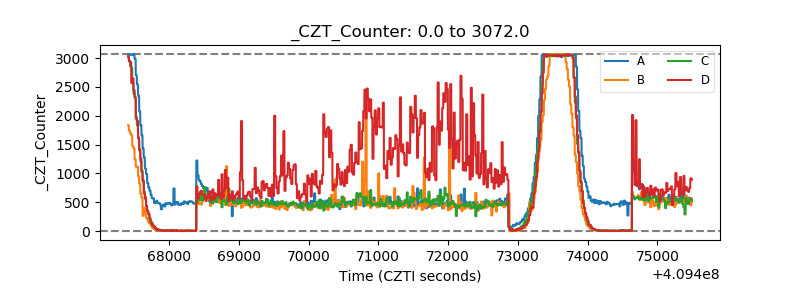 |
| +2.5 Volts monitor | 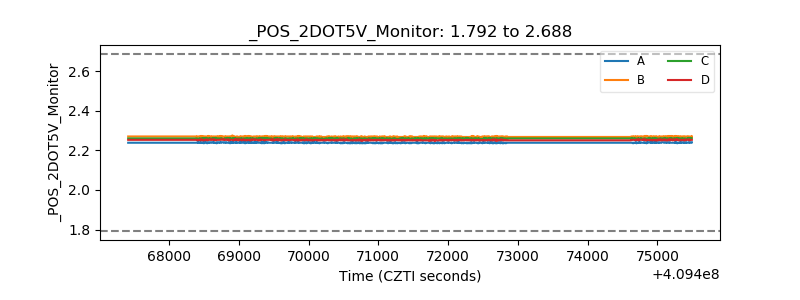 |
| +5 Volts monitor | 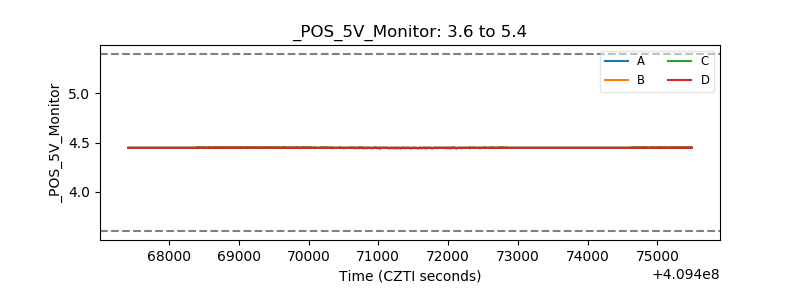 |
| _ROLL_ROT | 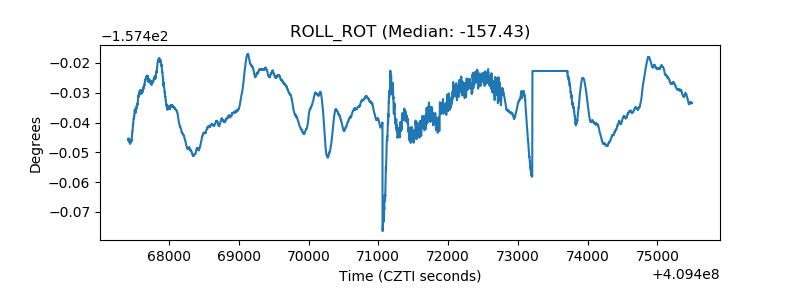 |
| _Roll_DEC | 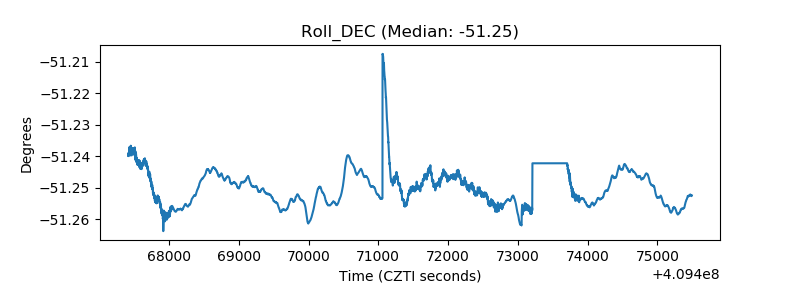 |
| _Roll_RA | 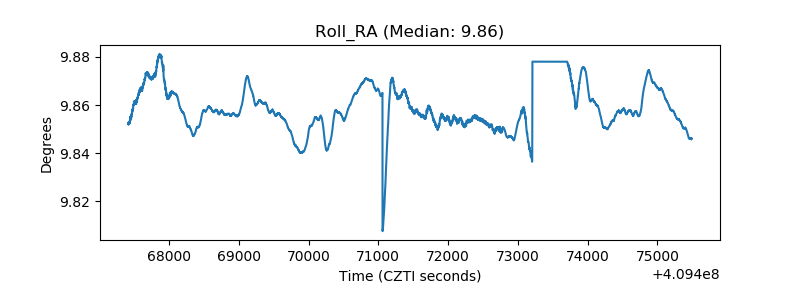 |
| Veto Counter | 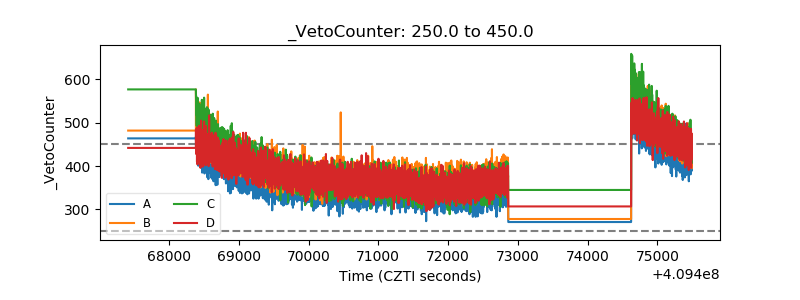 |