| Param | Original file | Final file |
|---|---|---|
| Filename | modeM0/AS1A12_044T04_9000005434_39126cztM0_level2.fits | modeM0/AS1A12_044T04_9000005434_39126cztM0_level2_quad_clean.evt |
| Size (bytes) | 264,522,240 | 62,614,080 |
| Size | 252.3 MB | 59.7 MB |
| Events in quadrant A | 1,868,998 | 428,204 |
| Events in quadrant B | 1,739,074 | 438,254 |
| Events in quadrant C | 1,749,263 | 419,231 |
| Events in quadrant D | 4,163,095 | 364,569 |
| Mode SS | |||
|---|---|---|---|
| Quadrant | BADHDUFLAG | Total packets | Discarded packets |
| A | 0 | 68 | 0 |
| B | 0 | 68 | 0 |
| C | 0 | 68 | 0 |
| D | 0 | 68 | 0 |
| Mode M0 | |||
|---|---|---|---|
| Quadrant | BADHDUFLAG | Total packets | Discarded packets |
| A | 0 | 7533 | 1 |
| B | 0 | 7349 | 1 |
| C | 0 | 7306 | 1 |
| D | 0 | 14878 | 1 |
| Mode M9 | |||
|---|---|---|---|
| Quadrant | BADHDUFLAG | Total packets | Discarded packets |
| A | 0 | 9 | 0 |
| B | 0 | 9 | 0 |
| C | 0 | 9 | 0 |
| D | 0 | 10 | 0 |
| Quadrant | Total seconds | Saturated seconds | Saturation percentage |
|---|---|---|---|
| A | 3476 | 5 | 0.143843% |
| B | 3476 | 19 | 0.546605% |
| C | 3476 | 3 | 0.086306% |
| D | 3476 | 316 | 9.090909% |
Noise dominated data is calculated using 1-second bins in cleaned event files. If a bin has >2000 counts, and if more than 50% of those come from <1% of pixels, then it is considered to be noise-dominated and hence unusable.
| Quadrant | # 1 sec bins | Bins with >0 counts | Bins with >2000 counts | High rate bins dominated by noise | Noise dominated (total time) | Noise dominated (detector-on time) | Marked lightcurve |
|---|---|---|---|---|---|---|---|
| A | 3476 | 3476 | 3 | 3 | 0.09% | 0.09% | 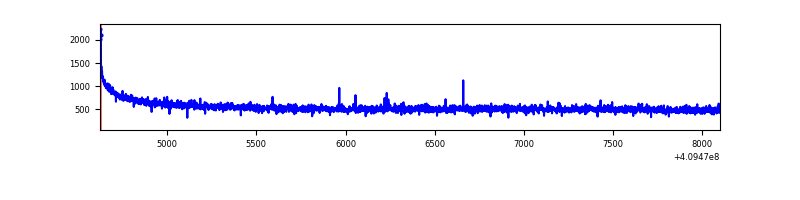 |
| B | 3476 | 3476 | 9 | 9 | 0.26% | 0.26% | 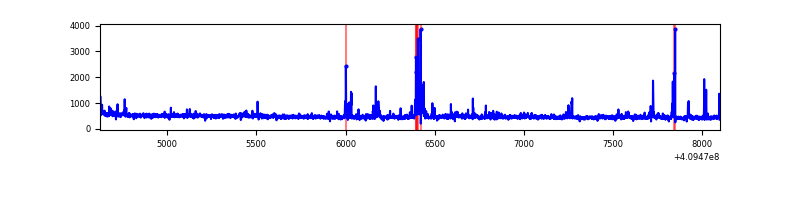 |
| C | 3476 | 3476 | 0 | 0 | 0.00% | 0.00% | 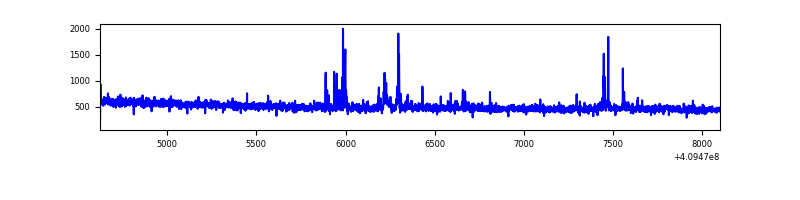 |
| D | 3476 | 3476 | 384 | 384 | 11.05% | 11.05% | 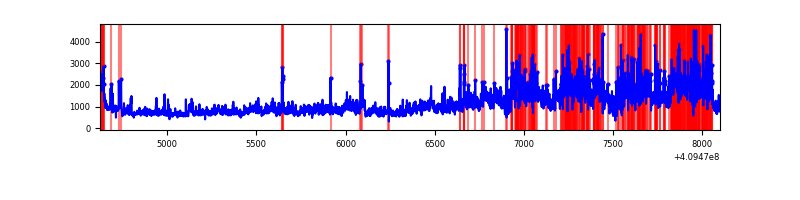 |
Top three noisy pixels from each quadrant. If the there are fewer than three noisy pixels in the level2.evt file, extra rows are filled as -1
| Pixel properties | Quadrant properties | ||||||
|---|---|---|---|---|---|---|---|
| Quadrant | DetID | PixID | Counts | Sigma | Mean | Median | Sigma |
| A | 10 | 83 | 285434 | 3464.07 | 406 | 399 | 82.3 |
| A | 13 | 248 | 6747 | 77.15 | 406 | 399 | 82.3 |
| A | 13 | 254 | 5566 | 62.8 | 406 | 399 | 82.3 |
| B | 5 | 172 | 97638 | 1275.0 | 399 | 390 | 76.3 |
| B | 0 | 230 | 14101 | 179.76 | 399 | 390 | 76.3 |
| B | 0 | 186 | 13219 | 168.2 | 399 | 390 | 76.3 |
| C | 15 | 214 | 146264 | 1606.8 | 389 | 392 | 90.8 |
| C | 9 | 187 | 57103 | 624.68 | 389 | 392 | 90.8 |
| C | 3 | 233 | 19272 | 207.97 | 389 | 392 | 90.8 |
| D | 12 | 235 | 1857514 | 20027.96 | 383 | 371 | 92.7 |
| D | 2 | 249 | 628372 | 6772.54 | 383 | 371 | 92.7 |
| D | 5 | 222 | 50341 | 538.89 | 383 | 371 | 92.7 |
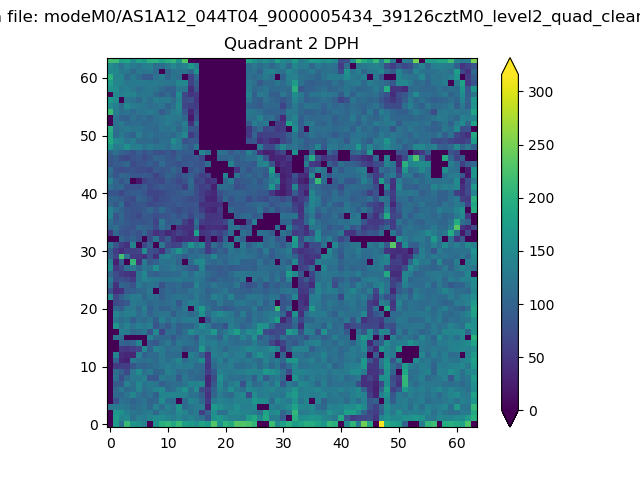
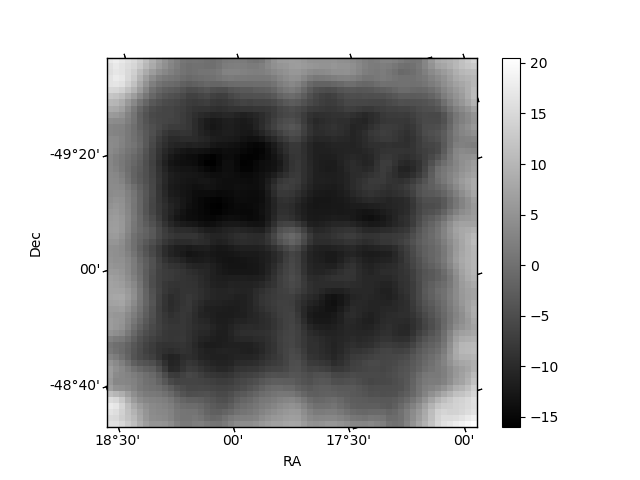
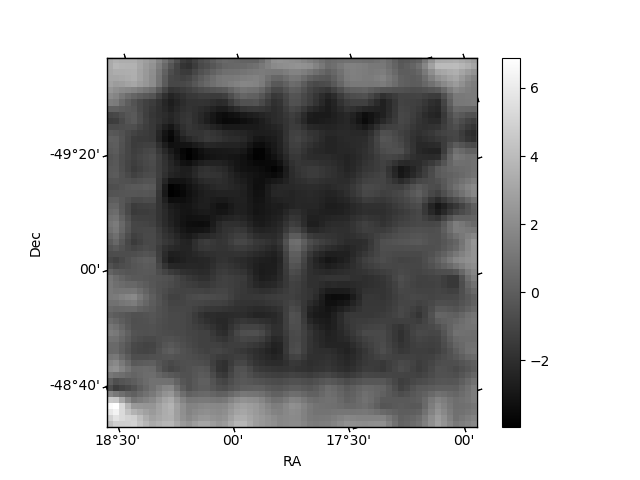
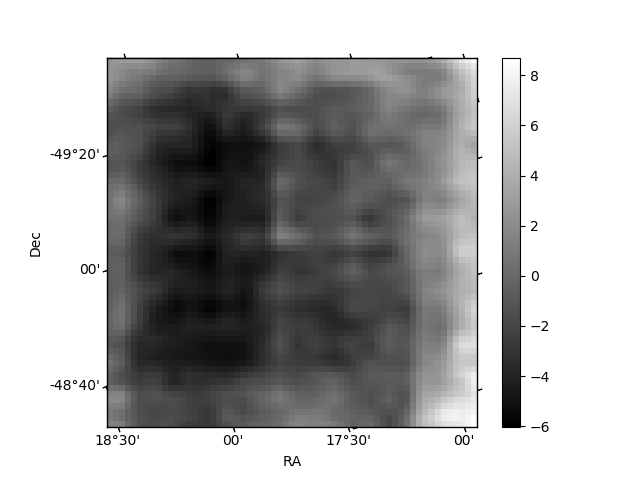
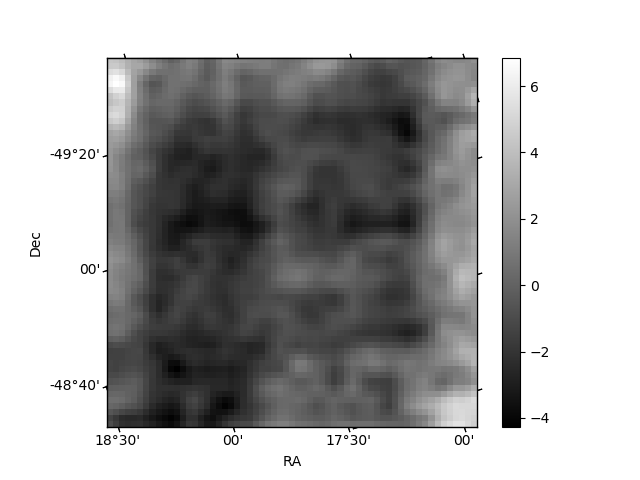
Histogram calculated using DETX and DETY for each event in the final _common_clean file
| Quadrant A | 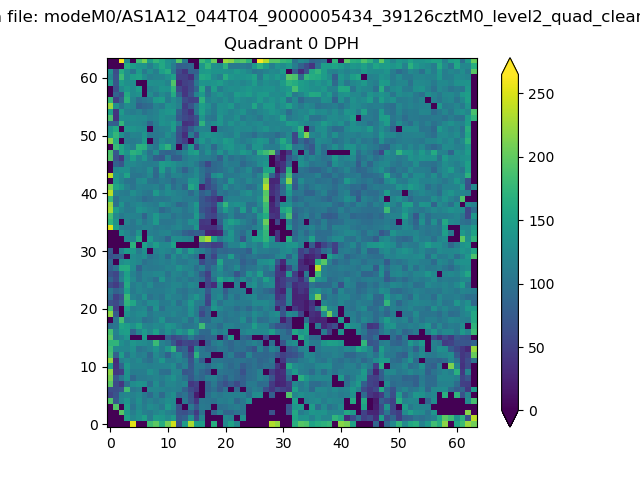 |
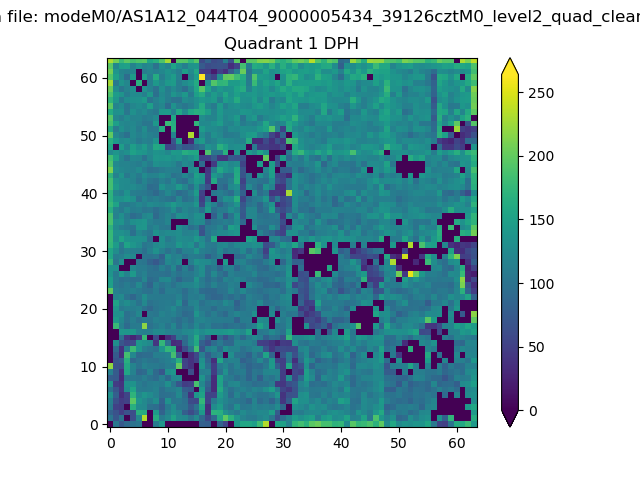 |
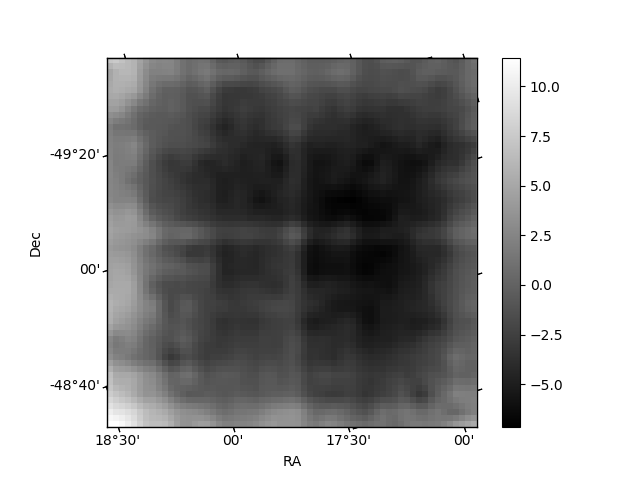
Quadrant B |
|---|---|---|---|
| Quadrant D | 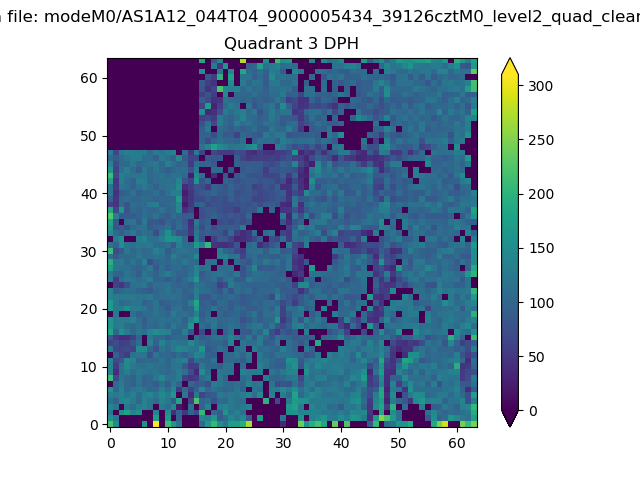 |
 |
Quadrant C |
| Plot type | Count rate plots | Images |
|---|---|---|
| Comparison with Poisson distribution Blue bars denote a histogram of data divided into 1 sec bins. Red curve is a Poisson curve with rate = median count rate of data. |
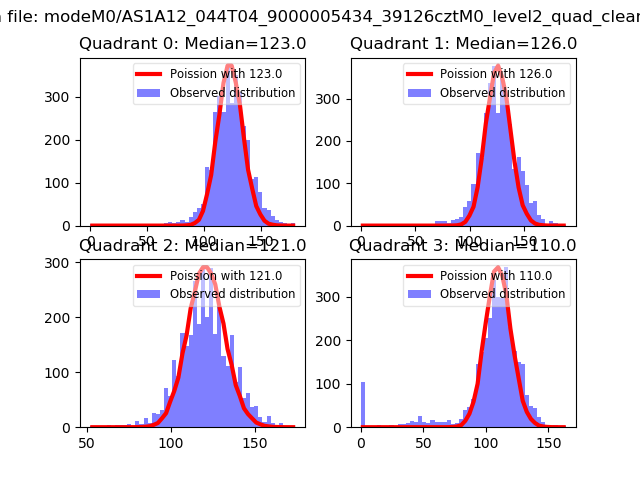 |
 |
| Quadrant-wise count rates Data is divided into 100 sec bins |
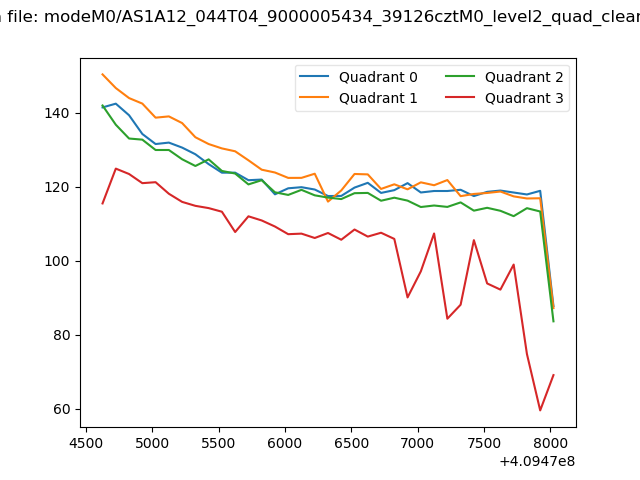 |
|
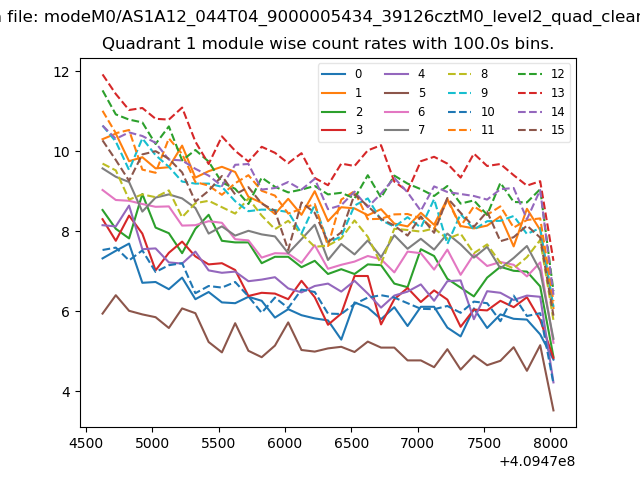
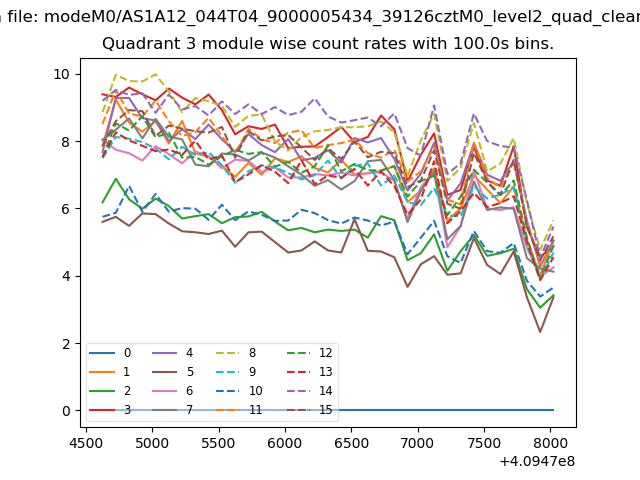
| Module-wise count rates for Quadrant A Data is divided into 100 sec bins |
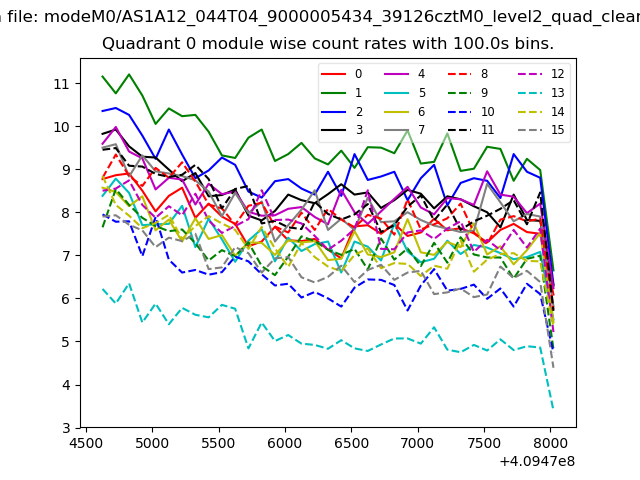 |
 |
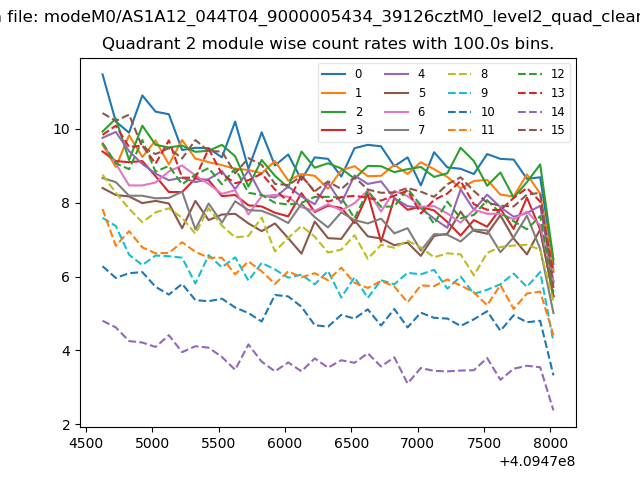
| Module-wise count rates for Quadrant B Data is divided into 100 sec bins |
 |
 |
| Module-wise count rates for Quadrant C Data is divided into 100 sec bins |
 |
 |
| Module-wise count rates for Quadrant D Data is divided into 100 sec bins |
 |
 |
| Parameter | Plot |
|---|---|
| CZT HV Monitor | 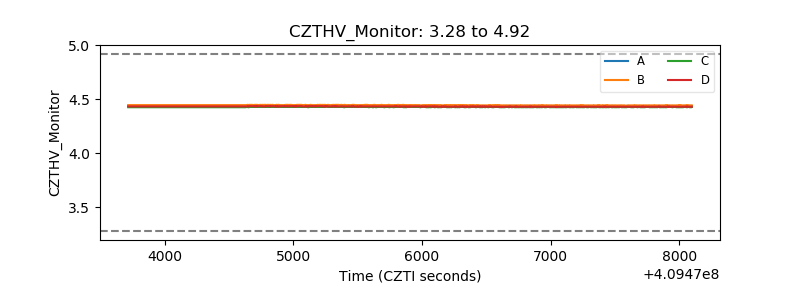 |
| D_VDD | 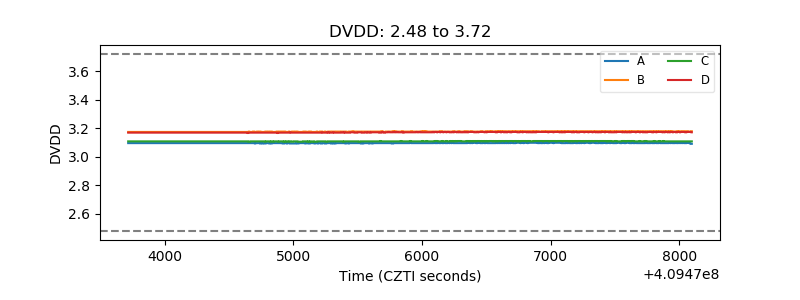 |
| Temperature 1 | 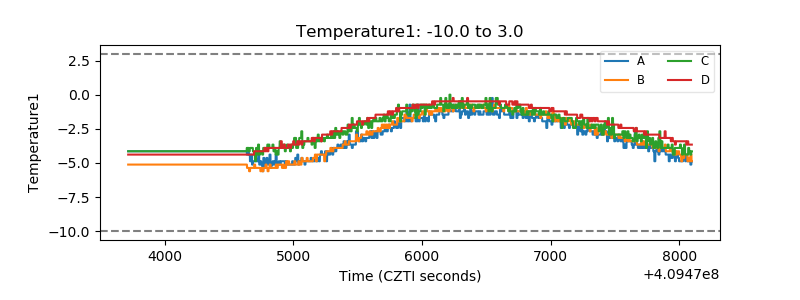 |
| Veto HV Monitor | 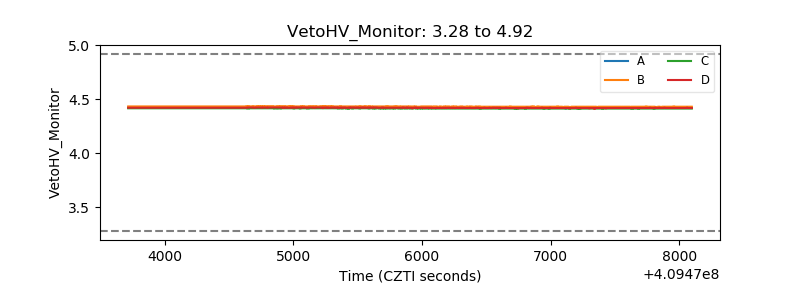 |
| Veto LLD | 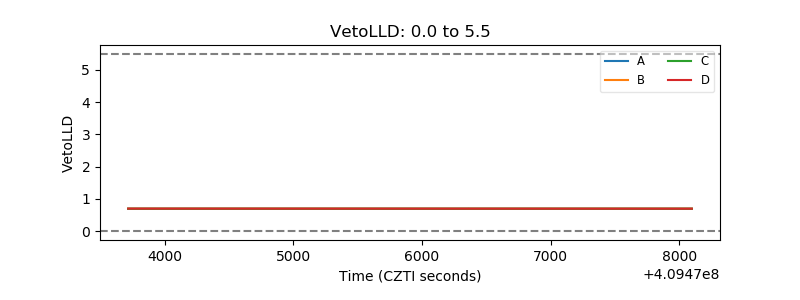 |
| Alpha Counter | 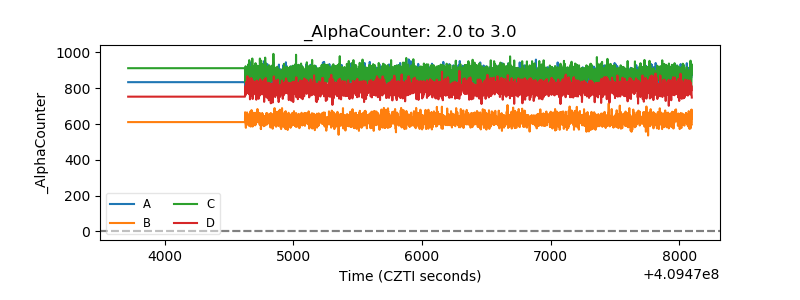 |
| _CPM_Rate | 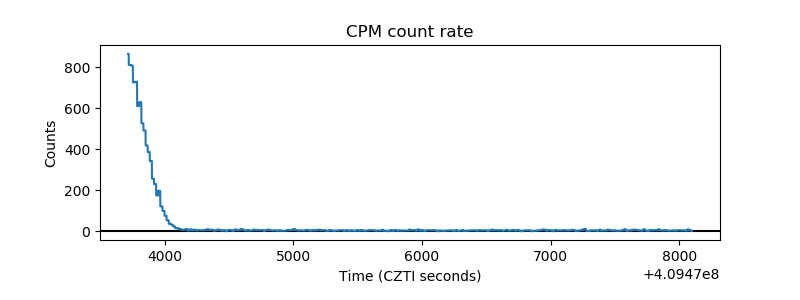 |
| CZT Counter | 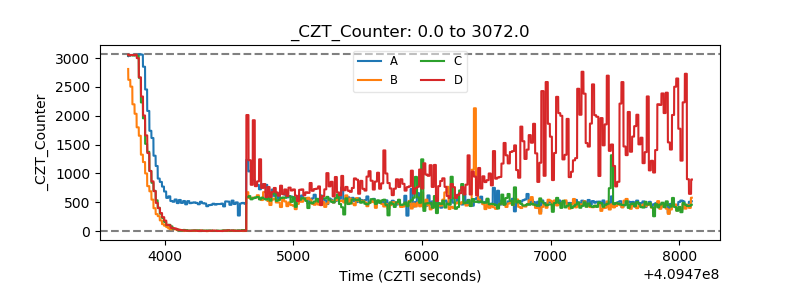 |
| +2.5 Volts monitor | 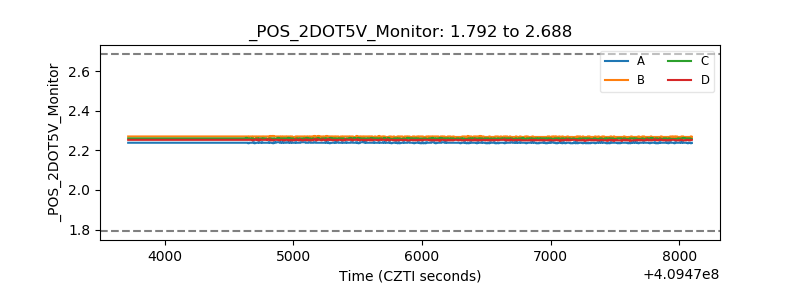 |
| +5 Volts monitor | 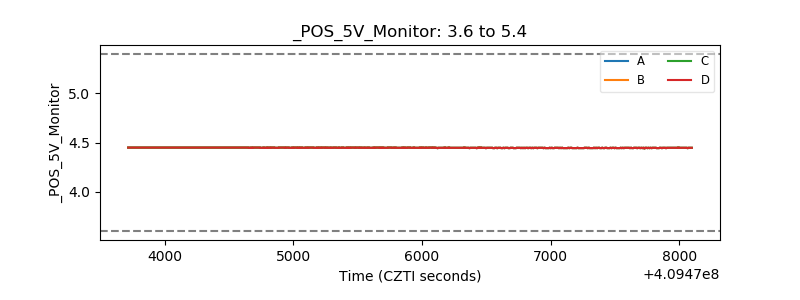 |
| _ROLL_ROT | 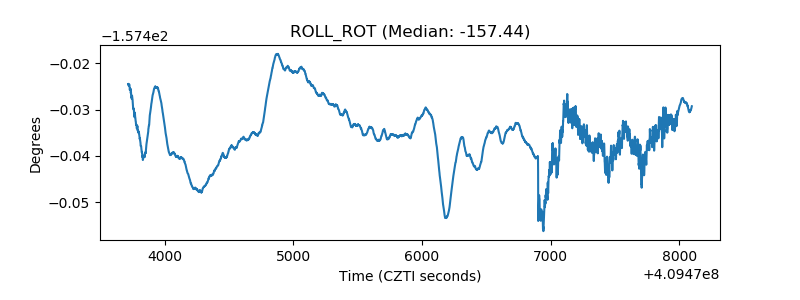 |
| _Roll_DEC | 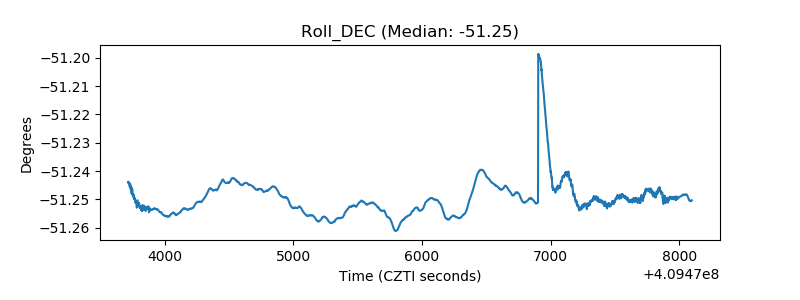 |
| _Roll_RA |  |
| Veto Counter |  |