| Param | Original file | Final file |
|---|---|---|
| Filename | modeM0/AS1A12_025T11_9000005438_39129cztM0_level2.fits | modeM0/AS1A12_025T11_9000005438_39129cztM0_level2_quad_clean.evt |
| Size (bytes) | 188,890,560 | 41,561,280 |
| Size | 180.1 MB | 39.6 MB |
| Events in quadrant A | 1,411,107 | 292,307 |
| Events in quadrant B | 1,188,068 | 294,765 |
| Events in quadrant C | 1,351,147 | 277,949 |
| Events in quadrant D | 2,858,827 | 225,782 |
| Mode M9 | |||
|---|---|---|---|
| Quadrant | BADHDUFLAG | Total packets | Discarded packets |
| A | 0 | 21 | 0 |
| B | 0 | 21 | 0 |
| C | 0 | 21 | 0 |
| D | 0 | 21 | 0 |
| Mode M0 | |||
|---|---|---|---|
| Quadrant | BADHDUFLAG | Total packets | Discarded packets |
| A | 0 | 5810 | 2 |
| B | 0 | 4964 | 1 |
| C | 0 | 5348 | 1 |
| D | 0 | 10157 | 1 |
| Mode SS | |||
|---|---|---|---|
| Quadrant | BADHDUFLAG | Total packets | Discarded packets |
| A | 0 | 50 | 0 |
| B | 0 | 50 | 0 |
| C | 0 | 50 | 0 |
| D | 0 | 50 | 0 |
| Quadrant | Total seconds | Saturated seconds | Saturation percentage |
|---|---|---|---|
| A | 2326 | 13 | 0.558899% |
| B | 2326 | 20 | 0.859845% |
| C | 2326 | 35 | 1.504729% |
| D | 2326 | 400 | 17.196905% |
Noise dominated data is calculated using 1-second bins in cleaned event files. If a bin has >2000 counts, and if more than 50% of those come from <1% of pixels, then it is considered to be noise-dominated and hence unusable.
| Quadrant | # 1 sec bins | Bins with >0 counts | Bins with >2000 counts | High rate bins dominated by noise | Noise dominated (total time) | Noise dominated (detector-on time) | Marked lightcurve |
|---|---|---|---|---|---|---|---|
| A | 4450 | 2327 | 3 | 3 | 0.07% | 0.13% | 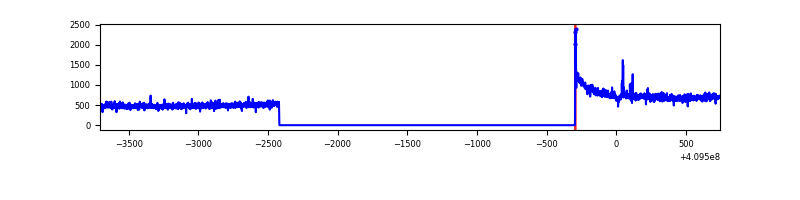 |
| B | 4450 | 2327 | 11 | 11 | 0.25% | 0.47% | 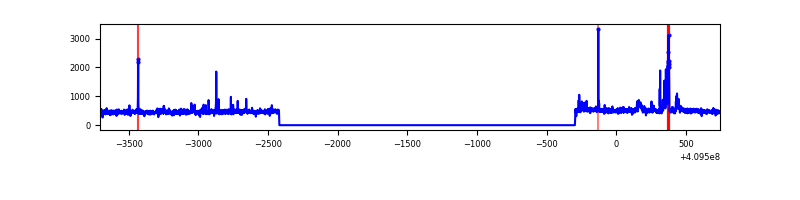 |
| C | 4450 | 2327 | 29 | 29 | 0.65% | 1.25% | 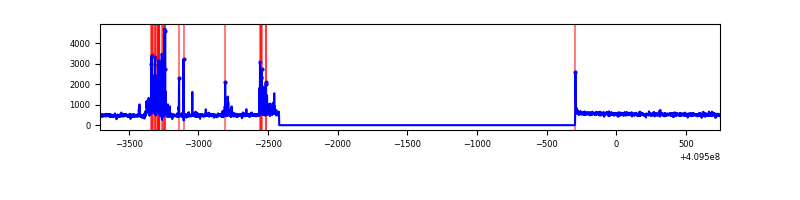 |
| D | 4450 | 2327 | 313 | 313 | 7.03% | 13.45% | 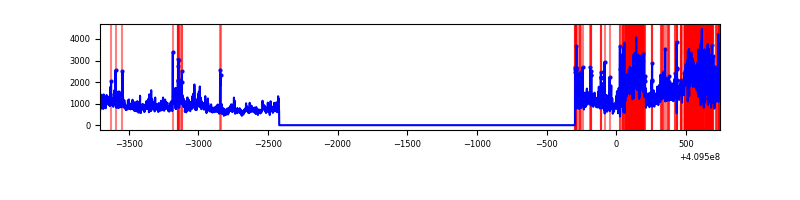 |
Top three noisy pixels from each quadrant. If the there are fewer than three noisy pixels in the level2.evt file, extra rows are filled as -1
| Pixel properties | Quadrant properties | ||||||
|---|---|---|---|---|---|---|---|
| Quadrant | DetID | PixID | Counts | Sigma | Mean | Median | Sigma |
| A | 10 | 83 | 201022 | 3488.7 | 279 | 273 | 57.5 |
| A | 15 | 223 | 122146 | 2117.96 | 279 | 273 | 57.5 |
| A | 13 | 248 | 7960 | 133.59 | 279 | 273 | 57.5 |
| B | 5 | 172 | 66668 | 1210.08 | 277 | 269 | 54.9 |
| B | 0 | 190 | 18998 | 341.32 | 277 | 269 | 54.9 |
| B | 15 | 32 | 7782 | 136.92 | 277 | 269 | 54.9 |
| C | 9 | 187 | 190110 | 2995.2 | 270 | 272 | 63.4 |
| C | 15 | 214 | 98336 | 1547.22 | 270 | 272 | 63.4 |
| C | 0 | 10 | 7404 | 112.53 | 270 | 272 | 63.4 |
| D | 12 | 235 | 1170951 | 18217.36 | 255 | 249 | 64.3 |
| D | 5 | 222 | 517344 | 8046.55 | 255 | 249 | 64.3 |
| D | 2 | 249 | 93640 | 1453.26 | 255 | 249 | 64.3 |
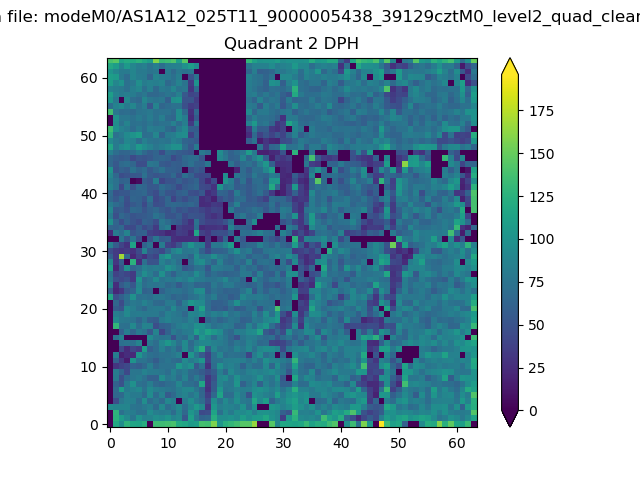
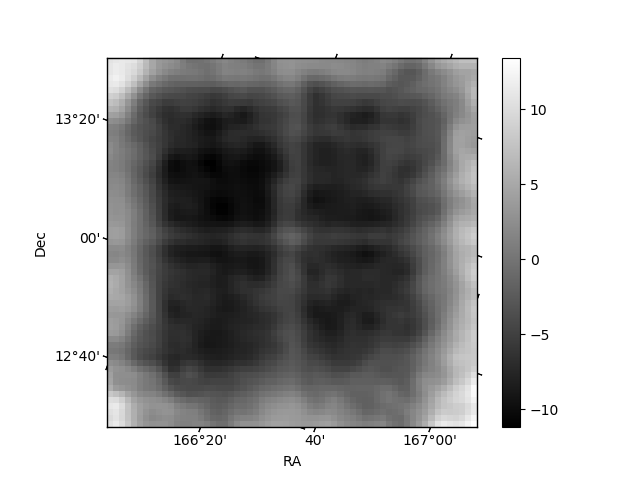
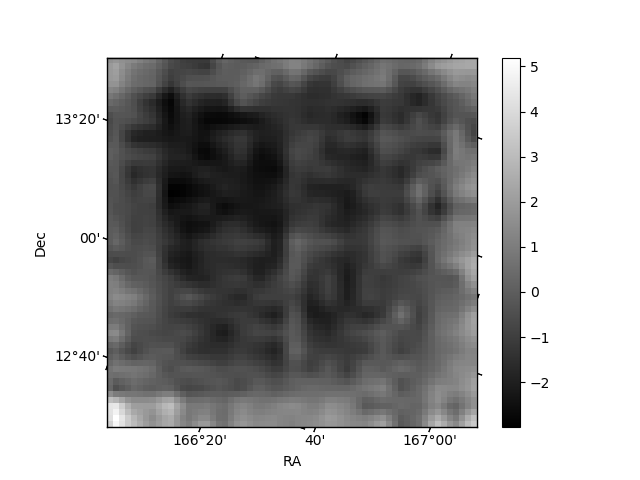
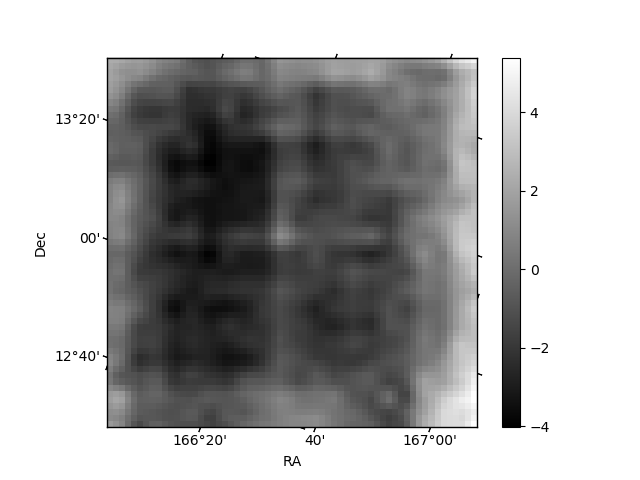
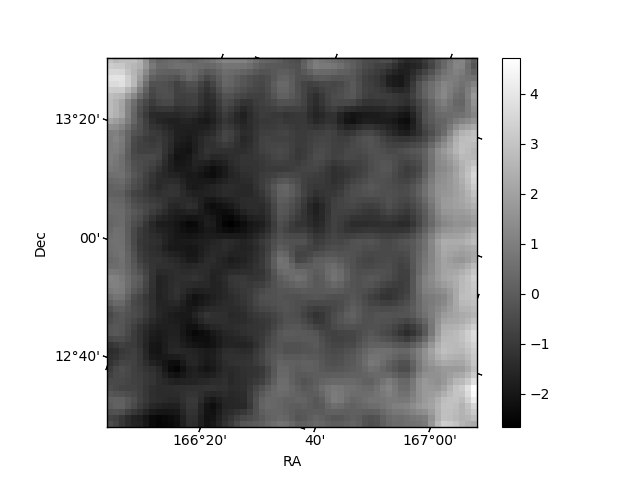
Histogram calculated using DETX and DETY for each event in the final _common_clean file
| Quadrant A | 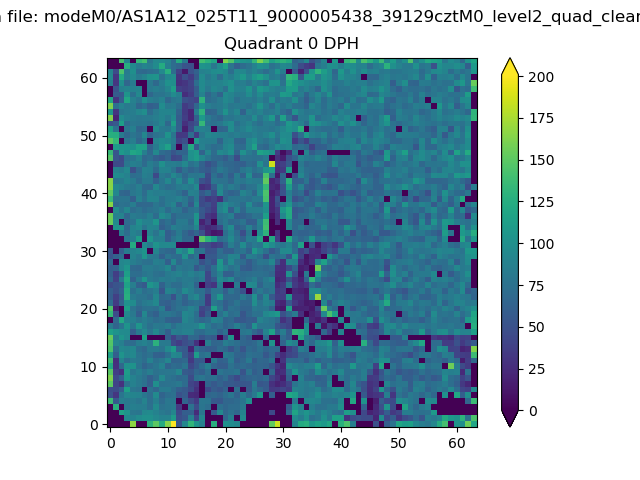 |
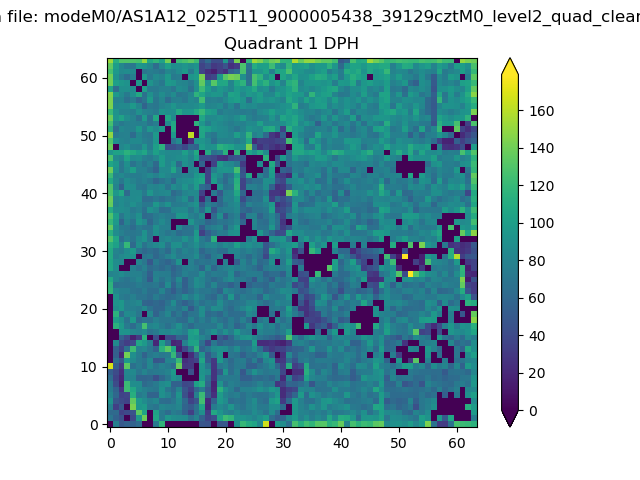 |
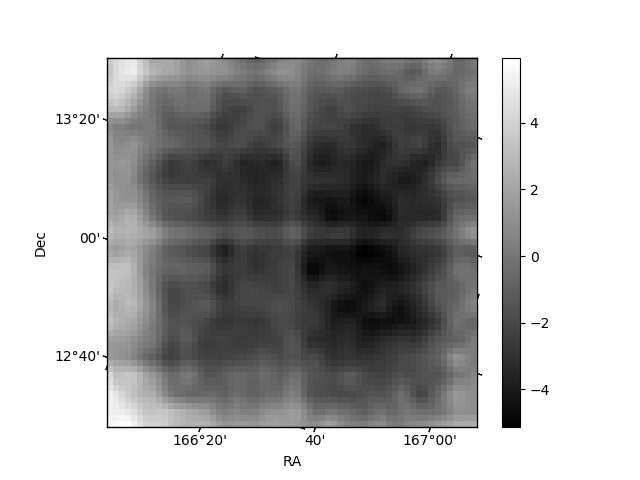
Quadrant B |
|---|---|---|---|
| Quadrant D | 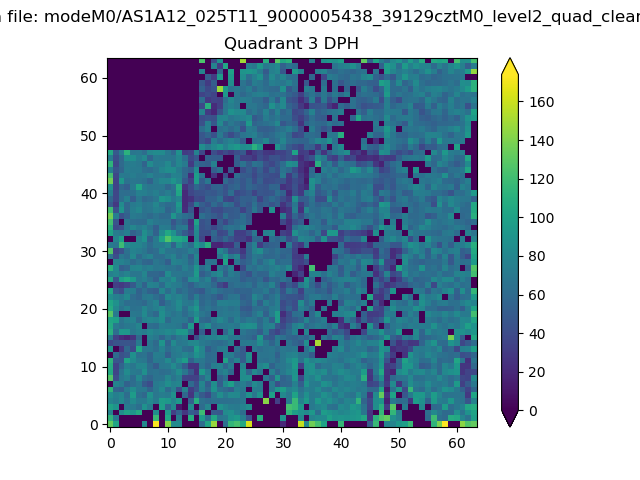 |
 |
Quadrant C |
| Plot type | Count rate plots | Images |
|---|---|---|
| Comparison with Poisson distribution Blue bars denote a histogram of data divided into 1 sec bins. Red curve is a Poisson curve with rate = median count rate of data. |
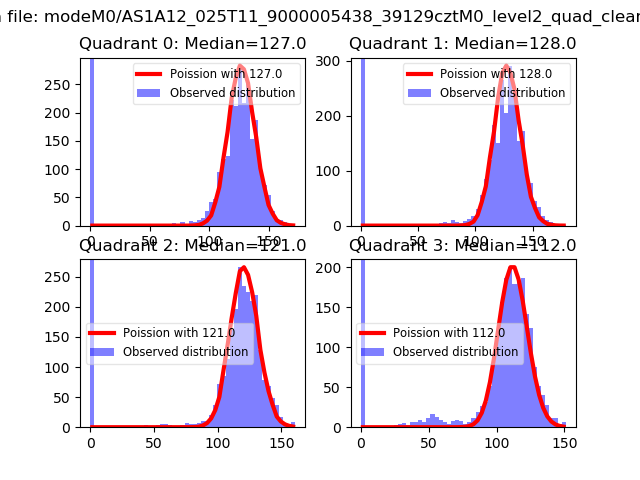 |
 |
| Quadrant-wise count rates Data is divided into 100 sec bins |
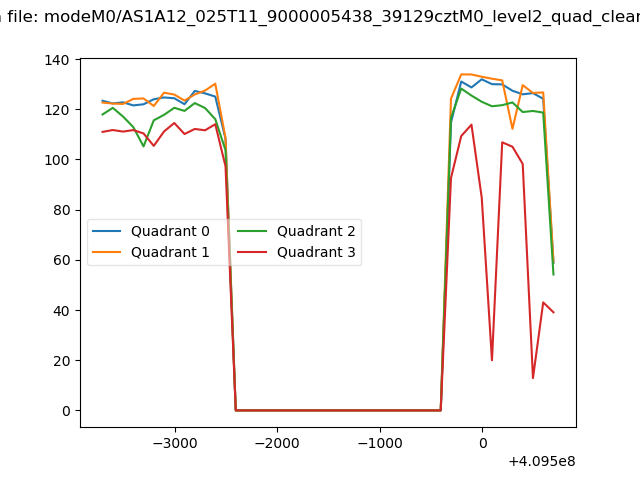 |
|
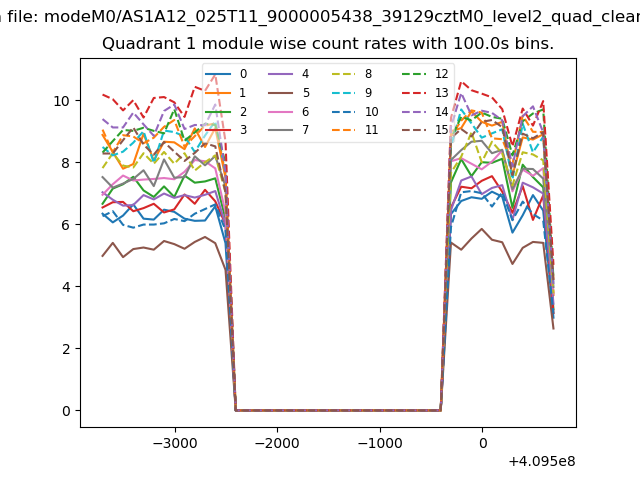
| Module-wise count rates for Quadrant A Data is divided into 100 sec bins |
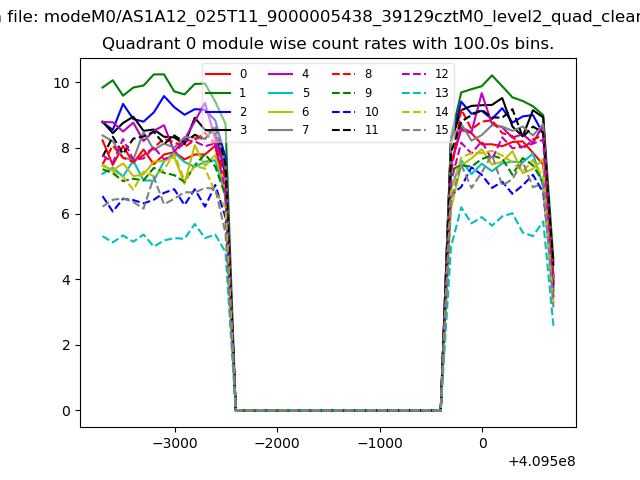 |
 |
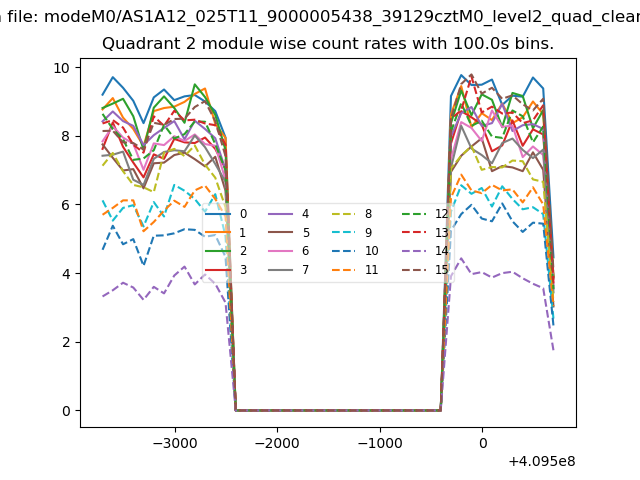
| Module-wise count rates for Quadrant B Data is divided into 100 sec bins |
 |
 |
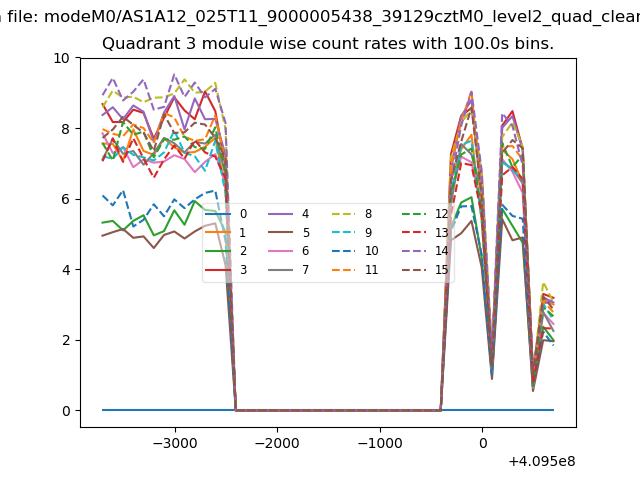
| Module-wise count rates for Quadrant C Data is divided into 100 sec bins |
 |
 |
| Module-wise count rates for Quadrant D Data is divided into 100 sec bins |
 |
 |
| Parameter | Plot |
|---|---|
| CZT HV Monitor | 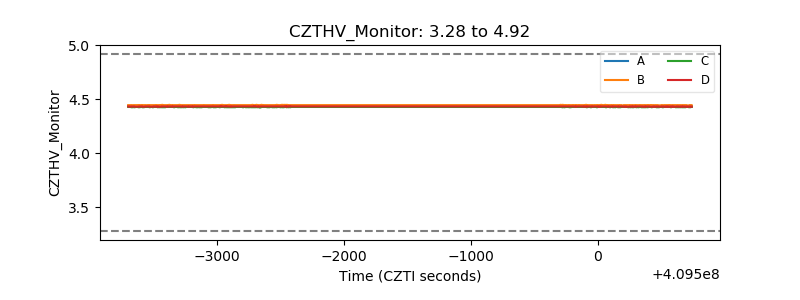 |
| D_VDD | 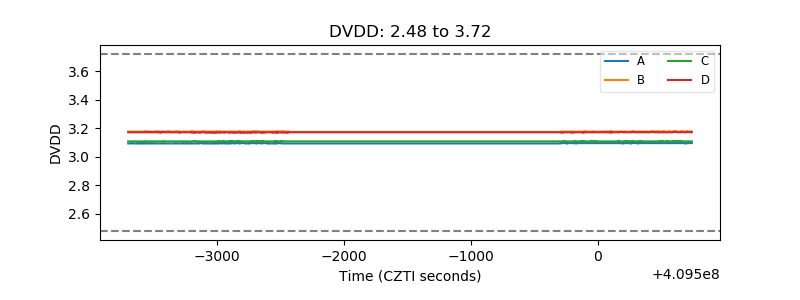 |
| Temperature 1 | 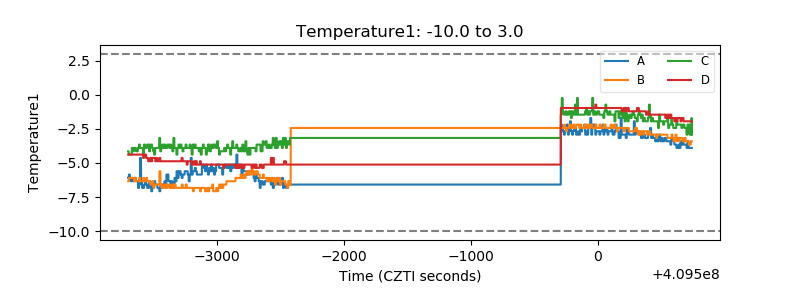 |
| Veto HV Monitor | 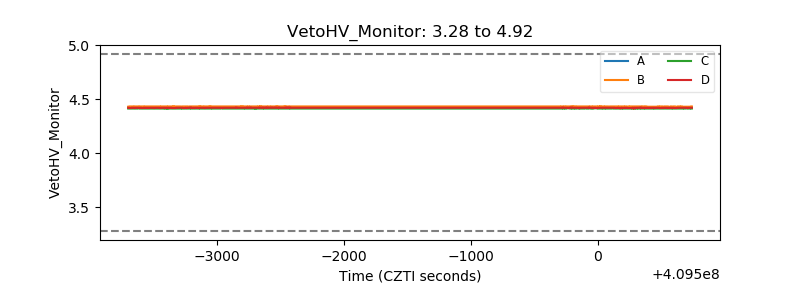 |
| Veto LLD | 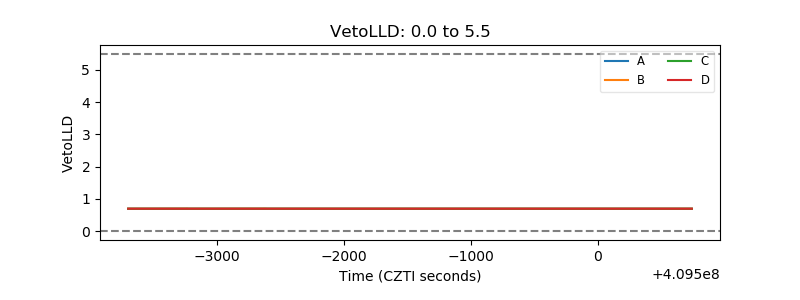 |
| Alpha Counter | 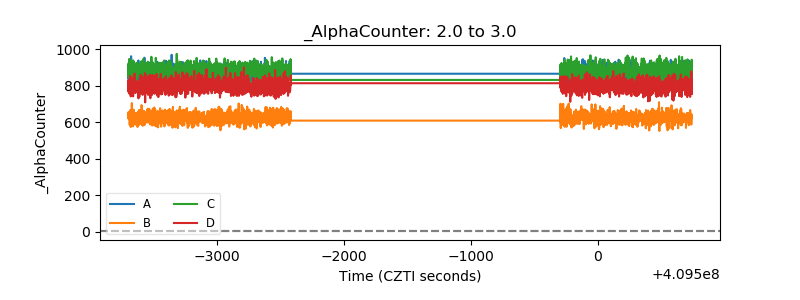 |
| _CPM_Rate | 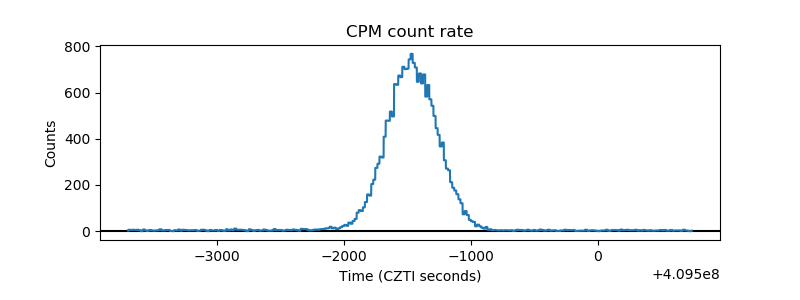 |
| CZT Counter | 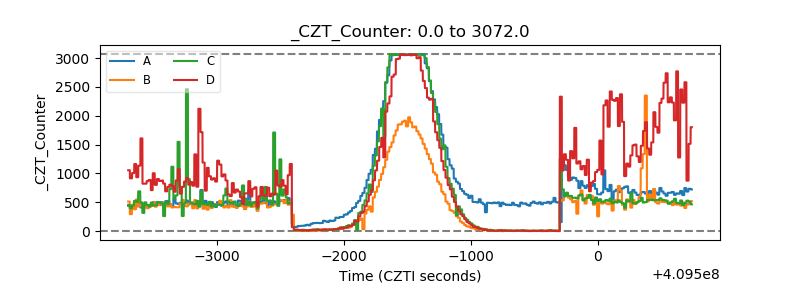 |
| +2.5 Volts monitor | 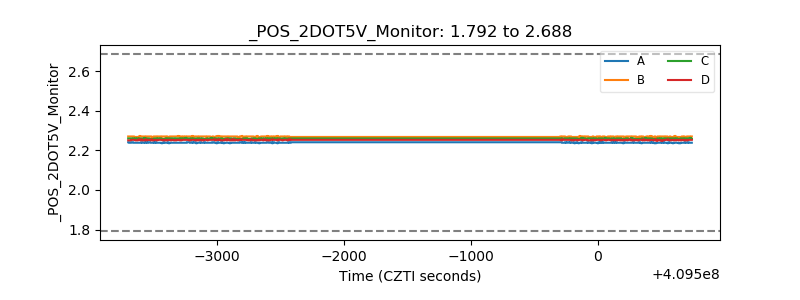 |
| +5 Volts monitor | 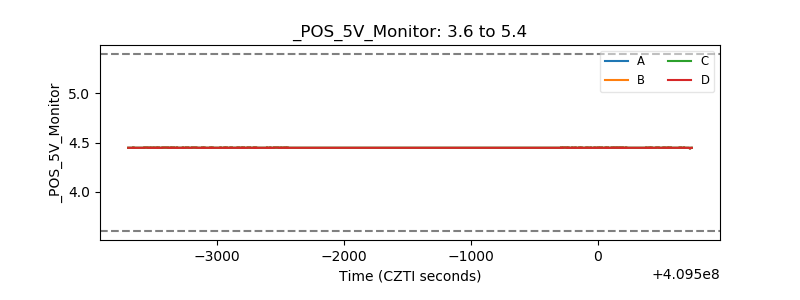 |
| _ROLL_ROT | 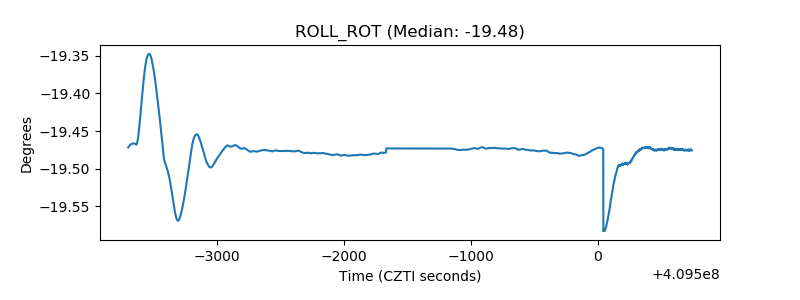 |
| _Roll_DEC | 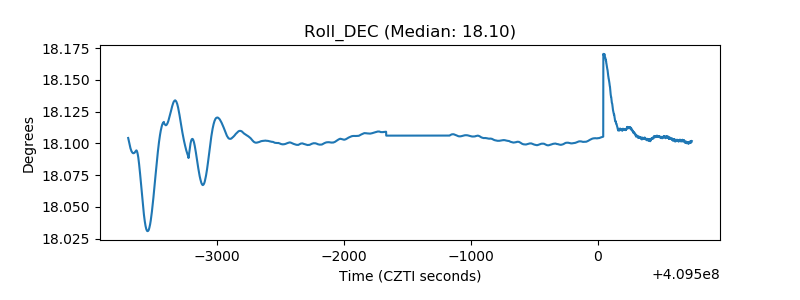 |
| _Roll_RA | 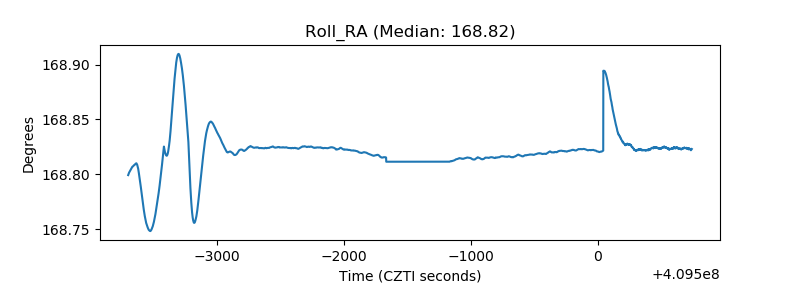 |
| Veto Counter | 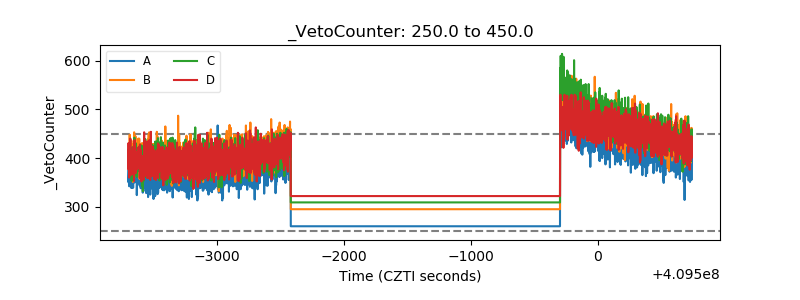 |