| Param | Original file | Final file |
|---|---|---|
| Filename | modeM0/AS1A12_025T11_9000005438_39130cztM0_level2.fits | modeM0/AS1A12_025T11_9000005438_39130cztM0_level2_quad_clean.evt |
| Size (bytes) | 404,913,600 | 88,390,080 |
| Size | 386.2 MB | 84.3 MB |
| Events in quadrant A | 3,354,577 | 616,115 |
| Events in quadrant B | 2,505,276 | 625,977 |
| Events in quadrant C | 2,818,929 | 591,545 |
| Events in quadrant D | 5,914,878 | 486,801 |
| Mode M9 | |||
|---|---|---|---|
| Quadrant | BADHDUFLAG | Total packets | Discarded packets |
| A | 0 | 28 | 0 |
| B | 0 | 28 | 0 |
| C | 0 | 28 | 0 |
| D | 0 | 29 | 0 |
| Mode M0 | |||
|---|---|---|---|
| Quadrant | BADHDUFLAG | Total packets | Discarded packets |
| A | 0 | 13524 | 3 |
| B | 0 | 10648 | 2 |
| C | 0 | 11391 | 2 |
| D | 0 | 21072 | 2 |
| Mode SS | |||
|---|---|---|---|
| Quadrant | BADHDUFLAG | Total packets | Discarded packets |
| A | 0 | 104 | 0 |
| B | 0 | 104 | 0 |
| C | 0 | 104 | 0 |
| D | 0 | 104 | 0 |
| Quadrant | Total seconds | Saturated seconds | Saturation percentage |
|---|---|---|---|
| A | 5082 | 72 | 1.416765% |
| B | 5082 | 22 | 0.432900% |
| C | 5082 | 46 | 0.905155% |
| D | 5082 | 795 | 15.643447% |
Noise dominated data is calculated using 1-second bins in cleaned event files. If a bin has >2000 counts, and if more than 50% of those come from <1% of pixels, then it is considered to be noise-dominated and hence unusable.
| Quadrant | # 1 sec bins | Bins with >0 counts | Bins with >2000 counts | High rate bins dominated by noise | Noise dominated (total time) | Noise dominated (detector-on time) | Marked lightcurve |
|---|---|---|---|---|---|---|---|
| A | 7144 | 5083 | 34 | 34 | 0.48% | 0.67% | 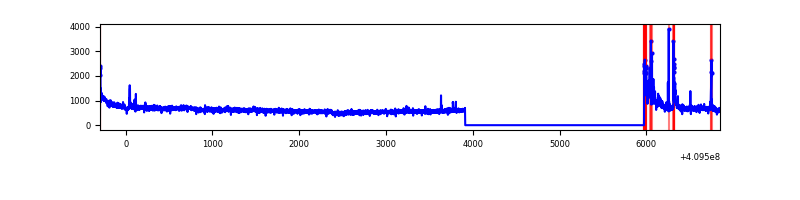 |
| B | 7144 | 5083 | 10 | 10 | 0.14% | 0.20% | 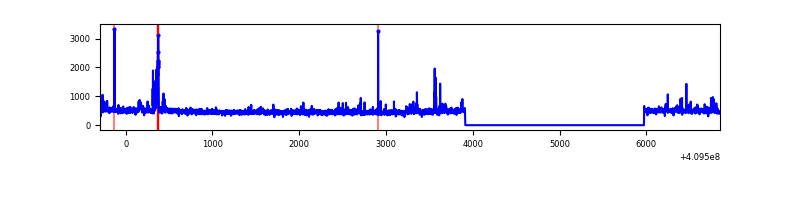 |
| C | 7144 | 5083 | 35 | 35 | 0.49% | 0.69% | 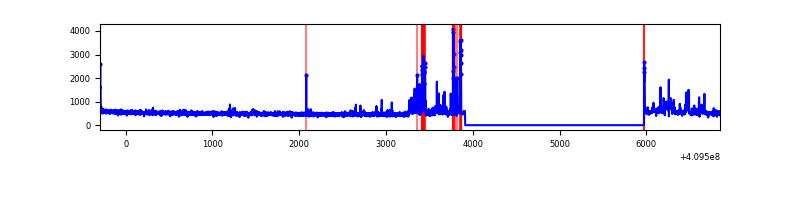 |
| D | 7144 | 5083 | 655 | 655 | 9.17% | 12.89% | 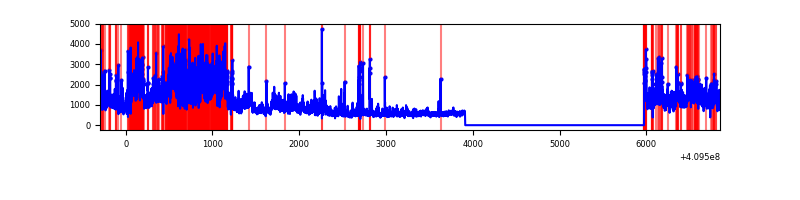 |
Top three noisy pixels from each quadrant. If the there are fewer than three noisy pixels in the level2.evt file, extra rows are filled as -1
| Pixel properties | Quadrant properties | ||||||
|---|---|---|---|---|---|---|---|
| Quadrant | DetID | PixID | Counts | Sigma | Mean | Median | Sigma |
| A | 15 | 223 | 463155 | 3828.85 | 595 | 584 | 120.8 |
| A | 10 | 83 | 422967 | 3496.2 | 595 | 584 | 120.8 |
| A | 9 | 143 | 80024 | 657.55 | 595 | 584 | 120.8 |
| B | 5 | 172 | 78462 | 685.17 | 591 | 574 | 113.7 |
| B | 0 | 190 | 61756 | 538.21 | 591 | 574 | 113.7 |
| B | 0 | 230 | 14876 | 125.81 | 591 | 574 | 113.7 |
| C | 9 | 187 | 317272 | 2355.51 | 580 | 583 | 134.4 |
| C | 15 | 214 | 212924 | 1579.38 | 580 | 583 | 134.4 |
| C | 0 | 10 | 20654 | 149.29 | 580 | 583 | 134.4 |
| D | 12 | 235 | 2121181 | 15545.77 | 552 | 537 | 136.4 |
| D | 5 | 222 | 726014 | 5318.24 | 552 | 537 | 136.4 |
| D | 2 | 249 | 610324 | 4470.16 | 552 | 537 | 136.4 |
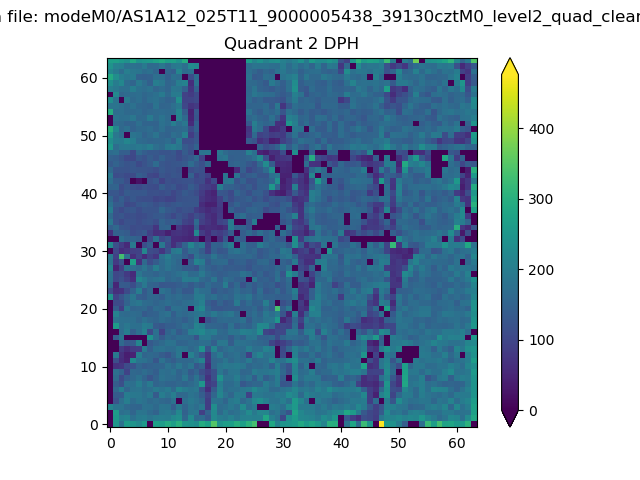
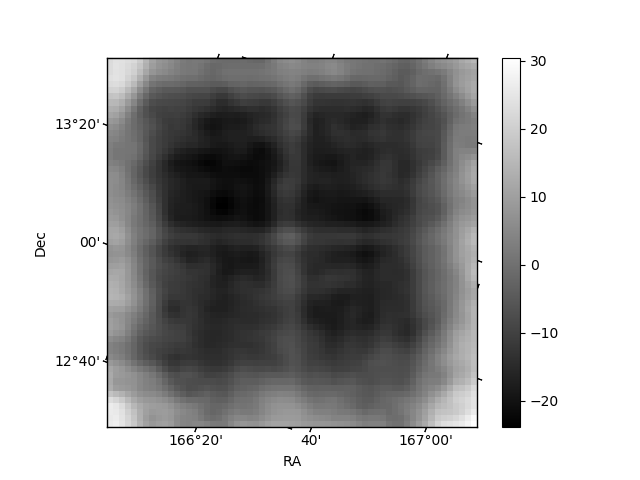
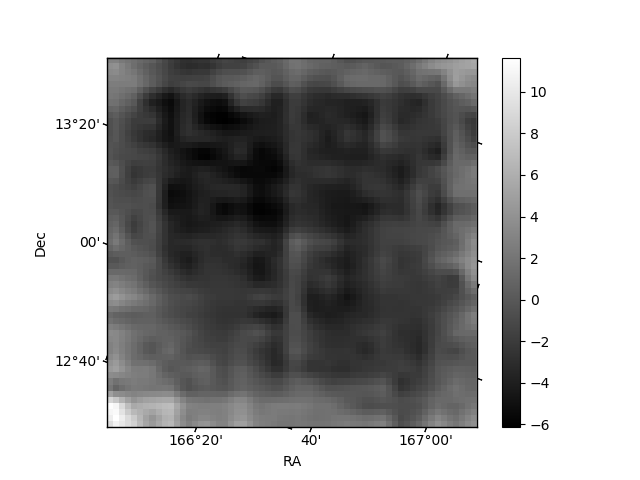
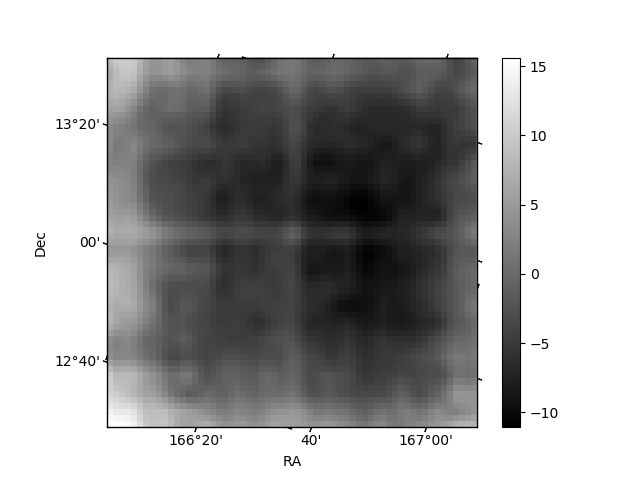
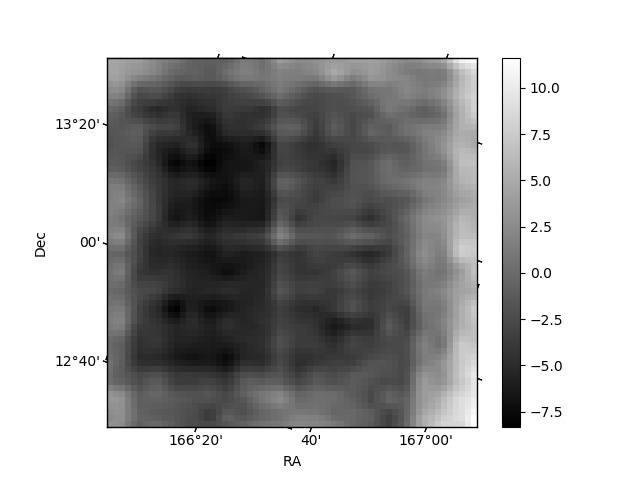
Histogram calculated using DETX and DETY for each event in the final _common_clean file
| Quadrant A | 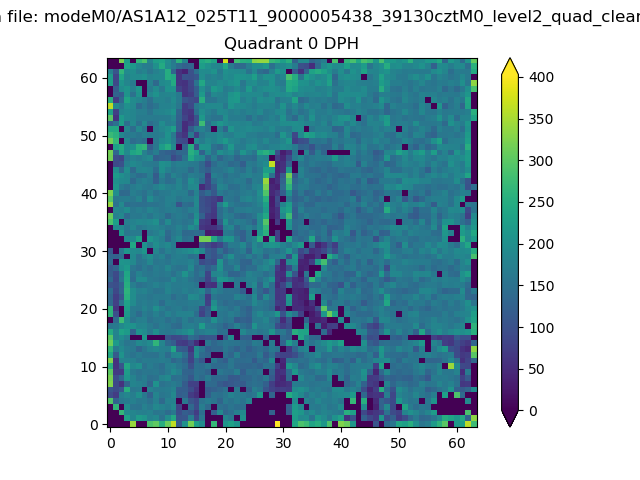 |
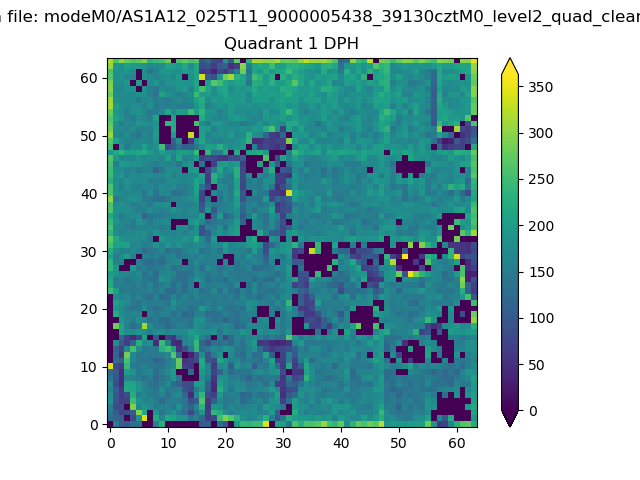 |
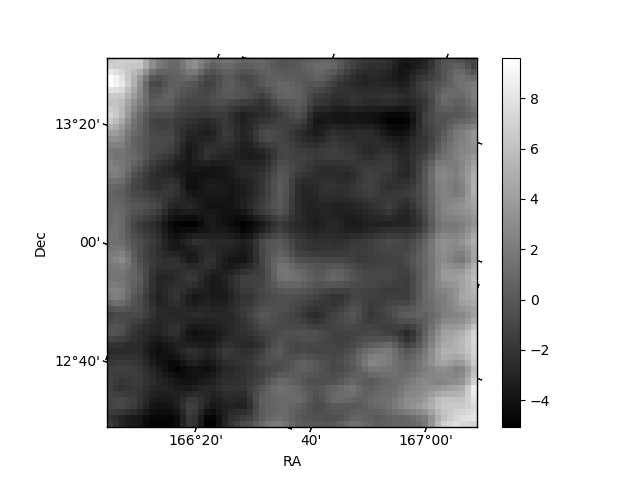
Quadrant B |
|---|---|---|---|
| Quadrant D | 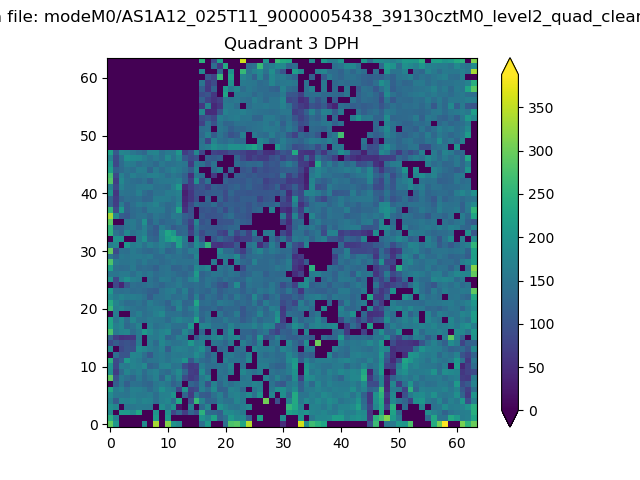 |
 |
Quadrant C |
| Plot type | Count rate plots | Images |
|---|---|---|
| Comparison with Poisson distribution Blue bars denote a histogram of data divided into 1 sec bins. Red curve is a Poisson curve with rate = median count rate of data. |
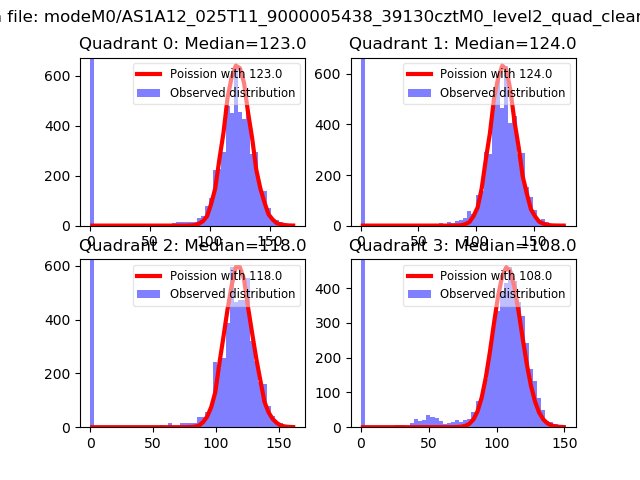 |
 |
| Quadrant-wise count rates Data is divided into 100 sec bins |
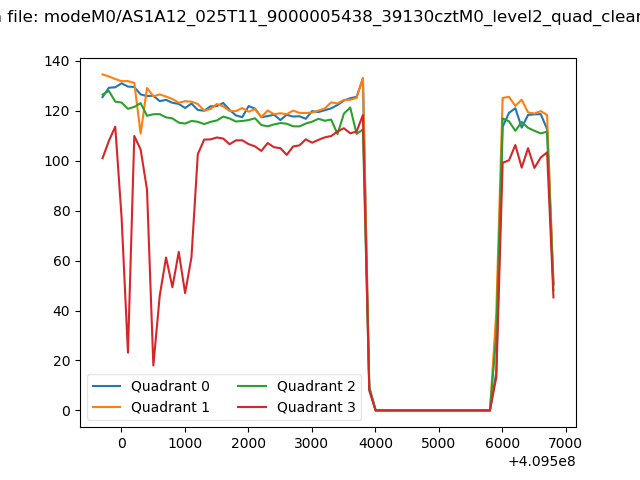 |
|
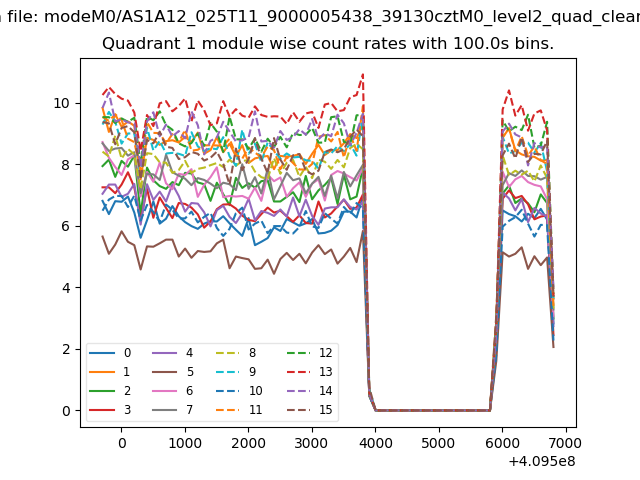
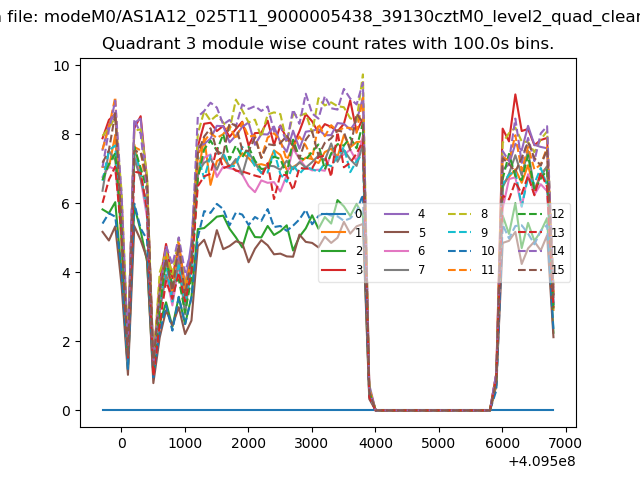
| Module-wise count rates for Quadrant A Data is divided into 100 sec bins |
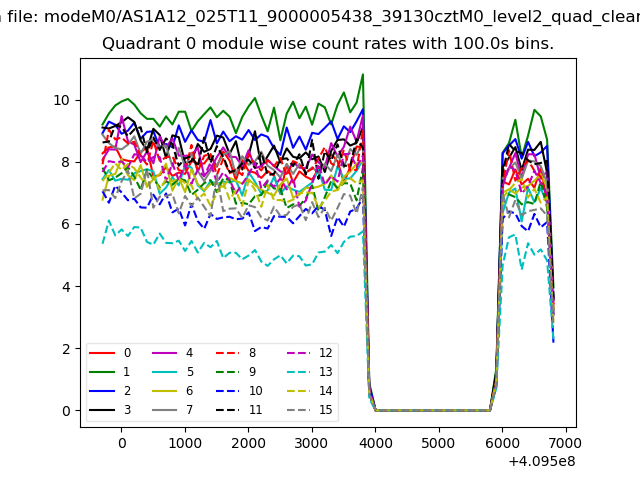 |
 |
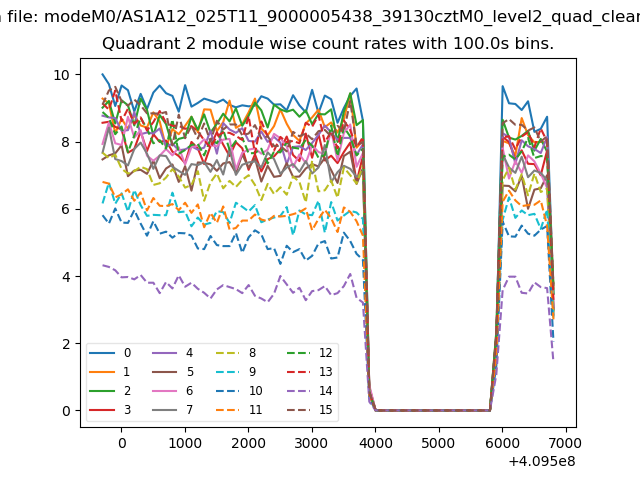
| Module-wise count rates for Quadrant B Data is divided into 100 sec bins |
 |
 |
| Module-wise count rates for Quadrant C Data is divided into 100 sec bins |
 |
 |
| Module-wise count rates for Quadrant D Data is divided into 100 sec bins |
 |
 |
| Parameter | Plot |
|---|---|
| CZT HV Monitor | 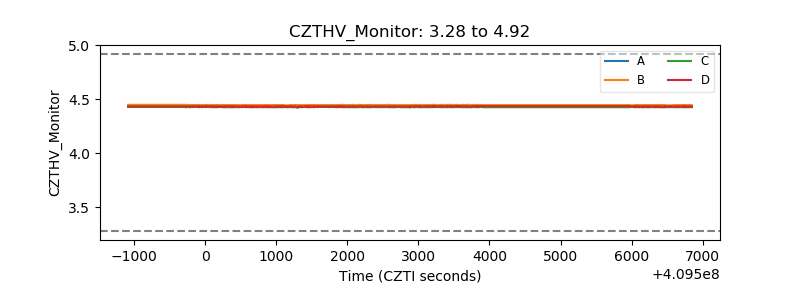 |
| D_VDD | 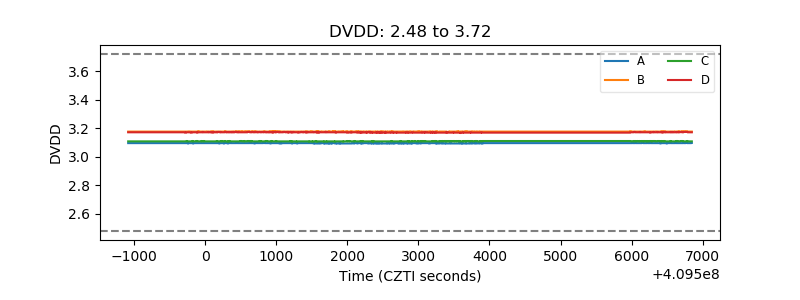 |
| Temperature 1 | 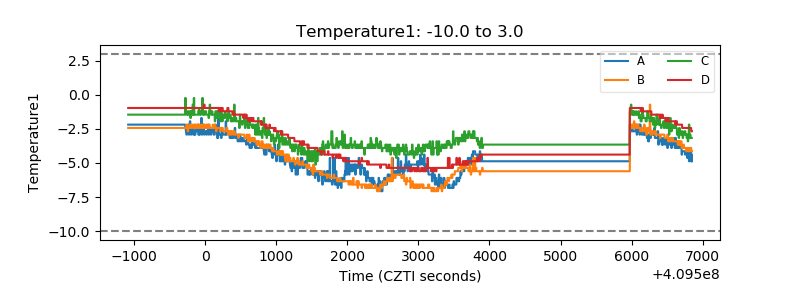 |
| Veto HV Monitor | 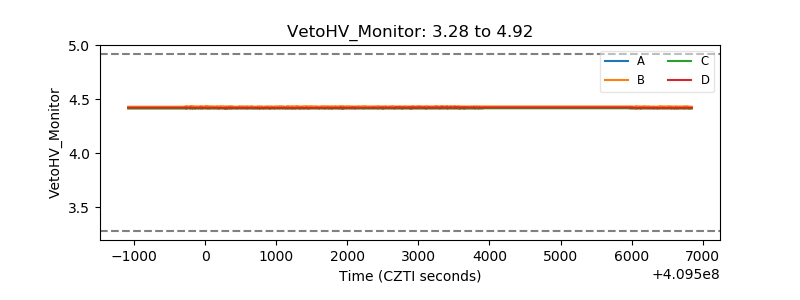 |
| Veto LLD | 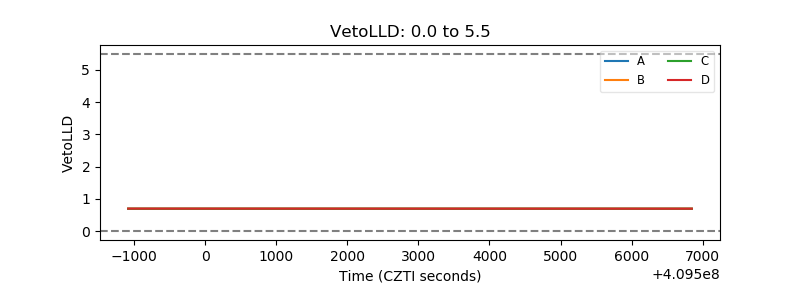 |
| Alpha Counter | 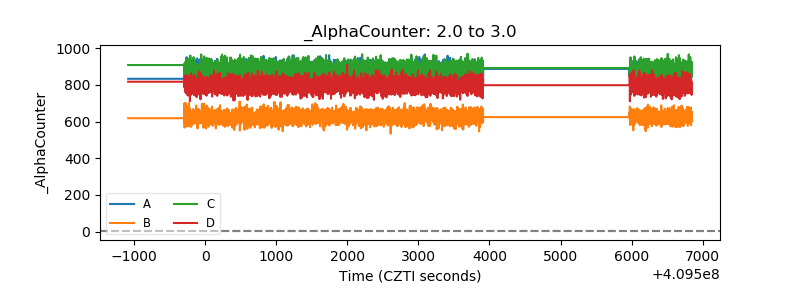 |
| _CPM_Rate | 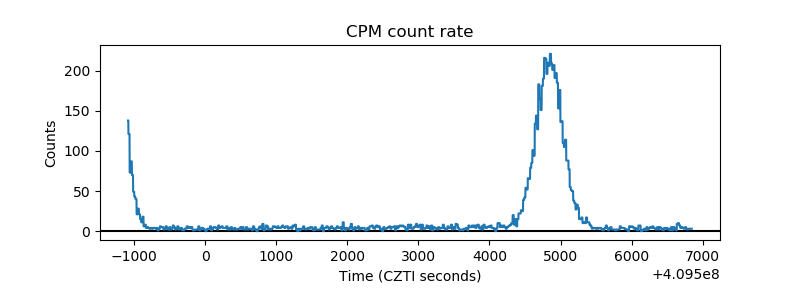 |
| CZT Counter | 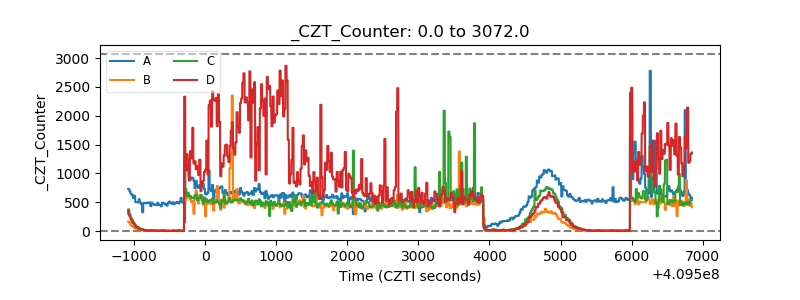 |
| +2.5 Volts monitor | 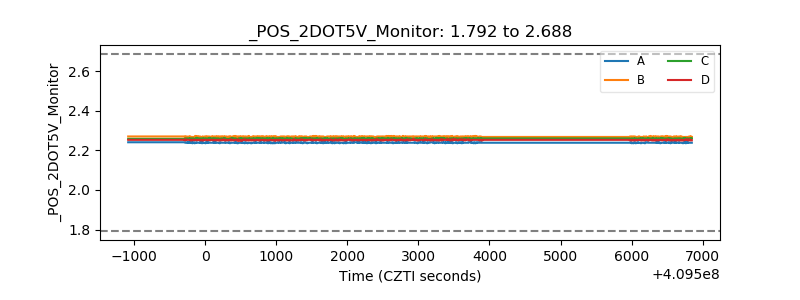 |
| +5 Volts monitor | 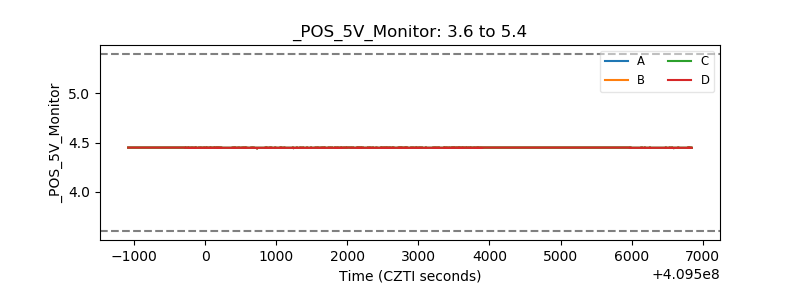 |
| _ROLL_ROT | 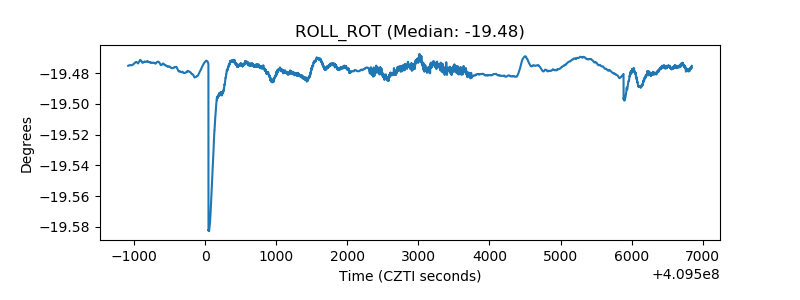 |
| _Roll_DEC | 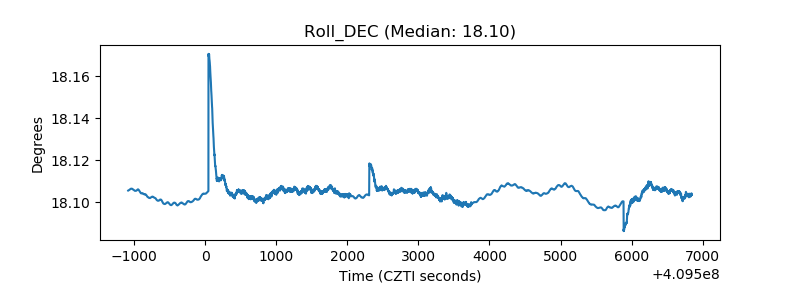 |
| _Roll_RA | 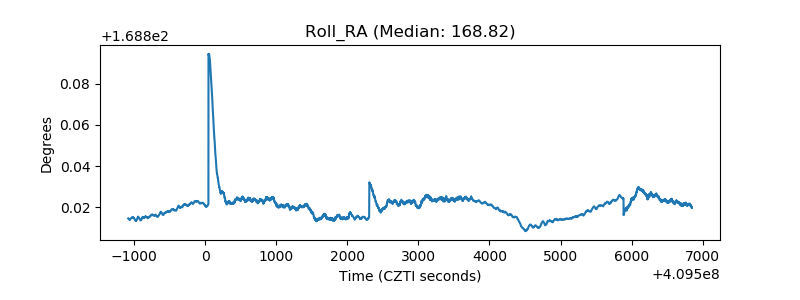 |
| Veto Counter | 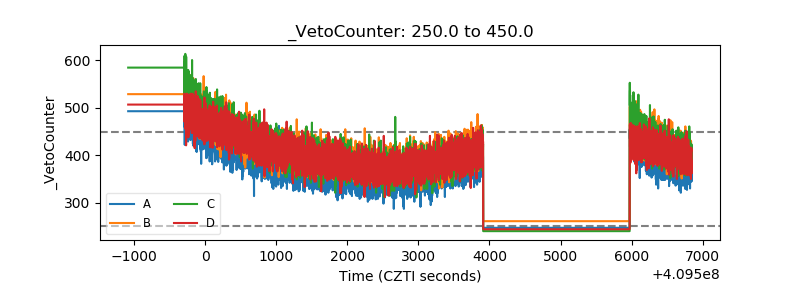 |