| Param | Original file | Final file |
|---|---|---|
| Filename | modeM0/AS1A12_025T11_9000005438_39131cztM0_level2.fits | modeM0/AS1A12_025T11_9000005438_39131cztM0_level2_quad_clean.evt |
| Size (bytes) | 387,676,800 | 88,110,720 |
| Size | 369.7 MB | 84.0 MB |
| Events in quadrant A | 3,624,557 | 592,666 |
| Events in quadrant B | 2,414,874 | 611,826 |
| Events in quadrant C | 2,819,383 | 579,347 |
| Events in quadrant D | 5,088,501 | 520,513 |
| Mode M9 | |||
|---|---|---|---|
| Quadrant | BADHDUFLAG | Total packets | Discarded packets |
| A | 0 | 28 | 0 |
| B | 0 | 28 | 0 |
| C | 0 | 28 | 0 |
| D | 0 | 29 | 0 |
| Mode M0 | |||
|---|---|---|---|
| Quadrant | BADHDUFLAG | Total packets | Discarded packets |
| A | 0 | 14458 | 3 |
| B | 0 | 10628 | 2 |
| C | 0 | 11536 | 2 |
| D | 0 | 18622 | 2 |
| Mode SS | |||
|---|---|---|---|
| Quadrant | BADHDUFLAG | Total packets | Discarded packets |
| A | 0 | 106 | 0 |
| B | 0 | 106 | 0 |
| C | 0 | 106 | 0 |
| D | 0 | 106 | 0 |
| Quadrant | Total seconds | Saturated seconds | Saturation percentage |
|---|---|---|---|
| A | 5189 | 122 | 2.351127% |
| B | 5189 | 8 | 0.154172% |
| C | 5189 | 35 | 0.674504% |
| D | 5189 | 339 | 6.533051% |
Noise dominated data is calculated using 1-second bins in cleaned event files. If a bin has >2000 counts, and if more than 50% of those come from <1% of pixels, then it is considered to be noise-dominated and hence unusable.
| Quadrant | # 1 sec bins | Bins with >0 counts | Bins with >2000 counts | High rate bins dominated by noise | Noise dominated (total time) | Noise dominated (detector-on time) | Marked lightcurve |
|---|---|---|---|---|---|---|---|
| A | 7041 | 5190 | 78 | 78 | 1.11% | 1.50% | 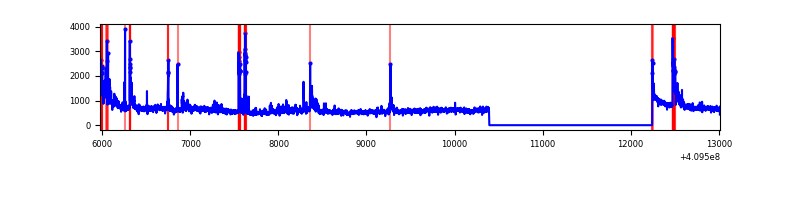 |
| B | 7041 | 5190 | 3 | 3 | 0.04% | 0.06% | 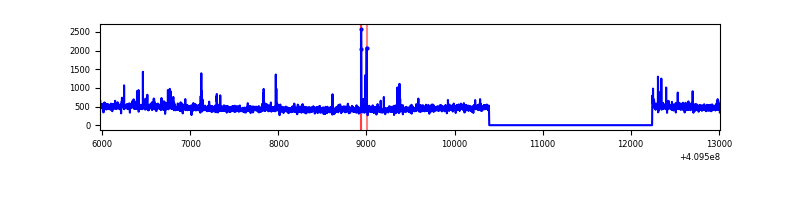 |
| C | 7041 | 5190 | 17 | 17 | 0.24% | 0.33% | 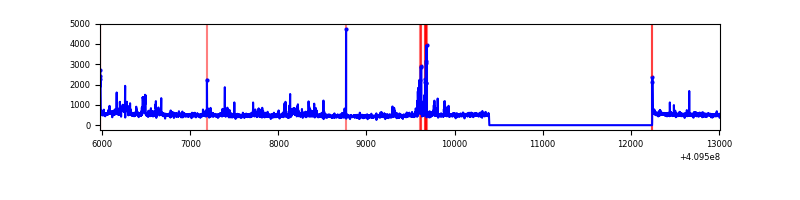 |
| D | 7041 | 5190 | 254 | 254 | 3.61% | 4.89% | 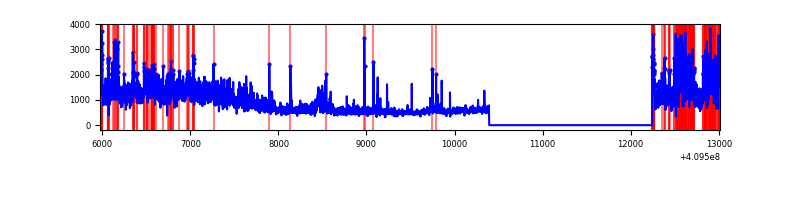 |
Top three noisy pixels from each quadrant. If the there are fewer than three noisy pixels in the level2.evt file, extra rows are filled as -1
| Pixel properties | Quadrant properties | ||||||
|---|---|---|---|---|---|---|---|
| Quadrant | DetID | PixID | Counts | Sigma | Mean | Median | Sigma |
| A | 15 | 223 | 474678 | 4028.06 | 584 | 573 | 117.7 |
| A | 10 | 83 | 424062 | 3598.02 | 584 | 573 | 117.7 |
| A | 14 | 235 | 278070 | 2357.65 | 584 | 573 | 117.7 |
| B | 0 | 190 | 40189 | 348.17 | 585 | 569 | 113.8 |
| B | 5 | 172 | 32622 | 281.67 | 585 | 569 | 113.8 |
| B | 5 | 184 | 18718 | 159.49 | 585 | 569 | 113.8 |
| C | 9 | 187 | 328911 | 2427.16 | 573 | 577 | 135.3 |
| C | 15 | 214 | 216784 | 1598.28 | 573 | 577 | 135.3 |
| C | 0 | 10 | 23246 | 167.58 | 573 | 577 | 135.3 |
| D | 12 | 235 | 2310151 | 16641.67 | 562 | 547 | 138.8 |
| D | 5 | 222 | 228297 | 1641.03 | 562 | 547 | 138.8 |
| D | 12 | 33 | 138135 | 991.38 | 562 | 547 | 138.8 |
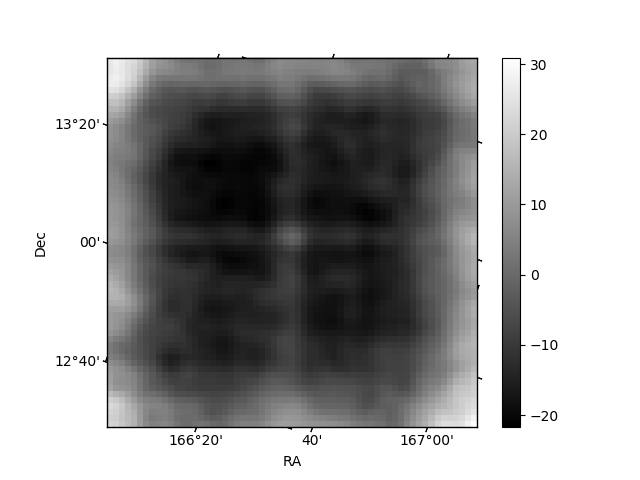
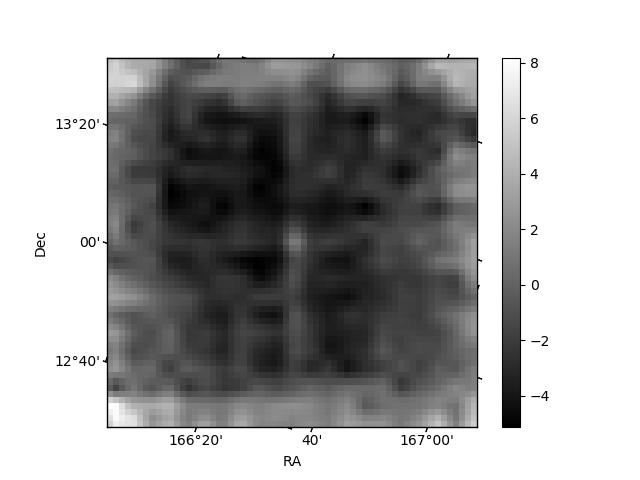
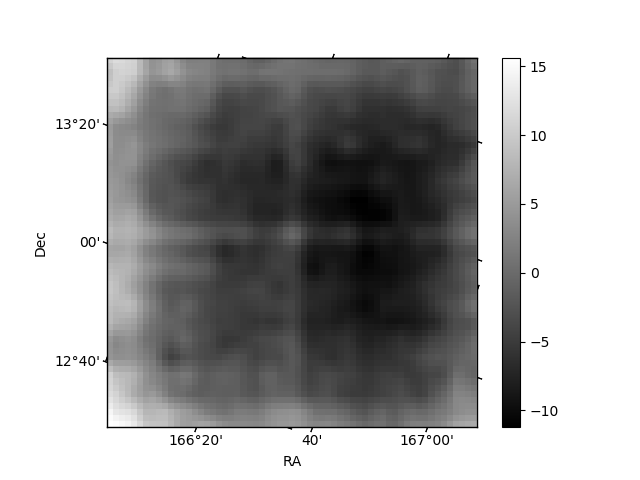
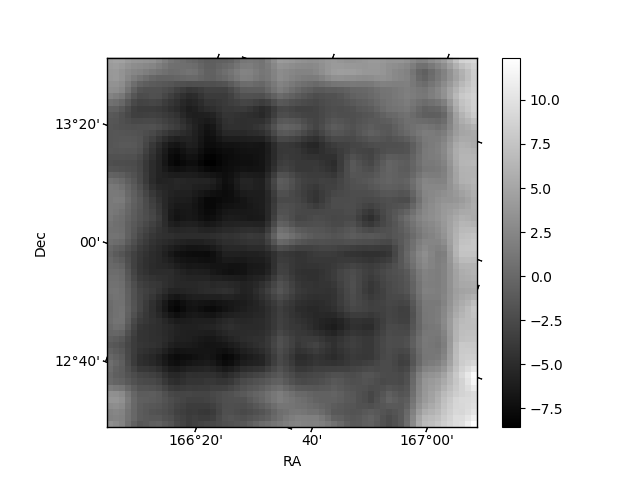
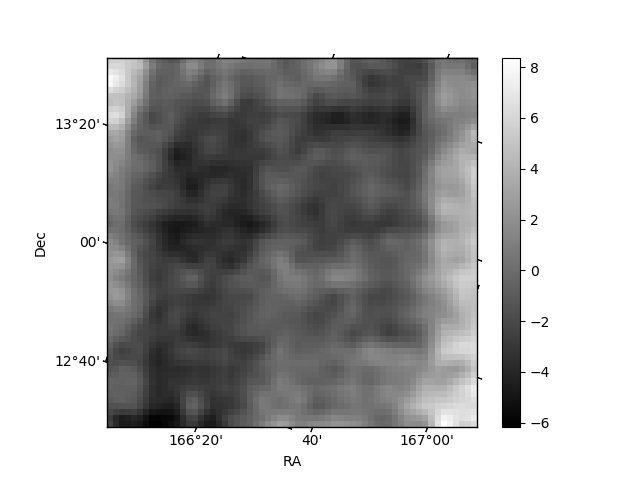
Histogram calculated using DETX and DETY for each event in the final _common_clean file
| Quadrant A | 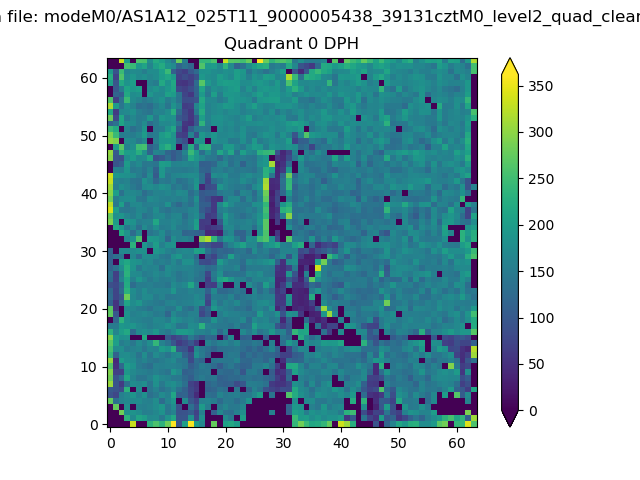 |
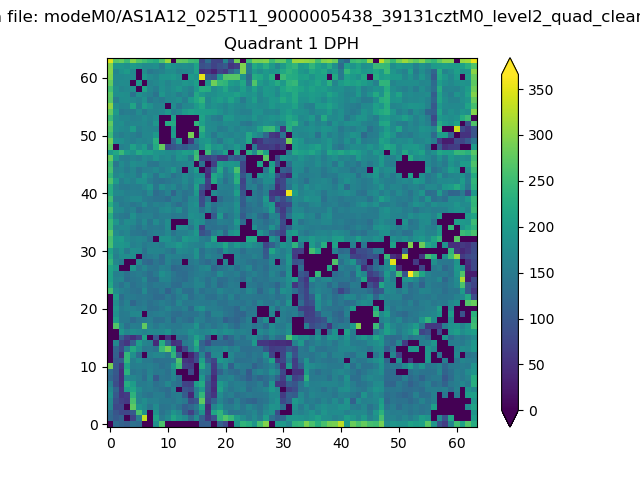 |
Quadrant B |
|---|---|---|---|
| Quadrant D | 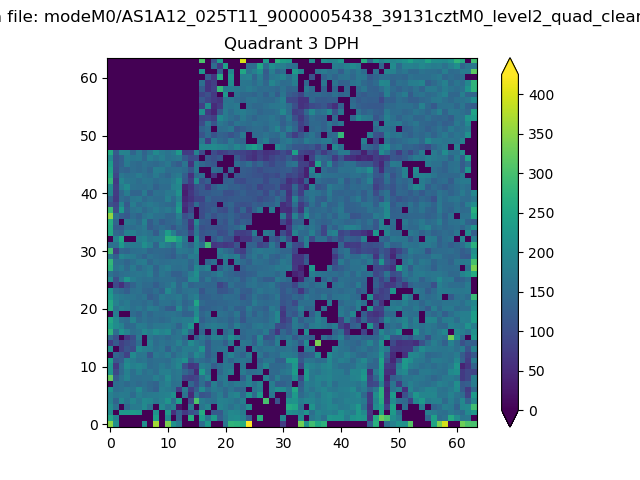 |
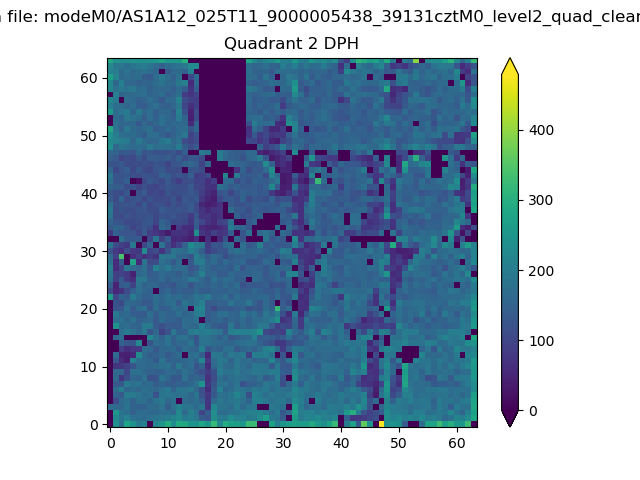 |
Quadrant C |
| Plot type | Count rate plots | Images |
|---|---|---|
| Comparison with Poisson distribution Blue bars denote a histogram of data divided into 1 sec bins. Red curve is a Poisson curve with rate = median count rate of data. |
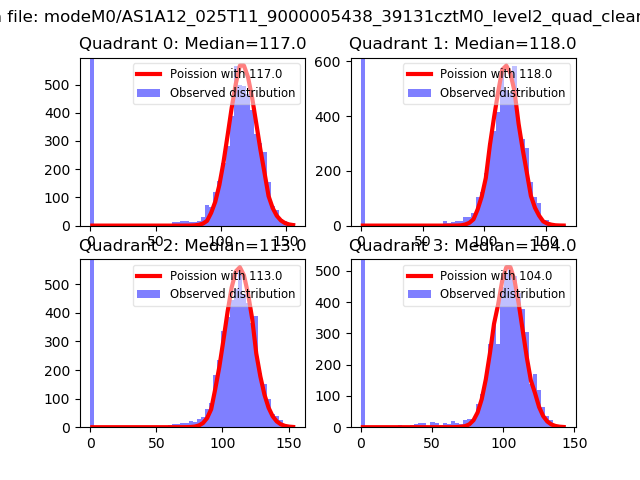 |
 |
| Quadrant-wise count rates Data is divided into 100 sec bins |
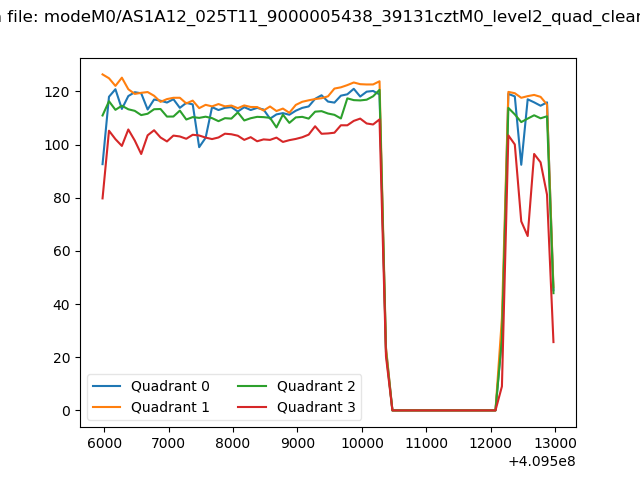 |
|
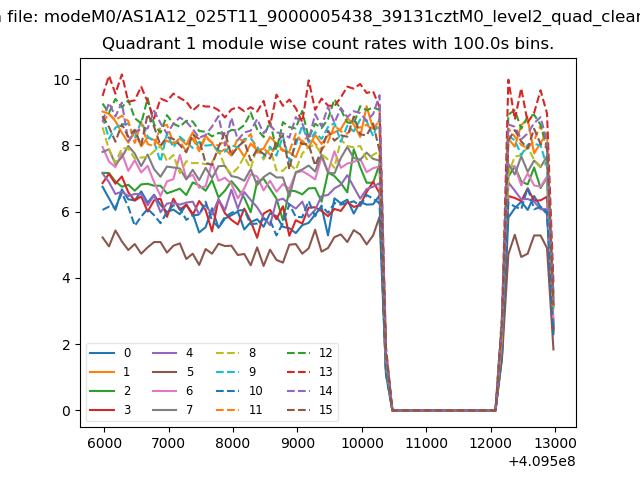
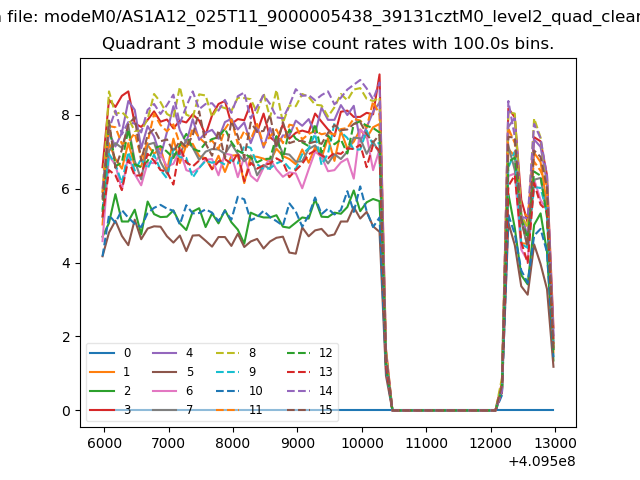
| Module-wise count rates for Quadrant A Data is divided into 100 sec bins |
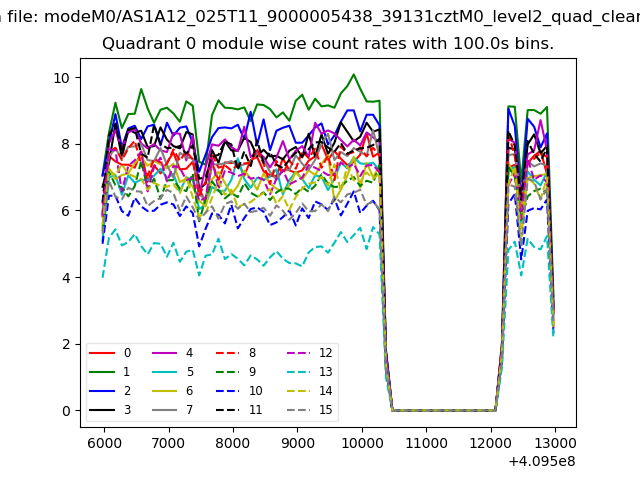 |
 |
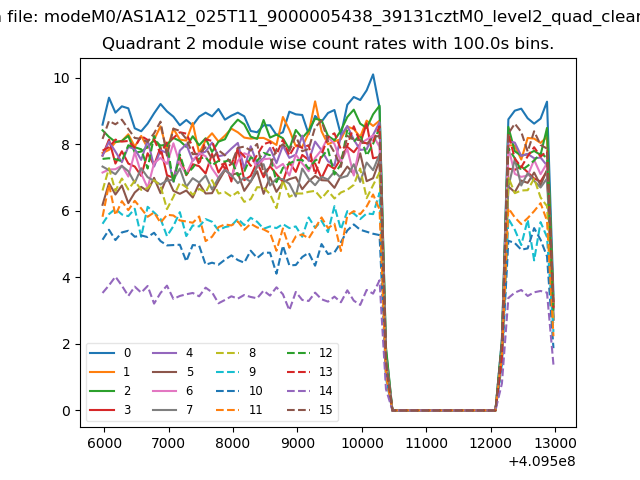
| Module-wise count rates for Quadrant B Data is divided into 100 sec bins |
 |
 |
| Module-wise count rates for Quadrant C Data is divided into 100 sec bins |
 |
 |
| Module-wise count rates for Quadrant D Data is divided into 100 sec bins |
 |
 |
| Parameter | Plot |
|---|---|
| CZT HV Monitor | 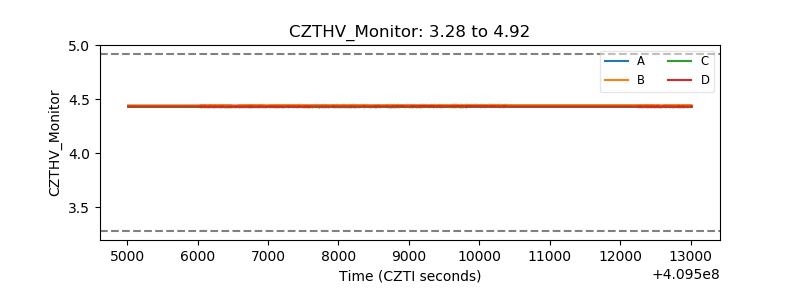 |
| D_VDD | 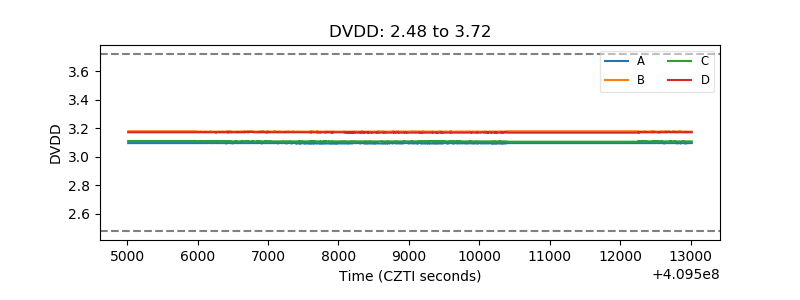 |
| Temperature 1 | 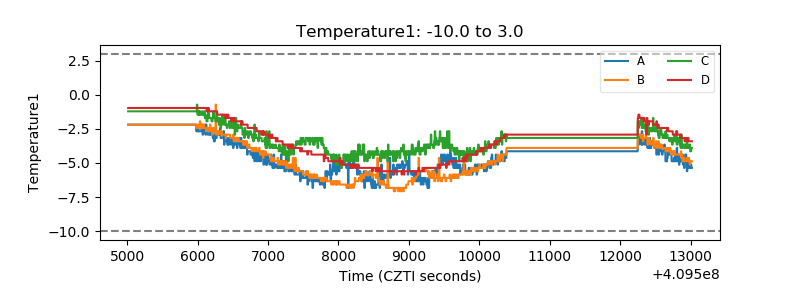 |
| Veto HV Monitor | 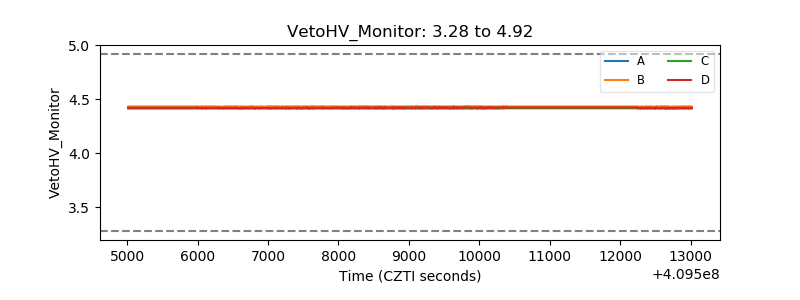 |
| Veto LLD | 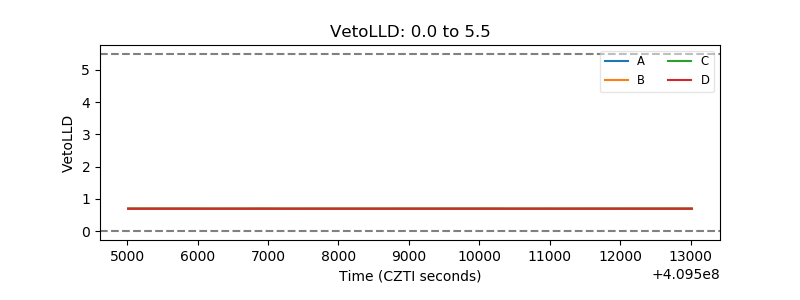 |
| Alpha Counter | 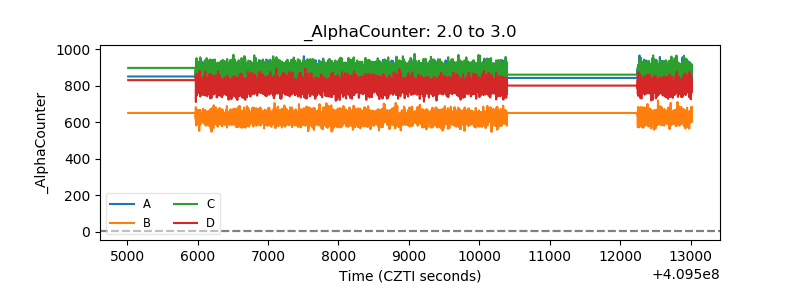 |
| _CPM_Rate | 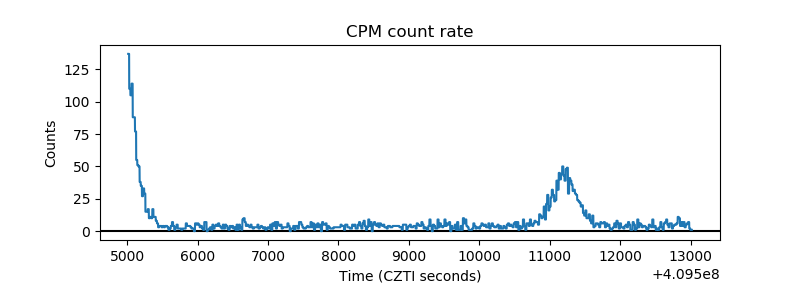 |
| CZT Counter | 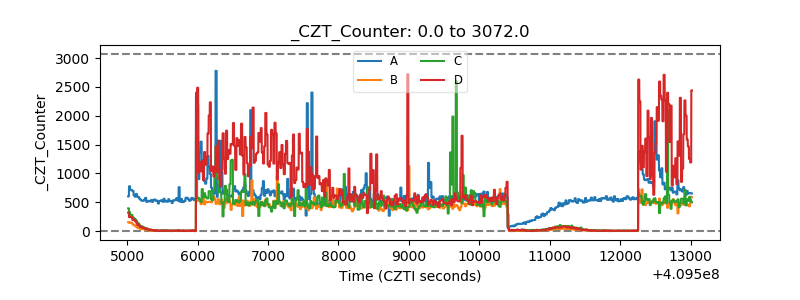 |
| +2.5 Volts monitor | 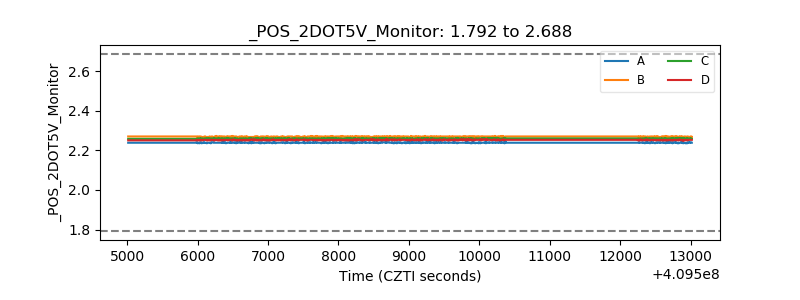 |
| +5 Volts monitor | 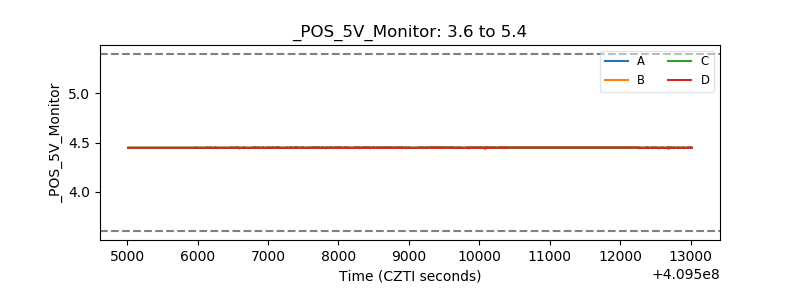 |
| _ROLL_ROT | 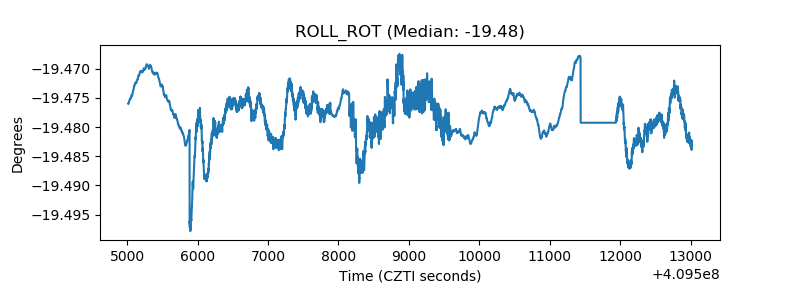 |
| _Roll_DEC | 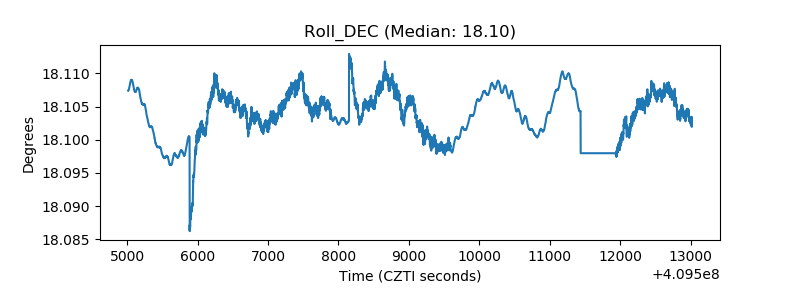 |
| _Roll_RA | 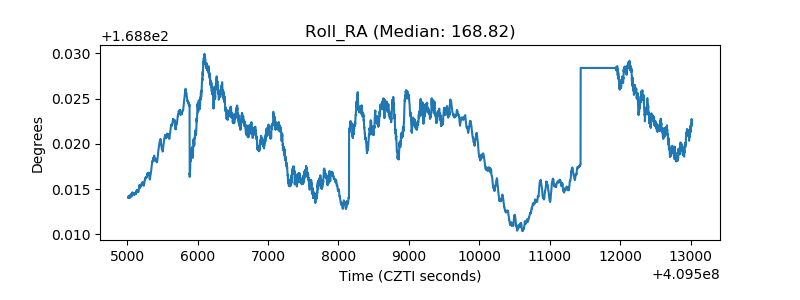 |
| Veto Counter | 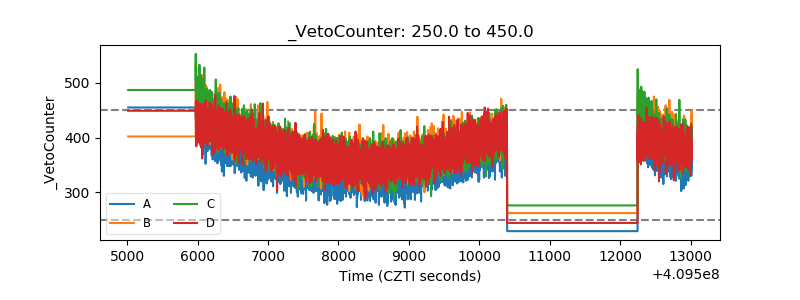 |