| Param | Original file | Final file |
|---|---|---|
| Filename | modeM0/AS1A12_044T16_9000005442_39136cztM0_level2.fits | modeM0/AS1A12_044T16_9000005442_39136cztM0_level2_quad_clean.evt |
| Size (bytes) | 930,432,960 | 129,176,640 |
| Size | 887.3 MB | 123.2 MB |
| Events in quadrant A | 4,464,342 | 957,709 |
| Events in quadrant B | 4,079,701 | 971,222 |
| Events in quadrant C | 10,796,403 | 777,838 |
| Events in quadrant D | 14,440,573 | 610,586 |
| Mode M0 | |||
|---|---|---|---|
| Quadrant | BADHDUFLAG | Total packets | Discarded packets |
| A | 0 | 18317 | 3 |
| B | 0 | 17744 | 2 |
| C | 0 | 38003 | 2 |
| D | 0 | 48782 | 2 |
| Mode M9 | |||
|---|---|---|---|
| Quadrant | BADHDUFLAG | Total packets | Discarded packets |
| A | 0 | 28 | 0 |
| B | 0 | 28 | 0 |
| C | 0 | 28 | 0 |
| D | 0 | 28 | 0 |
| Mode SS | |||
|---|---|---|---|
| Quadrant | BADHDUFLAG | Total packets | Discarded packets |
| A | 0 | 174 | 0 |
| B | 0 | 174 | 0 |
| C | 0 | 174 | 0 |
| D | 0 | 174 | 0 |
| Quadrant | Total seconds | Saturated seconds | Saturation percentage |
|---|---|---|---|
| A | 8550 | 26 | 0.304094% |
| B | 8550 | 66 | 0.771930% |
| C | 8550 | 1650 | 19.298246% |
| D | 8550 | 3157 | 36.923977% |
Noise dominated data is calculated using 1-second bins in cleaned event files. If a bin has >2000 counts, and if more than 50% of those come from <1% of pixels, then it is considered to be noise-dominated and hence unusable.
| Quadrant | # 1 sec bins | Bins with >0 counts | Bins with >2000 counts | High rate bins dominated by noise | Noise dominated (total time) | Noise dominated (detector-on time) | Marked lightcurve |
|---|---|---|---|---|---|---|---|
| A | 11384 | 8551 | 14 | 14 | 0.12% | 0.16% | 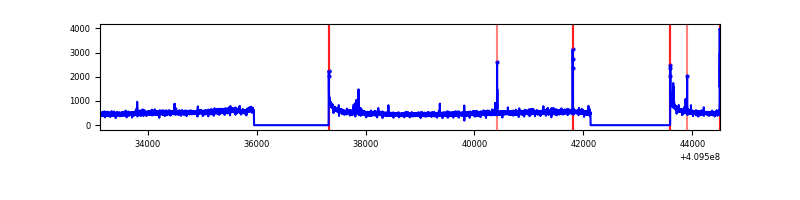 |
| B | 11385 | 8552 | 42 | 42 | 0.37% | 0.49% | 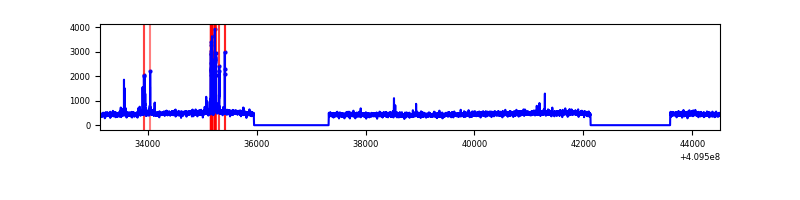 |
| C | 11385 | 8552 | 1445 | 1445 | 12.69% | 16.90% | 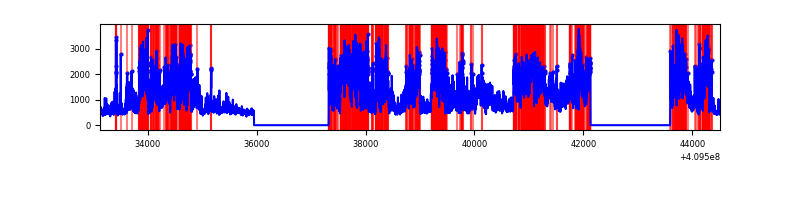 |
| D | 11385 | 8552 | 2843 | 2843 | 24.97% | 33.24% | 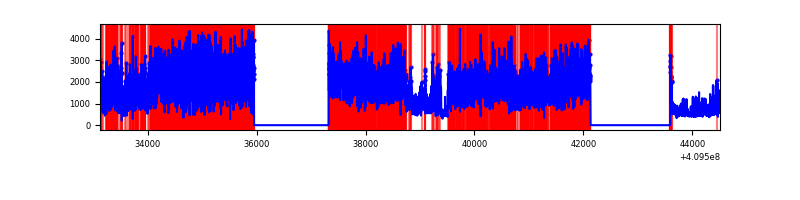 |
Top three noisy pixels from each quadrant. If the there are fewer than three noisy pixels in the level2.evt file, extra rows are filled as -1
| Pixel properties | Quadrant properties | ||||||
|---|---|---|---|---|---|---|---|
| Quadrant | DetID | PixID | Counts | Sigma | Mean | Median | Sigma |
| A | 10 | 83 | 550455 | 2748.18 | 986 | 967 | 199.9 |
| A | 9 | 143 | 39173 | 191.08 | 986 | 967 | 199.9 |
| A | 15 | 223 | 30017 | 145.29 | 986 | 967 | 199.9 |
| B | 5 | 172 | 137624 | 717.66 | 973 | 943 | 190.5 |
| B | 4 | 81 | 51036 | 263.02 | 973 | 943 | 190.5 |
| B | 0 | 213 | 25328 | 128.04 | 973 | 943 | 190.5 |
| C | 9 | 187 | 6916974 | 32692.62 | 905 | 912 | 211.5 |
| C | 15 | 214 | 331245 | 1561.5 | 905 | 912 | 211.5 |
| C | 2 | 16 | 7657 | 31.88 | 905 | 912 | 211.5 |
| D | 12 | 235 | 11054307 | 53923.68 | 852 | 829 | 205.0 |
| D | 2 | 249 | 41132 | 196.62 | 852 | 829 | 205.0 |
| D | 2 | 234 | 32338 | 153.71 | 852 | 829 | 205.0 |
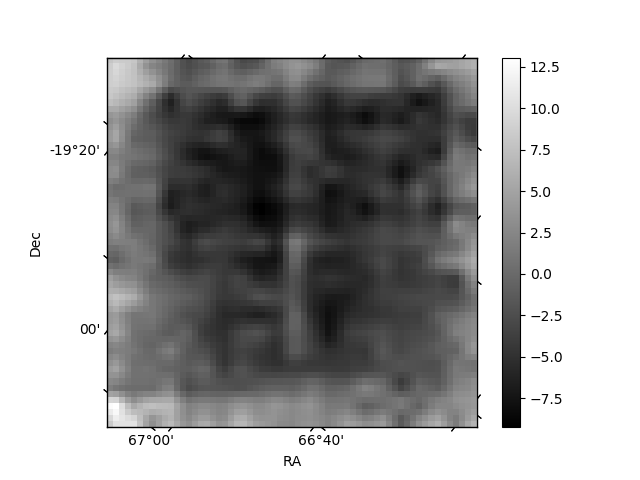
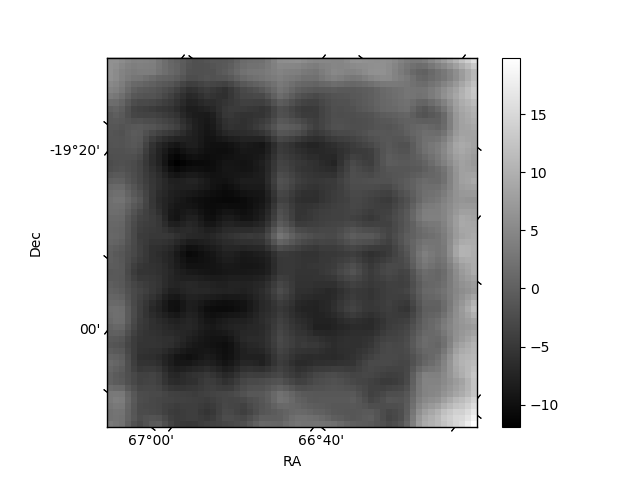
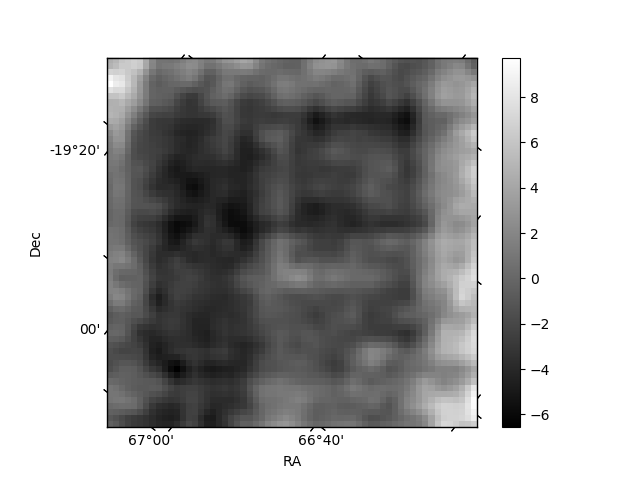
Histogram calculated using DETX and DETY for each event in the final _common_clean file
| Quadrant A | 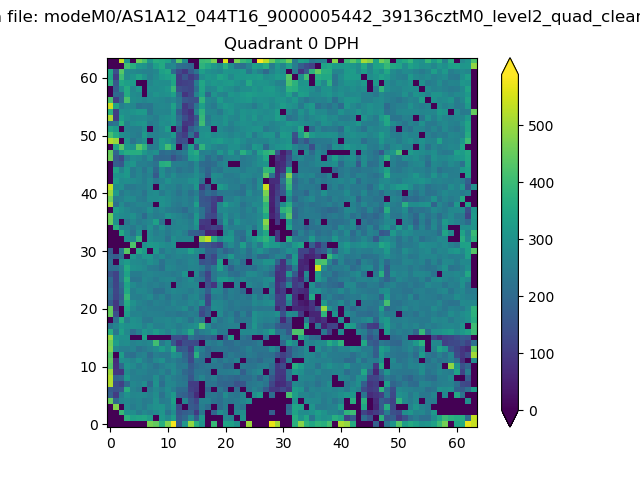 |
 |
Quadrant B |
|---|---|---|---|
| Quadrant D | 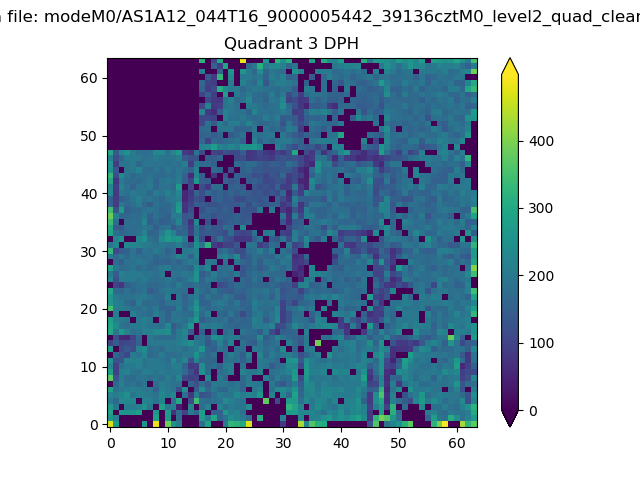 |
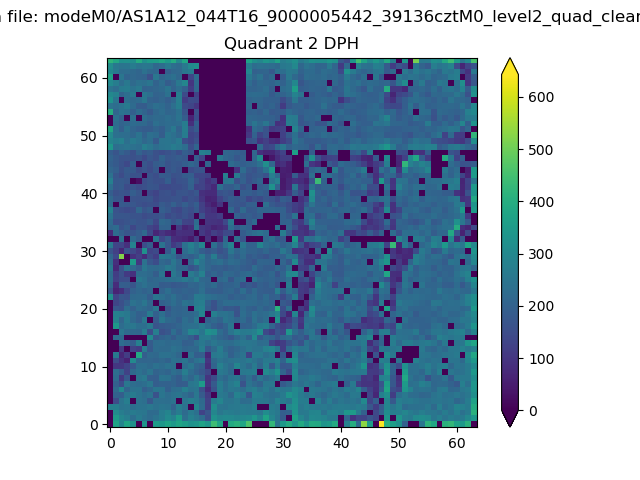 |
Quadrant C |
| Plot type | Count rate plots | Images |
|---|---|---|
| Comparison with Poisson distribution Blue bars denote a histogram of data divided into 1 sec bins. Red curve is a Poisson curve with rate = median count rate of data. |
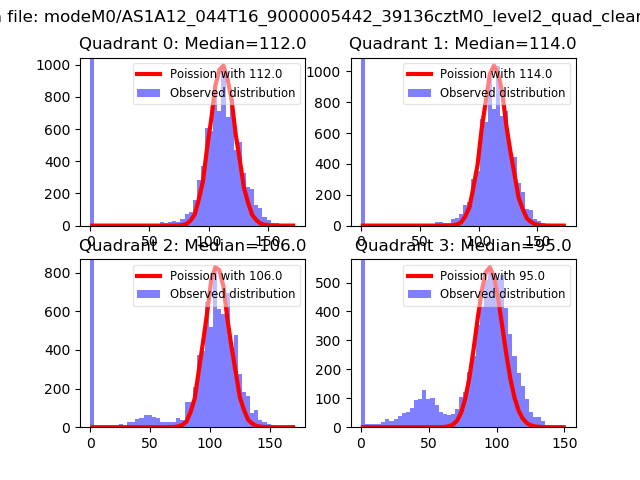 |
 |
| Quadrant-wise count rates Data is divided into 100 sec bins |
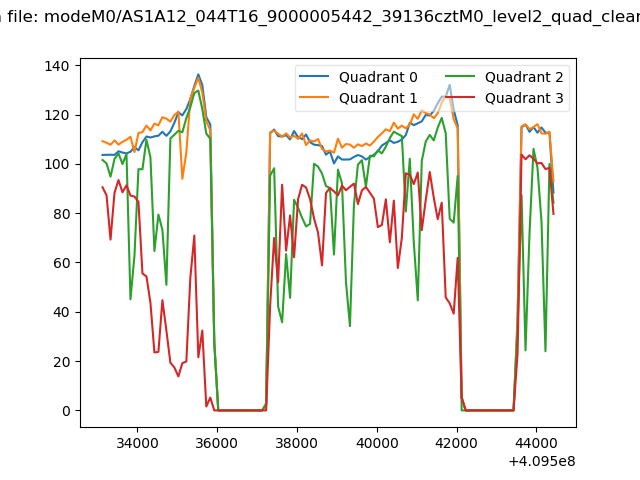 |
|
| Module-wise count rates for Quadrant A Data is divided into 100 sec bins |
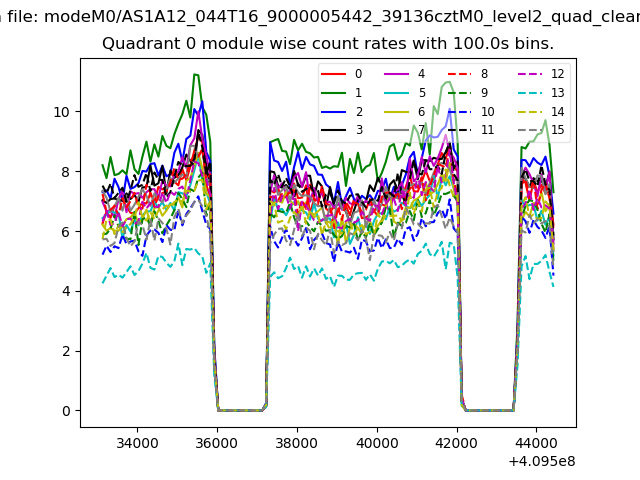 |
 |
| Module-wise count rates for Quadrant B Data is divided into 100 sec bins |
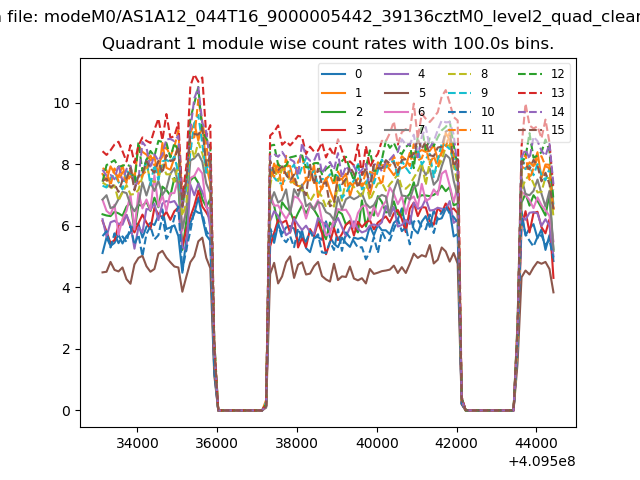 |
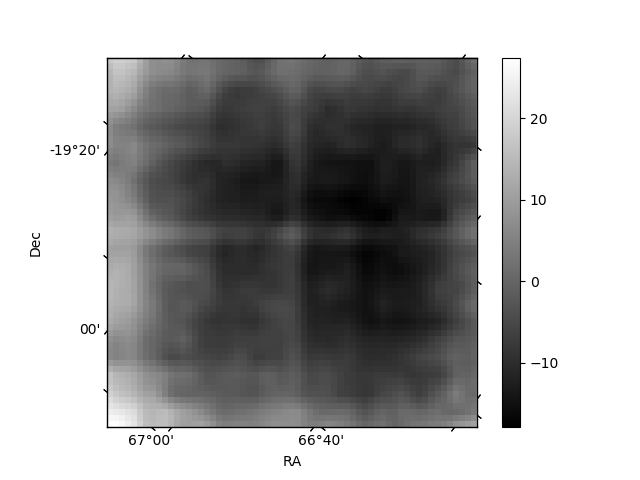 |
| Module-wise count rates for Quadrant C Data is divided into 100 sec bins |
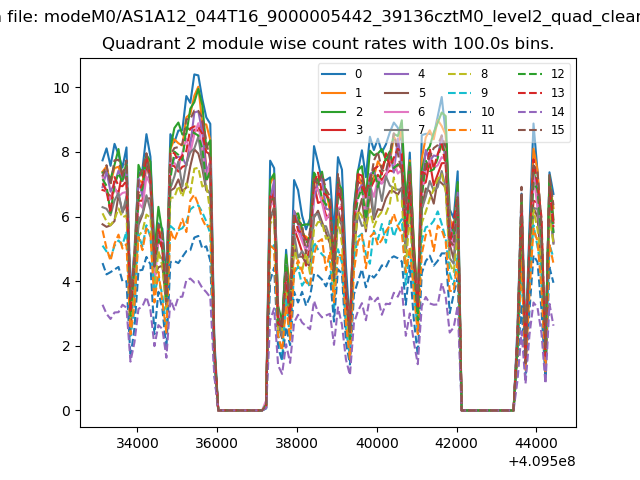 |
 |
| Module-wise count rates for Quadrant D Data is divided into 100 sec bins |
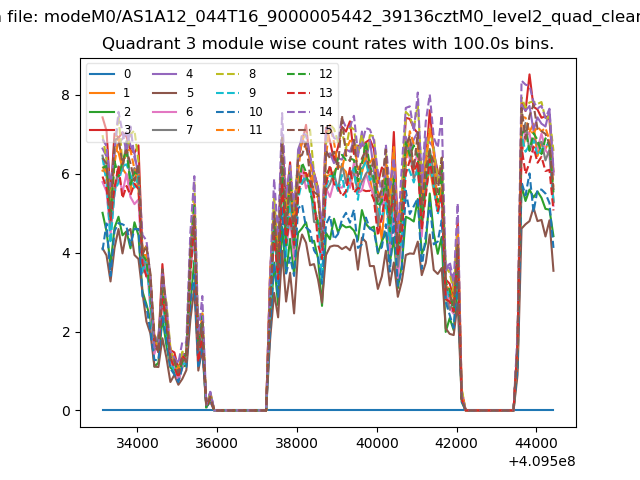 |
 |
| Parameter | Plot |
|---|---|
| CZT HV Monitor | 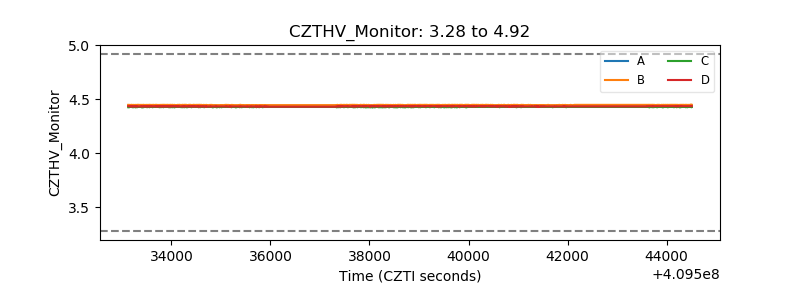 |
| D_VDD | 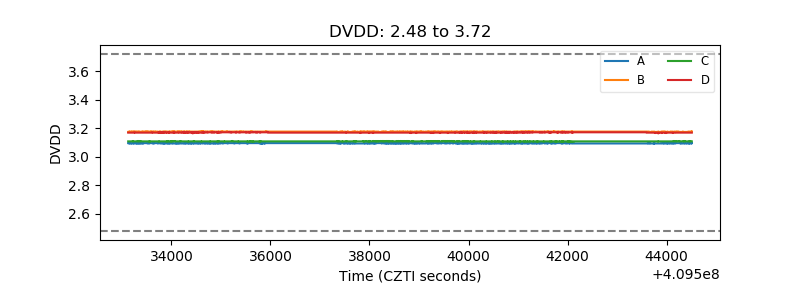 |
| Temperature 1 | 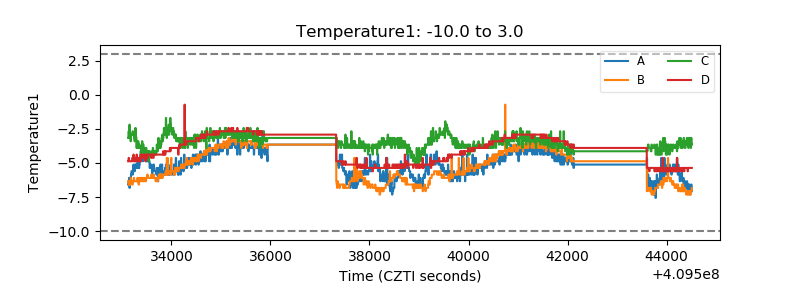 |
| Veto HV Monitor | 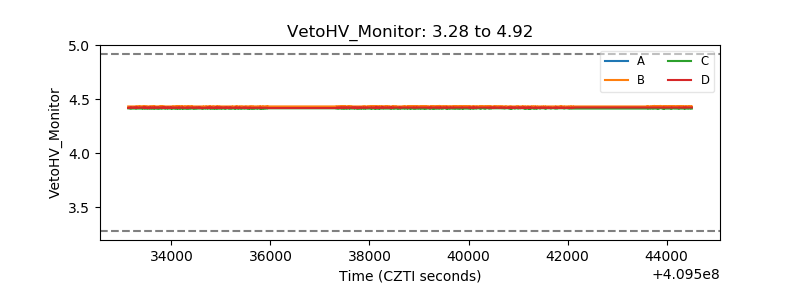 |
| Veto LLD | 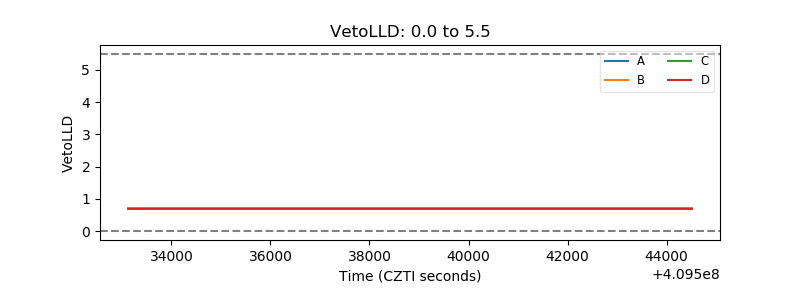 |
| Alpha Counter | 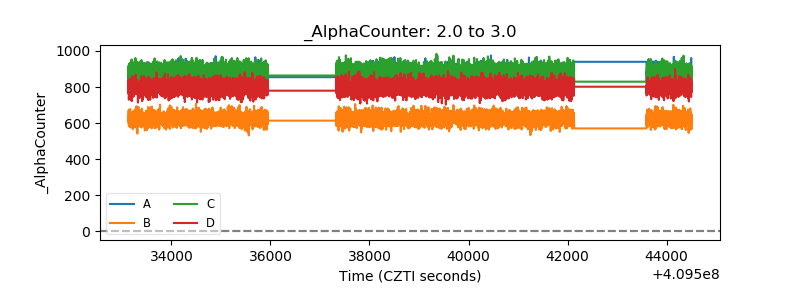 |
| _CPM_Rate | 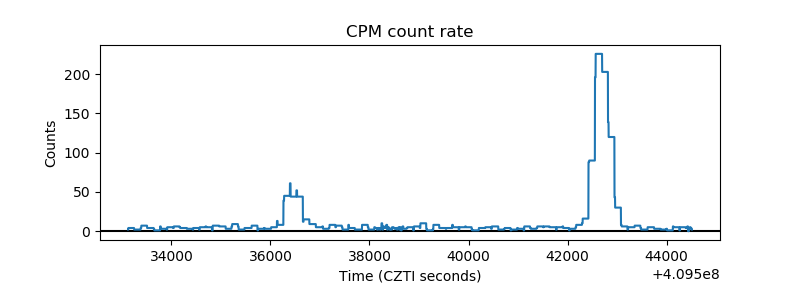 |
| CZT Counter | 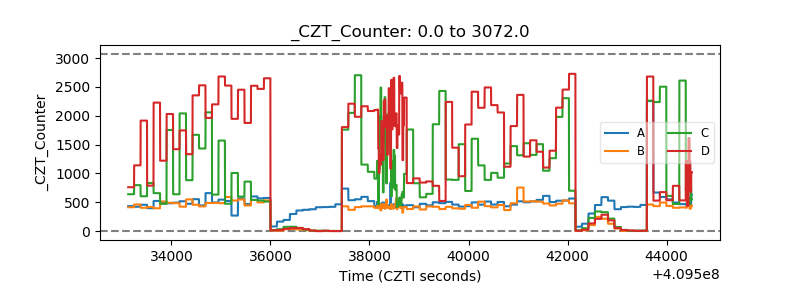 |
| +2.5 Volts monitor | 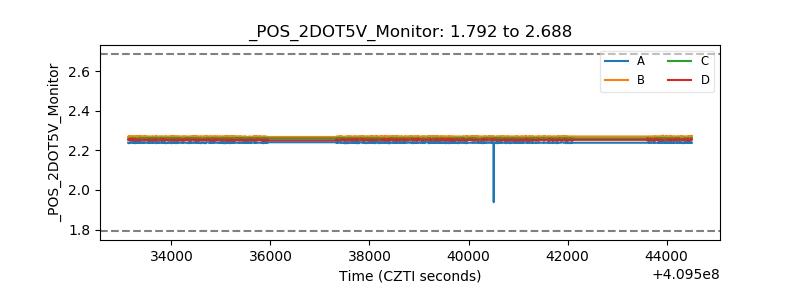 |
| +5 Volts monitor | 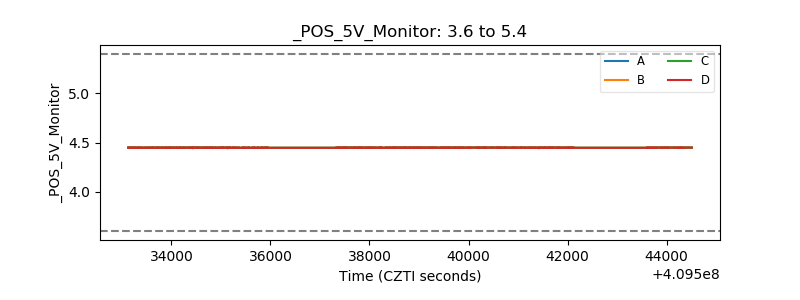 |
| _ROLL_ROT | 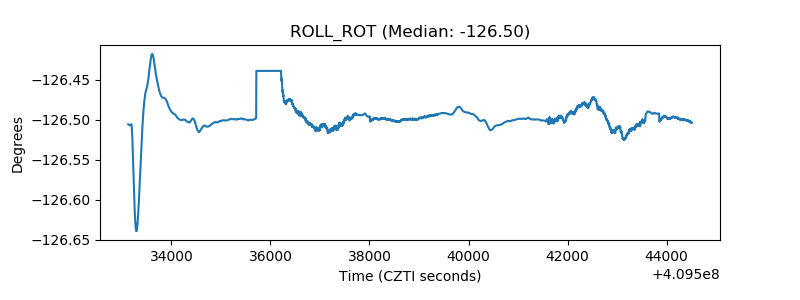 |
| _Roll_DEC | 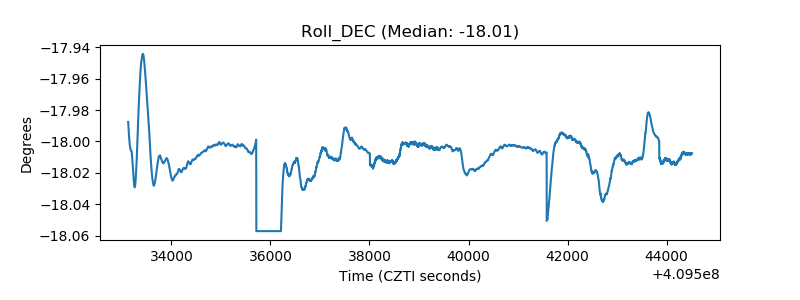 |
| _Roll_RA | 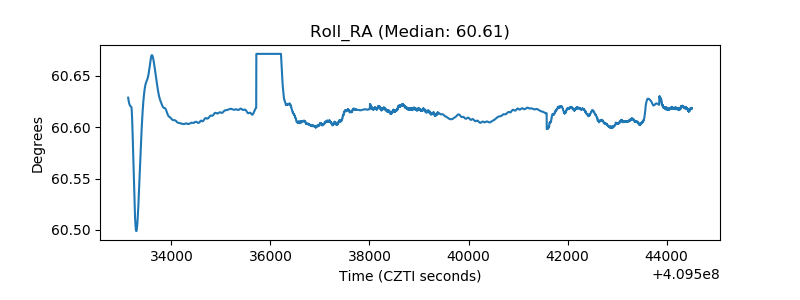 |
| Veto Counter | 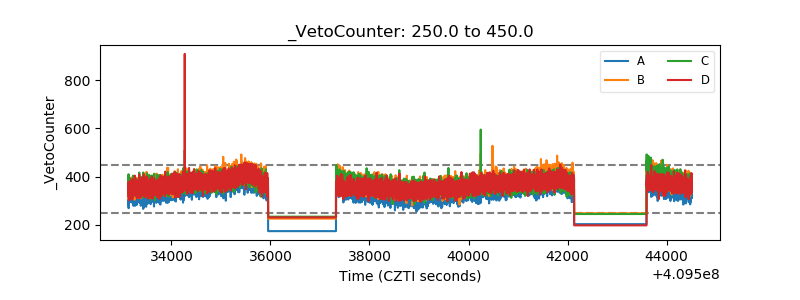 |