| Param | Original file | Final file |
|---|---|---|
| Filename | modeM0/AS1A12_044T16_9000005442_39137cztM0_level2.fits | modeM0/AS1A12_044T16_9000005442_39137cztM0_level2_quad_clean.evt |
| Size (bytes) | 1,245,637,440 | 204,598,080 |
| Size | 1.2 GB | 195.1 MB |
| Events in quadrant A | 6,907,280 | 1,469,575 |
| Events in quadrant B | 6,167,215 | 1,500,816 |
| Events in quadrant C | 13,098,768 | 1,260,732 |
| Events in quadrant D | 18,914,804 | 1,049,381 |
| Mode M0 | |||
|---|---|---|---|
| Quadrant | BADHDUFLAG | Total packets | Discarded packets |
| A | 0 | 28317 | 4 |
| B | 0 | 27143 | 3 |
| C | 0 | 47570 | 3 |
| D | 0 | 65317 | 3 |
| Mode M9 | |||
|---|---|---|---|
| Quadrant | BADHDUFLAG | Total packets | Discarded packets |
| A | 0 | 44 | 0 |
| B | 0 | 44 | 0 |
| C | 0 | 44 | 0 |
| D | 0 | 44 | 0 |
| Mode SS | |||
|---|---|---|---|
| Quadrant | BADHDUFLAG | Total packets | Discarded packets |
| A | 0 | 270 | 0 |
| B | 0 | 270 | 0 |
| C | 0 | 270 | 0 |
| D | 0 | 270 | 0 |
| Quadrant | Total seconds | Saturated seconds | Saturation percentage |
|---|---|---|---|
| A | 13229 | 57 | 0.430872% |
| B | 13229 | 70 | 0.529141% |
| C | 13229 | 1652 | 12.487716% |
| D | 13229 | 3470 | 26.230252% |
Noise dominated data is calculated using 1-second bins in cleaned event files. If a bin has >2000 counts, and if more than 50% of those come from <1% of pixels, then it is considered to be noise-dominated and hence unusable.
| Quadrant | # 1 sec bins | Bins with >0 counts | Bins with >2000 counts | High rate bins dominated by noise | Noise dominated (total time) | Noise dominated (detector-on time) | Marked lightcurve |
|---|---|---|---|---|---|---|---|
| A | 17616 | 13232 | 40 | 40 | 0.23% | 0.30% | 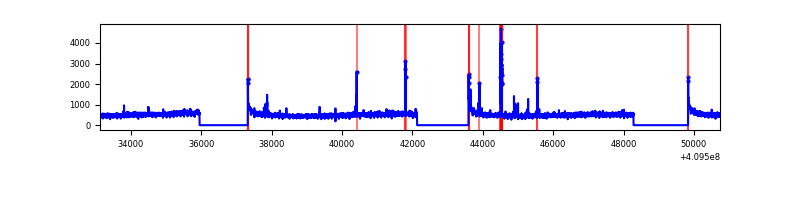 |
| B | 17616 | 13232 | 42 | 42 | 0.24% | 0.32% | 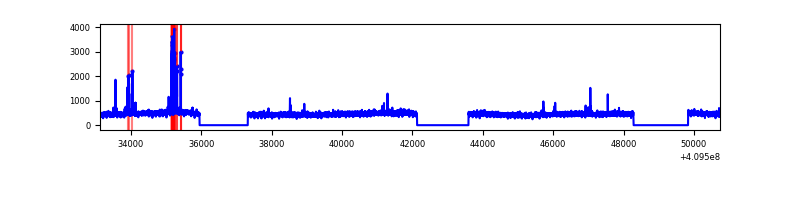 |
| C | 17616 | 13232 | 1445 | 1445 | 8.20% | 10.92% | 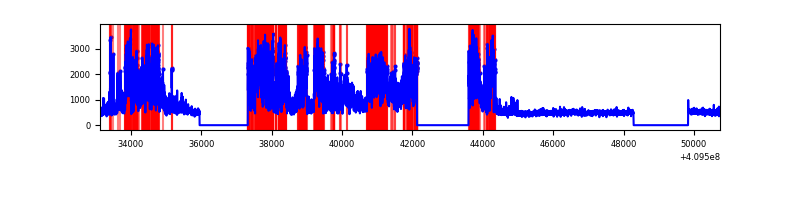 |
| D | 17616 | 13232 | 3151 | 3151 | 17.89% | 23.81% | 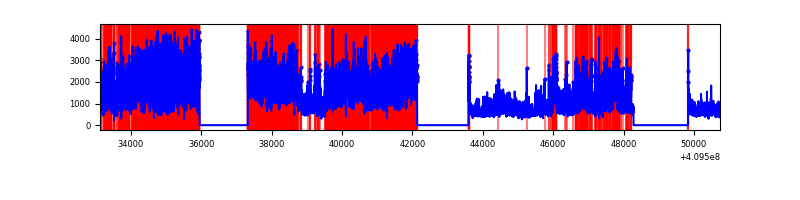 |
Top three noisy pixels from each quadrant. If the there are fewer than three noisy pixels in the level2.evt file, extra rows are filled as -1
| Pixel properties | Quadrant properties | ||||||
|---|---|---|---|---|---|---|---|
| Quadrant | DetID | PixID | Counts | Sigma | Mean | Median | Sigma |
| A | 10 | 83 | 845061 | 2753.83 | 1514 | 1484 | 306.3 |
| A | 9 | 143 | 109717 | 353.32 | 1514 | 1484 | 306.3 |
| A | 15 | 223 | 35534 | 111.15 | 1514 | 1484 | 306.3 |
| B | 5 | 172 | 151808 | 520.22 | 1498 | 1454 | 289.0 |
| B | 4 | 81 | 51799 | 174.19 | 1498 | 1454 | 289.0 |
| B | 12 | 111 | 37647 | 125.23 | 1498 | 1454 | 289.0 |
| C | 9 | 187 | 6992144 | 21019.3 | 1422 | 1430 | 332.6 |
| C | 15 | 214 | 522073 | 1565.44 | 1422 | 1430 | 332.6 |
| C | 0 | 239 | 16437 | 45.12 | 1422 | 1430 | 332.6 |
| D | 12 | 235 | 13158956 | 39796.82 | 1361 | 1324 | 330.6 |
| D | 2 | 249 | 291156 | 876.63 | 1361 | 1324 | 330.6 |
| D | 5 | 222 | 191331 | 574.7 | 1361 | 1324 | 330.6 |
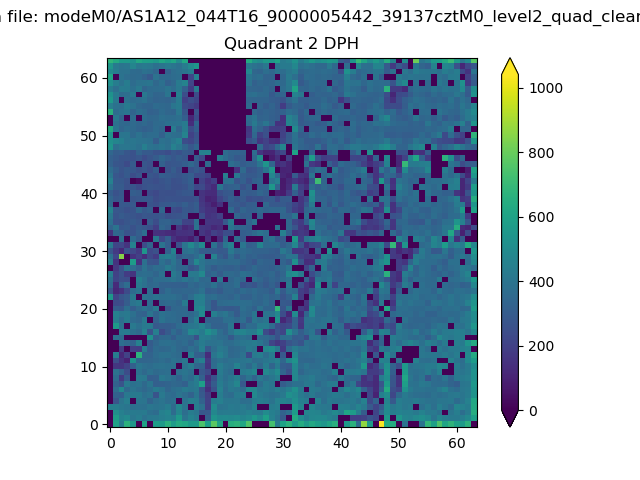
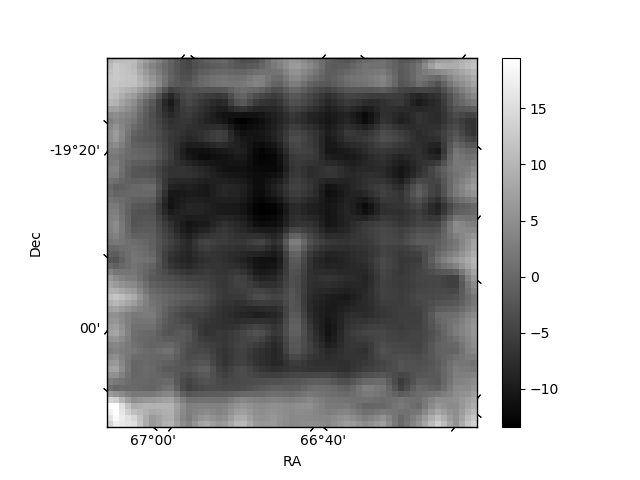
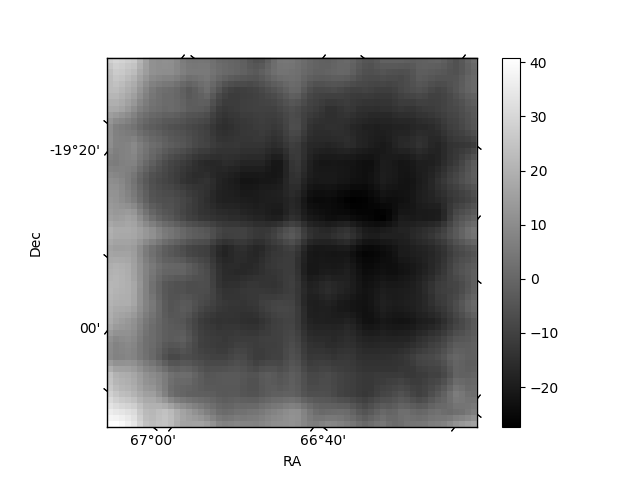
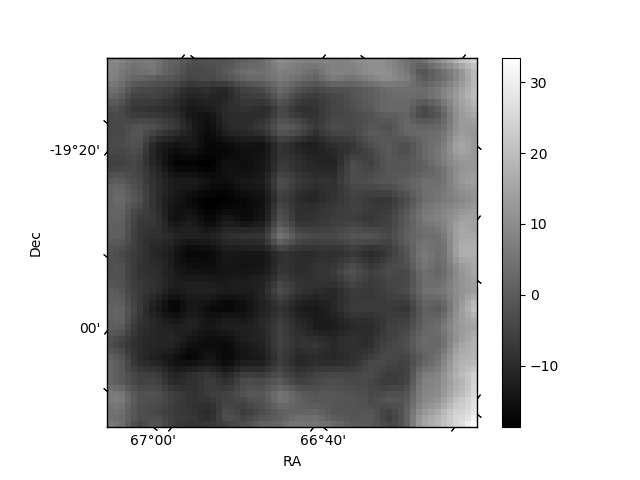
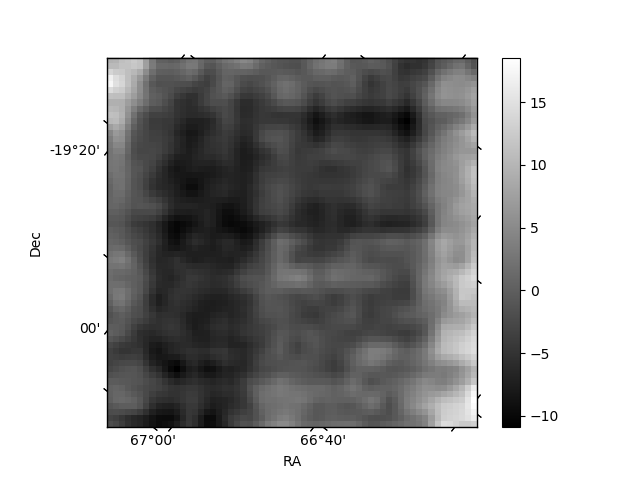
Histogram calculated using DETX and DETY for each event in the final _common_clean file
| Quadrant A | 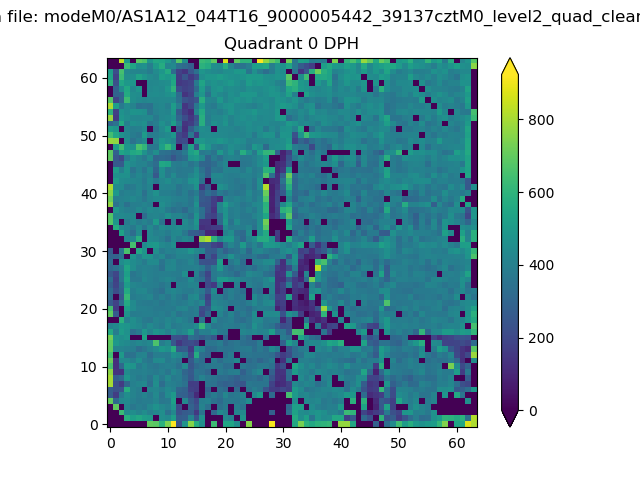 |
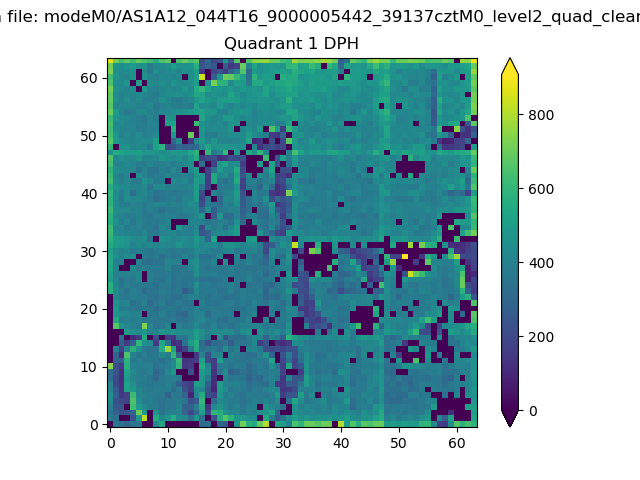 |
Quadrant B |
|---|---|---|---|
| Quadrant D | 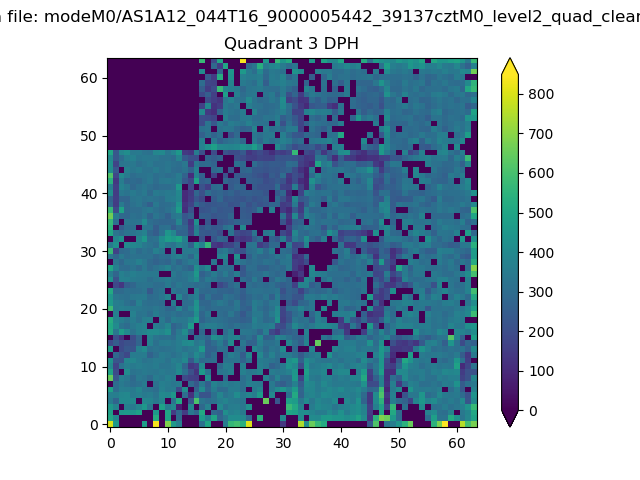 |
 |
Quadrant C |
| Plot type | Count rate plots | Images |
|---|---|---|
| Comparison with Poisson distribution Blue bars denote a histogram of data divided into 1 sec bins. Red curve is a Poisson curve with rate = median count rate of data. |
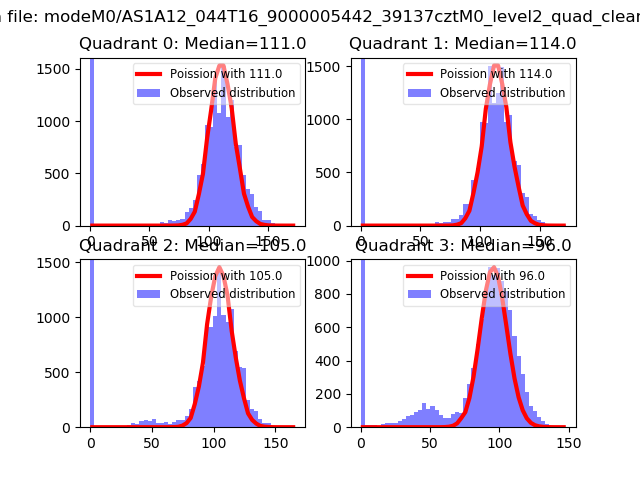 |
 |
| Quadrant-wise count rates Data is divided into 100 sec bins |
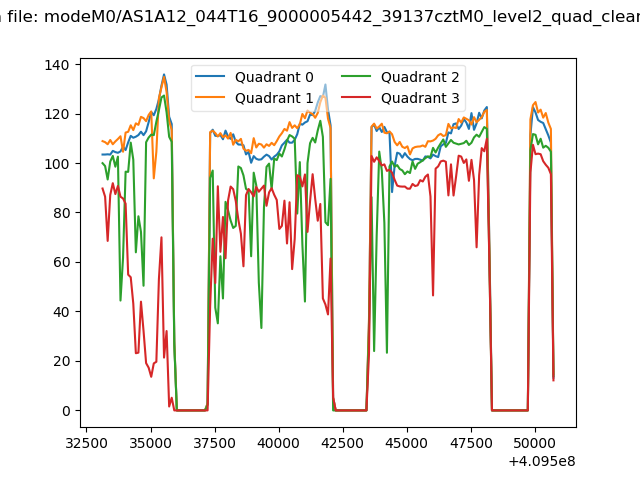 |
|
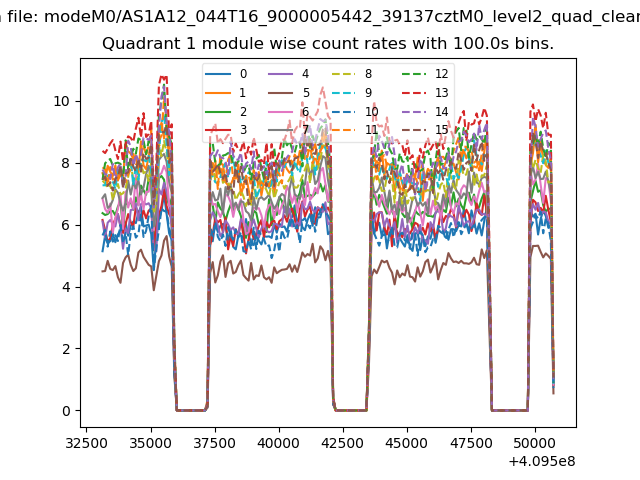
| Module-wise count rates for Quadrant A Data is divided into 100 sec bins |
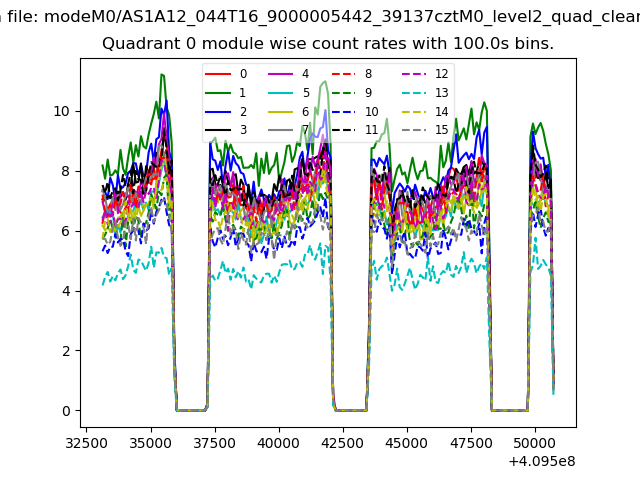 |
 |
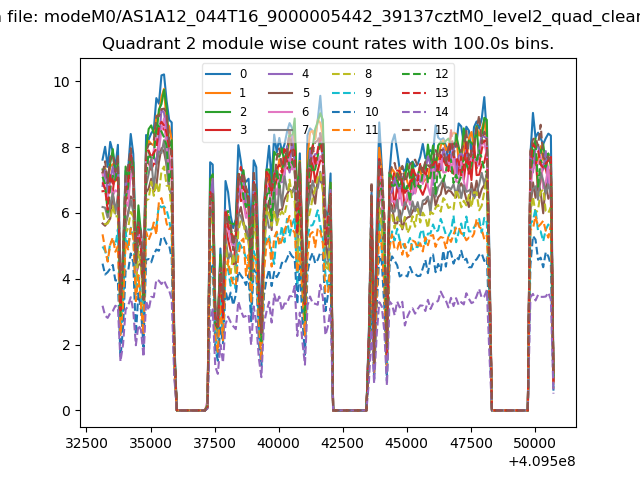
| Module-wise count rates for Quadrant B Data is divided into 100 sec bins |
 |
 |
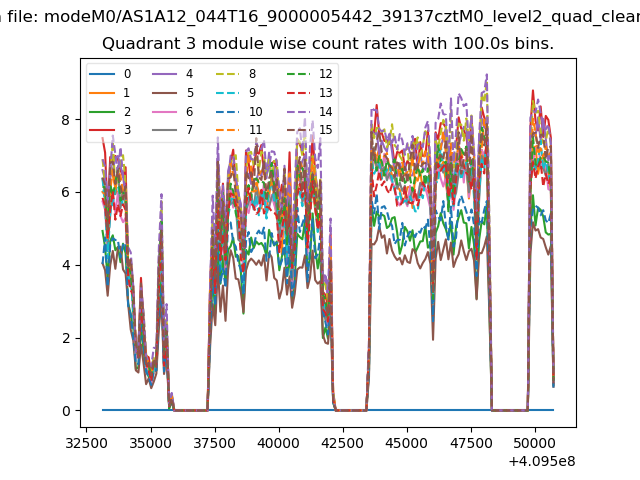
| Module-wise count rates for Quadrant C Data is divided into 100 sec bins |
 |
 |
| Module-wise count rates for Quadrant D Data is divided into 100 sec bins |
 |
 |
| Parameter | Plot |
|---|---|
| CZT HV Monitor | 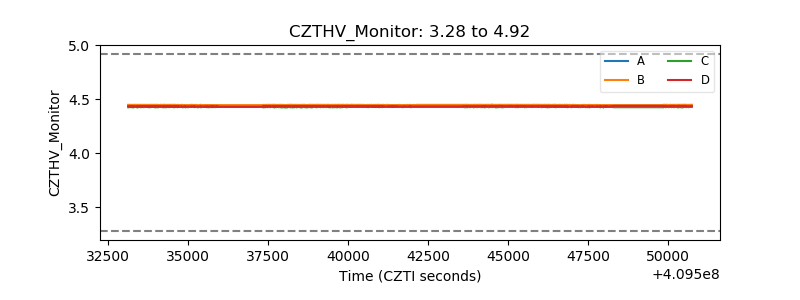 |
| D_VDD | 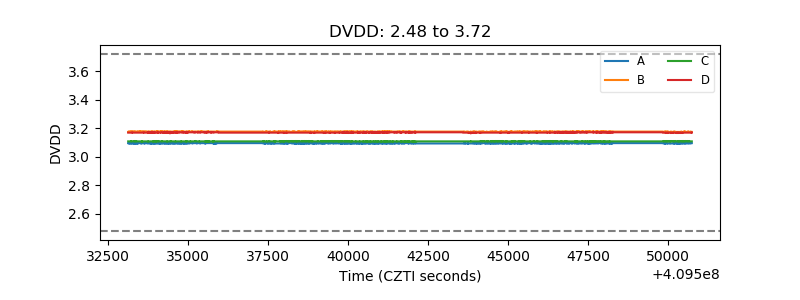 |
| Temperature 1 | 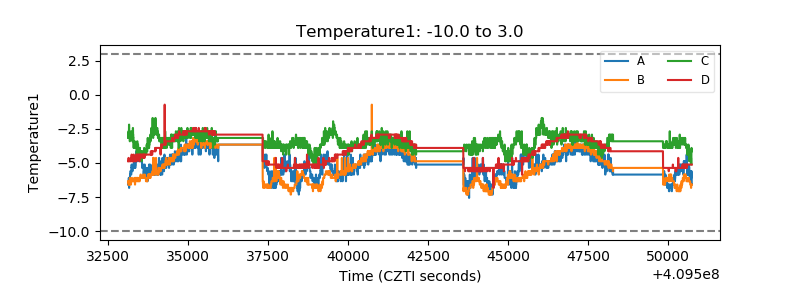 |
| Veto HV Monitor | 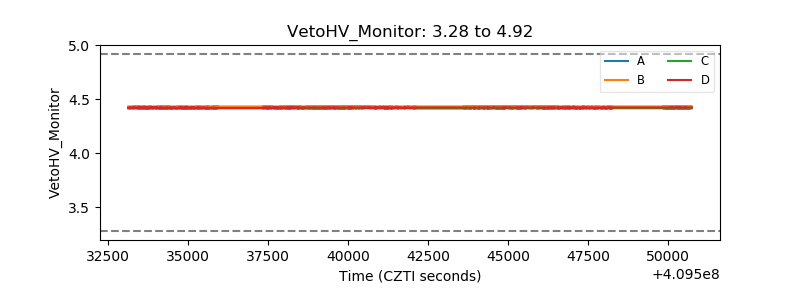 |
| Veto LLD | 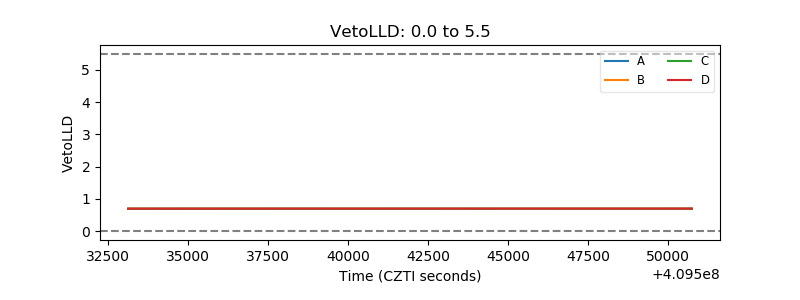 |
| Alpha Counter | 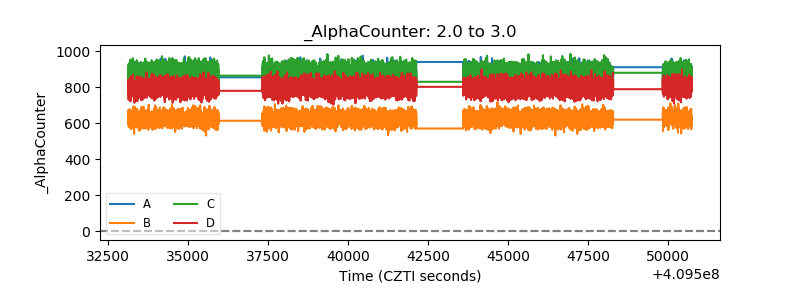 |
| _CPM_Rate | 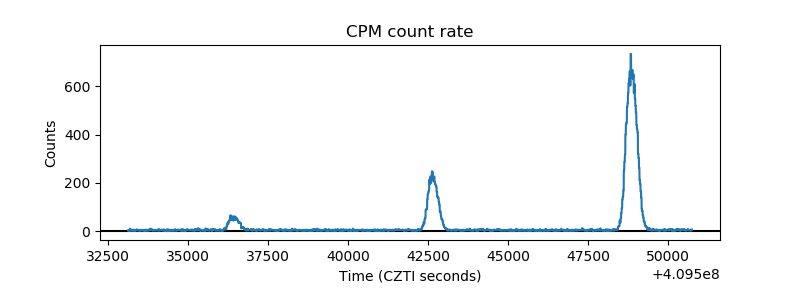 |
| CZT Counter | 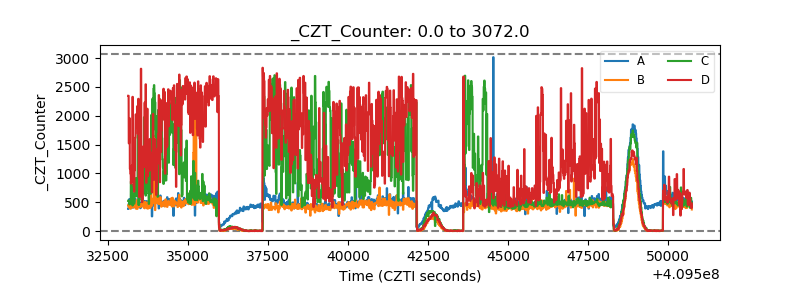 |
| +2.5 Volts monitor | 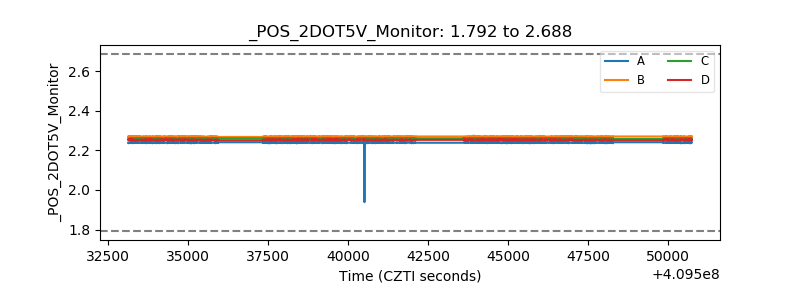 |
| +5 Volts monitor | 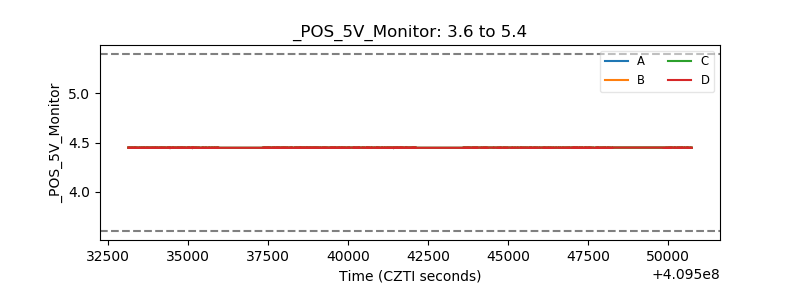 |
| _ROLL_ROT | 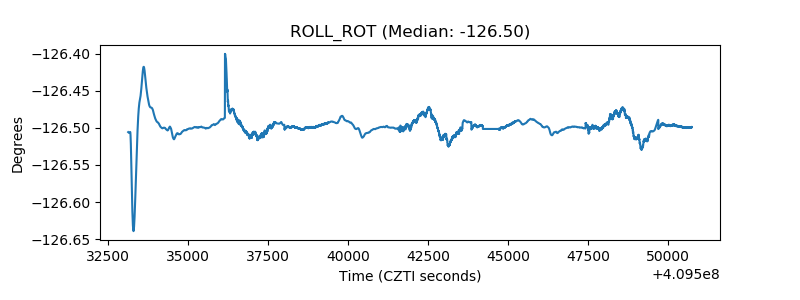 |
| _Roll_DEC | 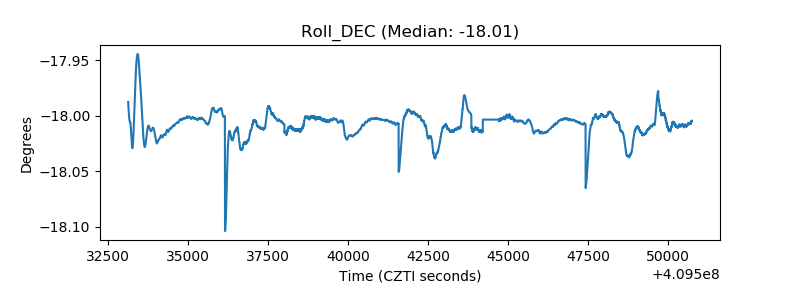 |
| _Roll_RA |  |
| Veto Counter | 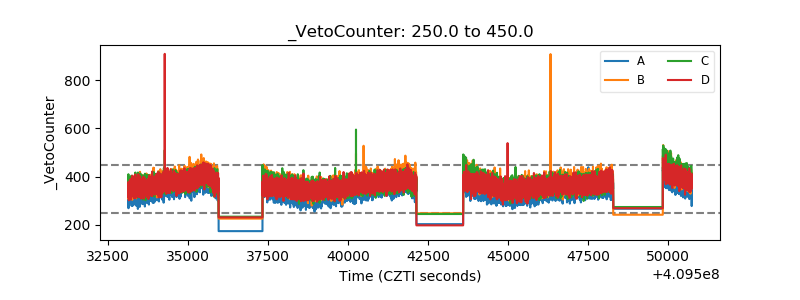 |