| Param | Original file | Final file |
|---|---|---|
| Filename | modeM0/AS1A12_044T16_9000005442_39138cztM0_level2.fits | modeM0/AS1A12_044T16_9000005442_39138cztM0_level2_quad_clean.evt |
| Size (bytes) | 355,092,480 | 97,384,320 |
| Size | 338.6 MB | 92.9 MB |
| Events in quadrant A | 2,967,004 | 655,373 |
| Events in quadrant B | 2,586,005 | 672,486 |
| Events in quadrant C | 2,809,780 | 636,984 |
| Events in quadrant D | 4,339,573 | 587,188 |
| Mode M0 | |||
|---|---|---|---|
| Quadrant | BADHDUFLAG | Total packets | Discarded packets |
| A | 0 | 12188 | 3 |
| B | 0 | 11412 | 2 |
| C | 0 | 11710 | 2 |
| D | 0 | 16770 | 2 |
| Mode M9 | |||
|---|---|---|---|
| Quadrant | BADHDUFLAG | Total packets | Discarded packets |
| A | 0 | 33 | 0 |
| B | 0 | 33 | 0 |
| C | 0 | 33 | 0 |
| D | 0 | 33 | 0 |
| Mode SS | |||
|---|---|---|---|
| Quadrant | BADHDUFLAG | Total packets | Discarded packets |
| A | 0 | 116 | 0 |
| B | 0 | 116 | 0 |
| C | 0 | 116 | 0 |
| D | 0 | 116 | 0 |
| Quadrant | Total seconds | Saturated seconds | Saturation percentage |
|---|---|---|---|
| A | 5681 | 10 | 0.176025% |
| B | 5681 | 8 | 0.140820% |
| C | 5681 | 10 | 0.176025% |
| D | 5681 | 110 | 1.936279% |
Noise dominated data is calculated using 1-second bins in cleaned event files. If a bin has >2000 counts, and if more than 50% of those come from <1% of pixels, then it is considered to be noise-dominated and hence unusable.
| Quadrant | # 1 sec bins | Bins with >0 counts | Bins with >2000 counts | High rate bins dominated by noise | Noise dominated (total time) | Noise dominated (detector-on time) | Marked lightcurve |
|---|---|---|---|---|---|---|---|
| A | 8935 | 5683 | 6 | 6 | 0.07% | 0.11% | 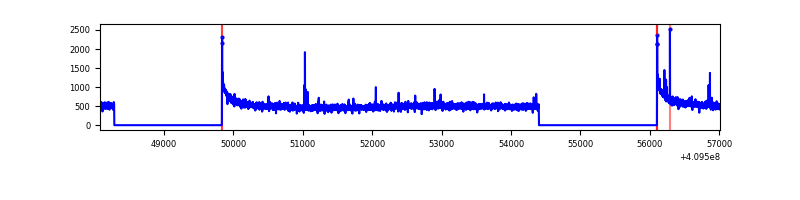 |
| B | 8935 | 5683 | 1 | 1 | 0.01% | 0.02% | 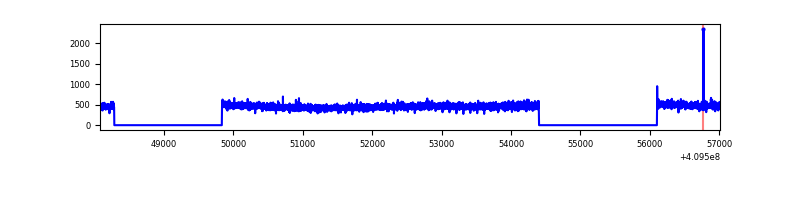 |
| C | 8935 | 5683 | 9 | 9 | 0.10% | 0.16% | 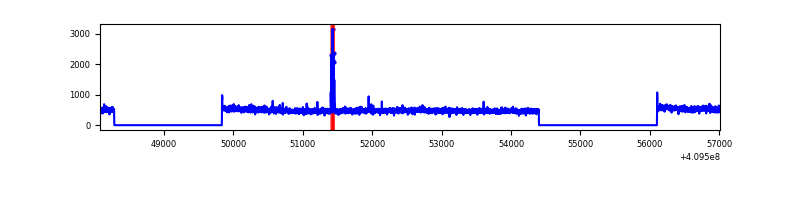 |
| D | 8935 | 5683 | 105 | 105 | 1.18% | 1.85% | 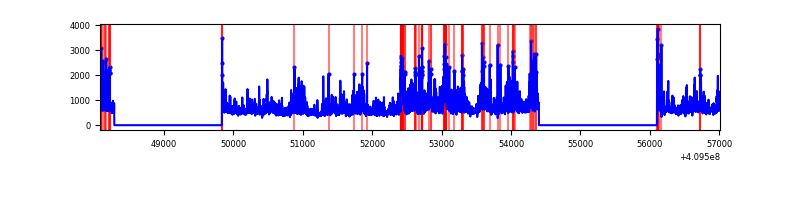 |
Top three noisy pixels from each quadrant. If the there are fewer than three noisy pixels in the level2.evt file, extra rows are filled as -1
| Pixel properties | Quadrant properties | ||||||
|---|---|---|---|---|---|---|---|
| Quadrant | DetID | PixID | Counts | Sigma | Mean | Median | Sigma |
| A | 10 | 83 | 423225 | 3195.79 | 649 | 636 | 132.2 |
| A | 9 | 143 | 27138 | 200.42 | 649 | 636 | 132.2 |
| A | 13 | 254 | 7230 | 49.87 | 649 | 636 | 132.2 |
| B | 0 | 213 | 21894 | 169.46 | 649 | 631 | 125.5 |
| B | 12 | 111 | 16086 | 123.17 | 649 | 631 | 125.5 |
| B | 11 | 111 | 14829 | 113.15 | 649 | 631 | 125.5 |
| C | 15 | 214 | 236951 | 1587.04 | 637 | 641 | 148.9 |
| C | 15 | 208 | 50127 | 332.34 | 637 | 641 | 148.9 |
| C | 9 | 187 | 32486 | 213.87 | 637 | 641 | 148.9 |
| D | 12 | 235 | 1523297 | 10036.26 | 631 | 615 | 151.7 |
| D | 2 | 249 | 212369 | 1395.71 | 631 | 615 | 151.7 |
| D | 5 | 222 | 148403 | 974.1 | 631 | 615 | 151.7 |
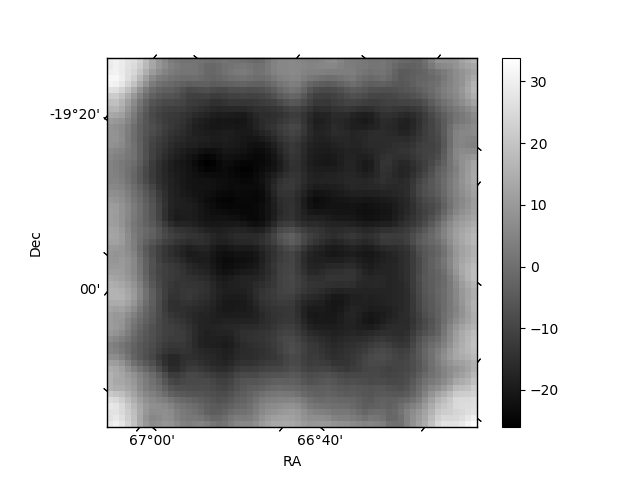
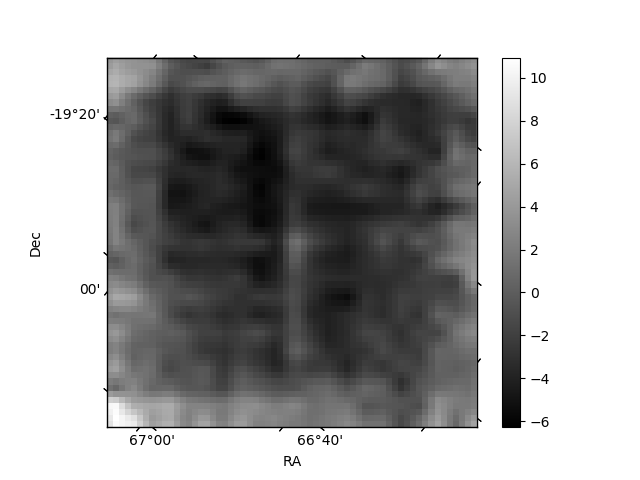
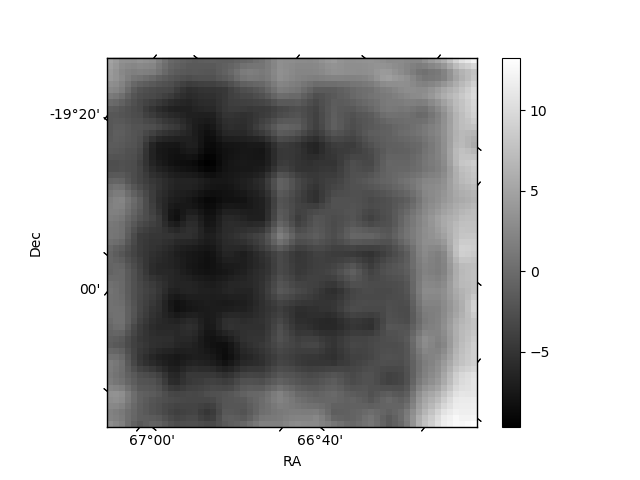
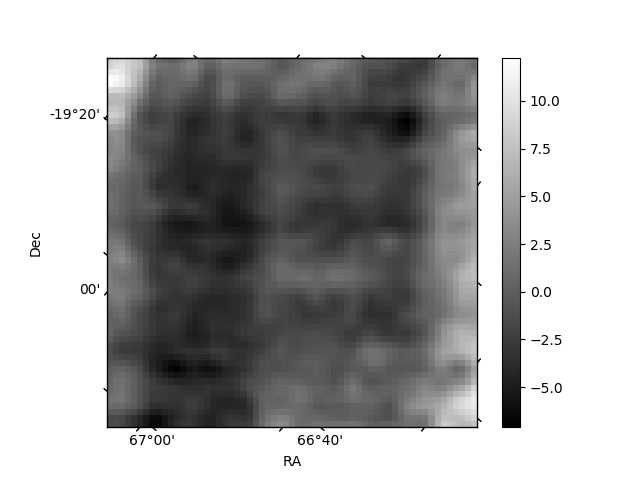
Histogram calculated using DETX and DETY for each event in the final _common_clean file
| Quadrant A | 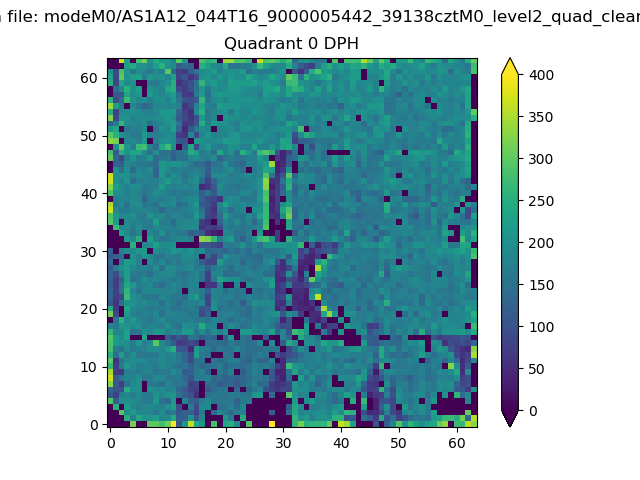 |
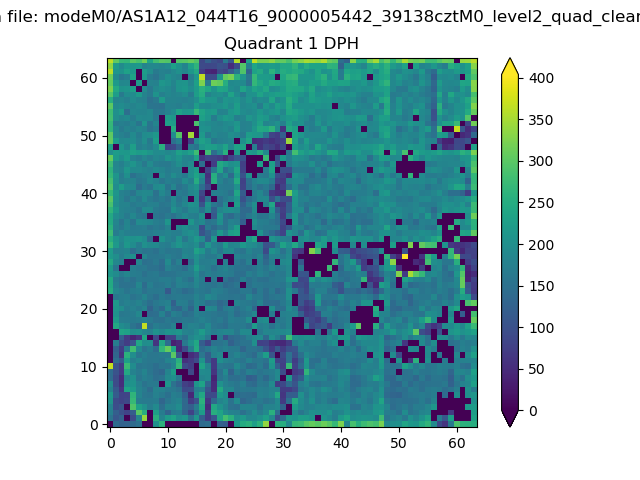 |
Quadrant B |
|---|---|---|---|
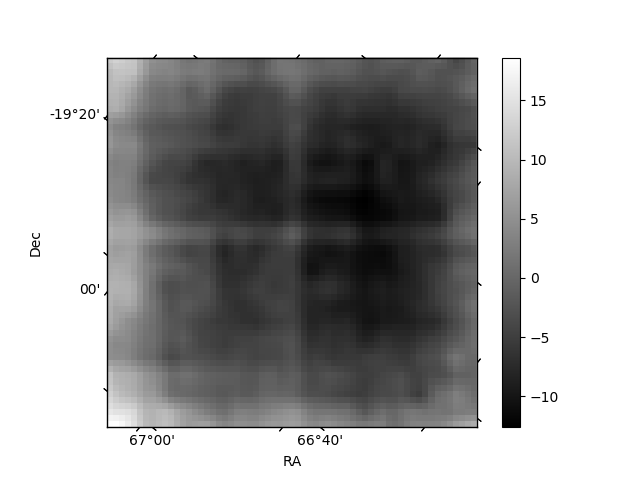
| Quadrant D | 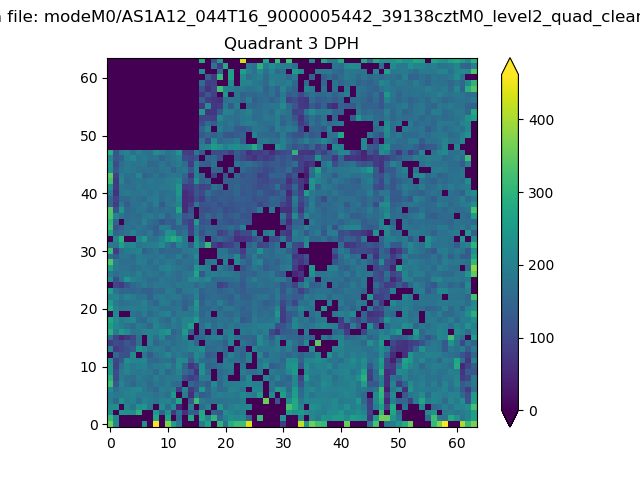 |
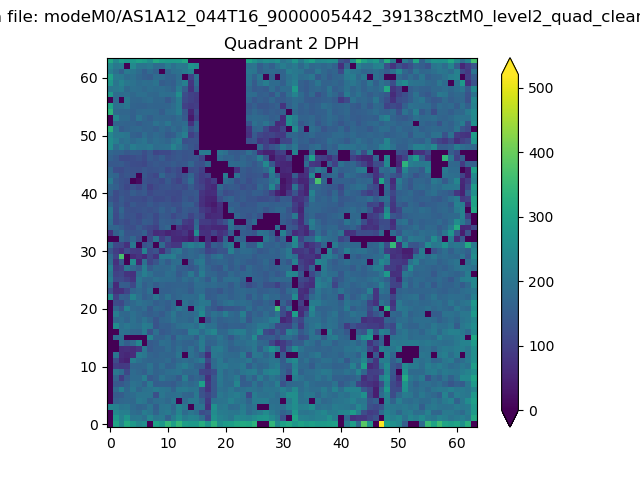 |
Quadrant C |
| Plot type | Count rate plots | Images |
|---|---|---|
| Comparison with Poisson distribution Blue bars denote a histogram of data divided into 1 sec bins. Red curve is a Poisson curve with rate = median count rate of data. |
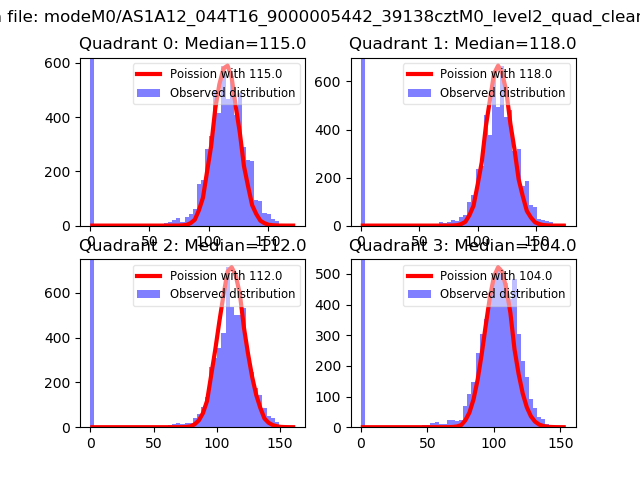 |
 |
| Quadrant-wise count rates Data is divided into 100 sec bins |
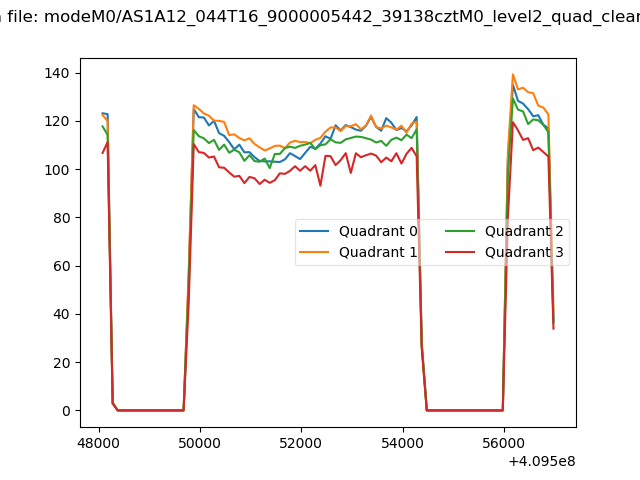 |
|
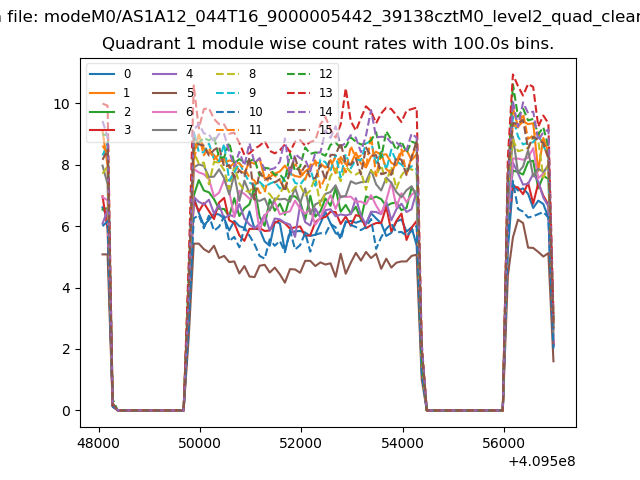
| Module-wise count rates for Quadrant A Data is divided into 100 sec bins |
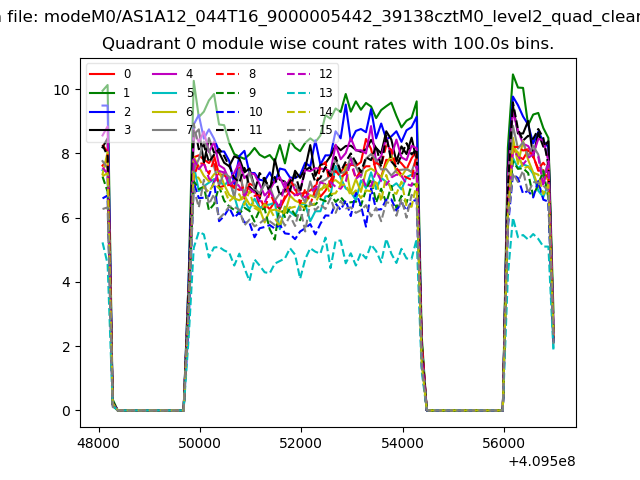 |
 |
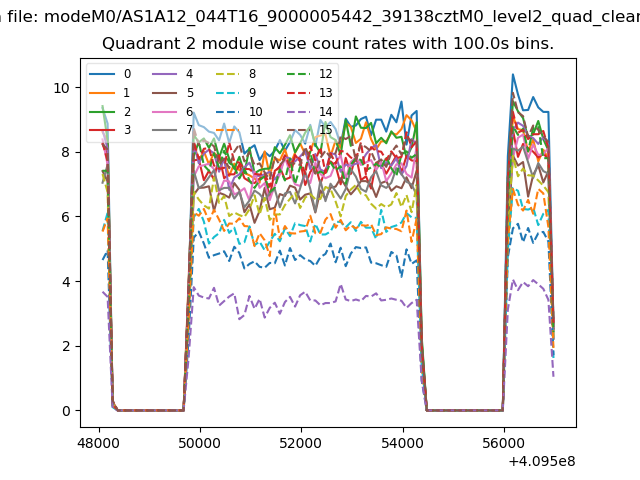
| Module-wise count rates for Quadrant B Data is divided into 100 sec bins |
 |
 |
| Module-wise count rates for Quadrant C Data is divided into 100 sec bins |
 |
 |
| Module-wise count rates for Quadrant D Data is divided into 100 sec bins |
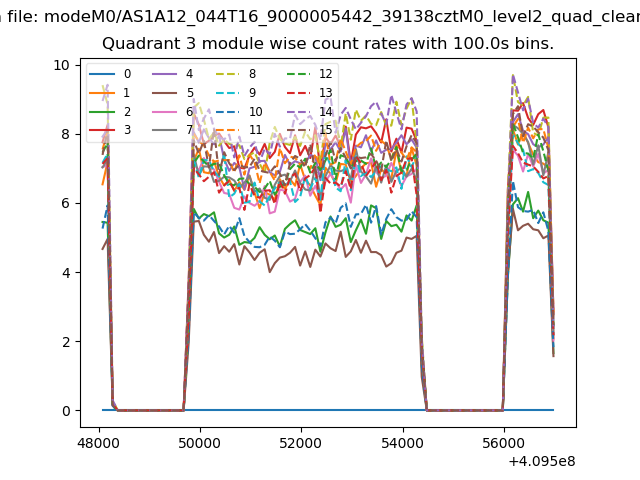 |
 |
| Parameter | Plot |
|---|---|
| CZT HV Monitor |  |
| D_VDD | 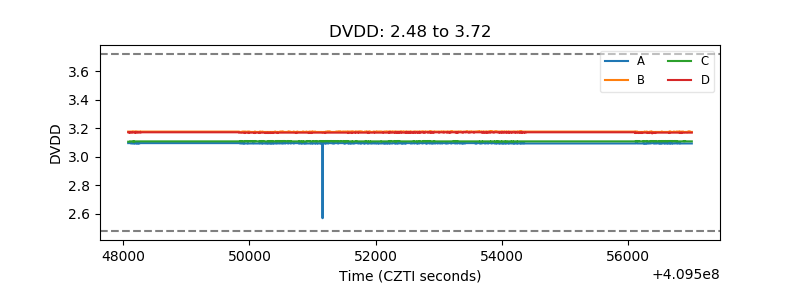 |
| Temperature 1 | 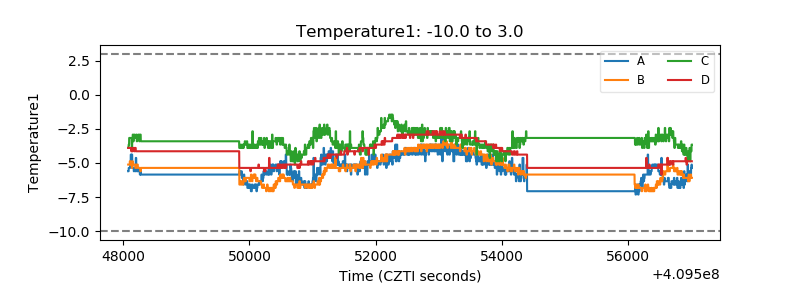 |
| Veto HV Monitor | 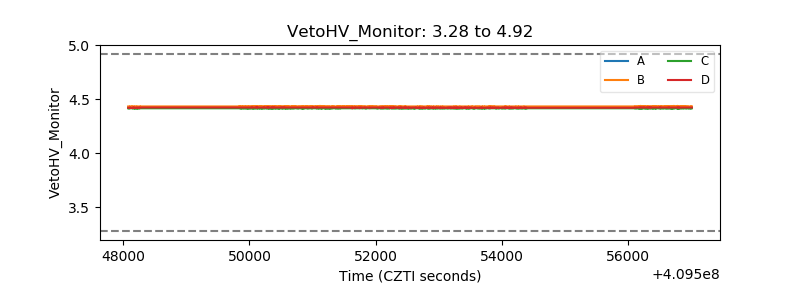 |
| Veto LLD | 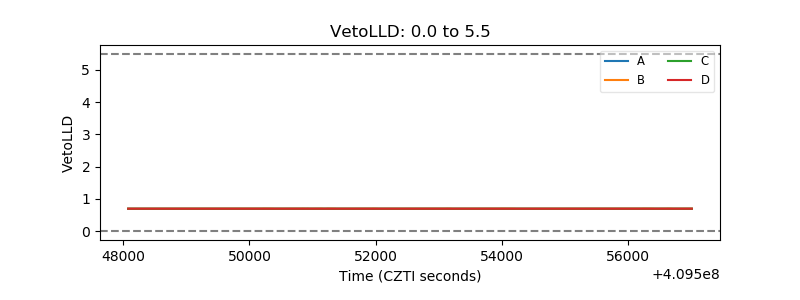 |
| Alpha Counter | 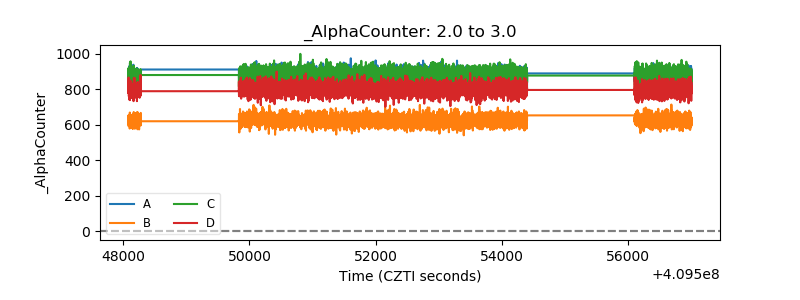 |
| _CPM_Rate | 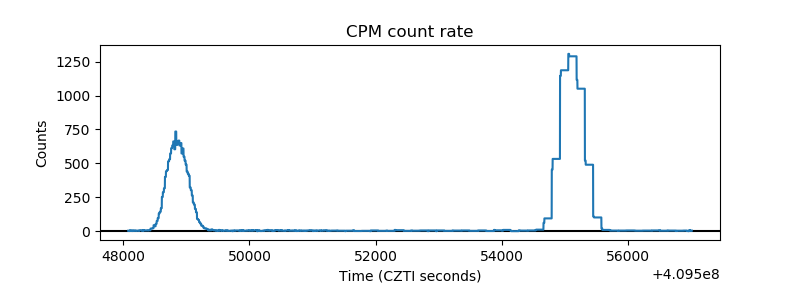 |
| CZT Counter | 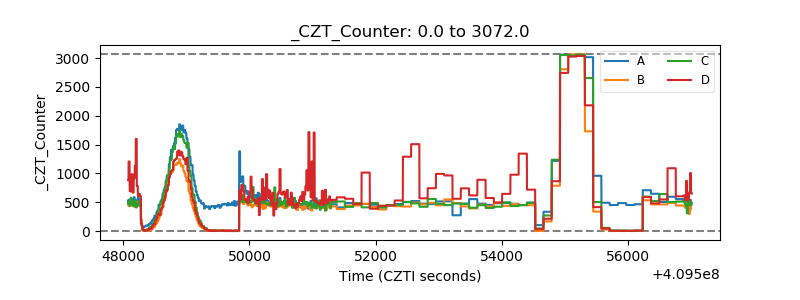 |
| +2.5 Volts monitor | 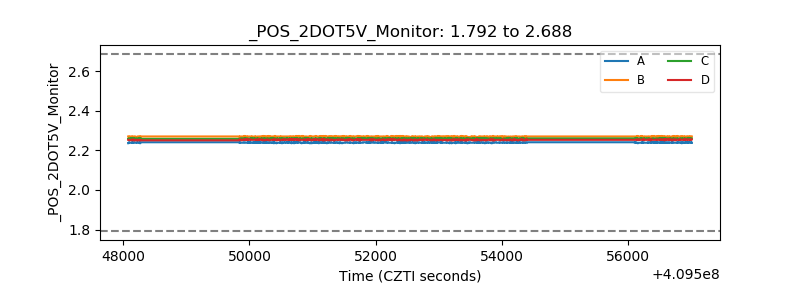 |
| +5 Volts monitor | 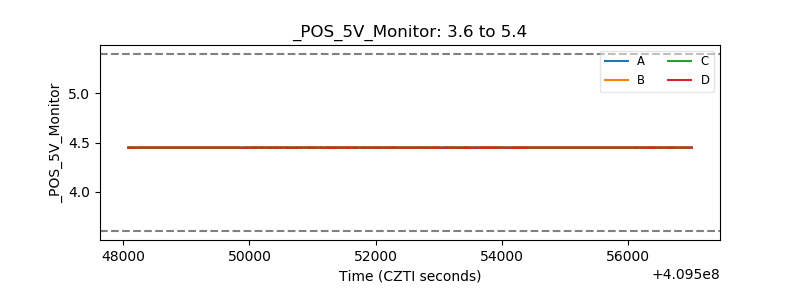 |
| _ROLL_ROT | 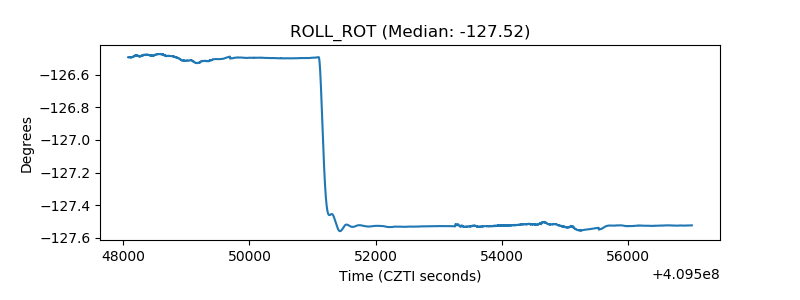 |
| _Roll_DEC | 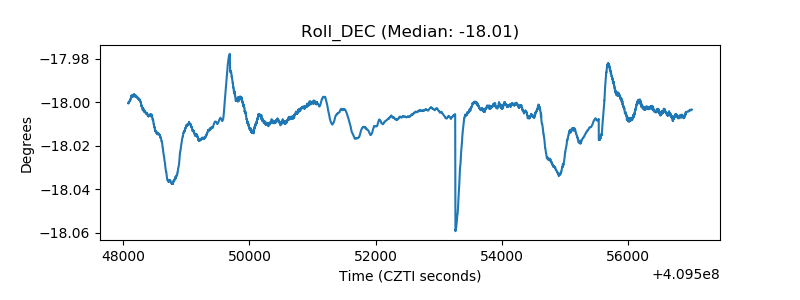 |
| _Roll_RA | 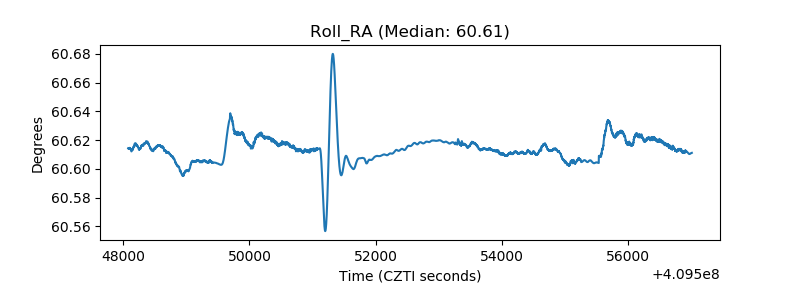 |
| Veto Counter | 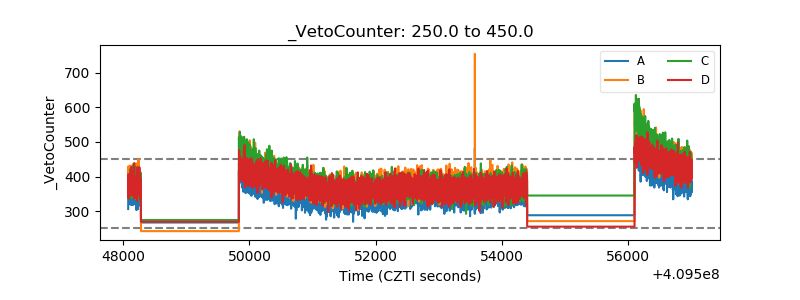 |