| Param | Original file | Final file |
|---|---|---|
| Filename | modeM0/AS1A12_044T16_9000005442_39140cztM0_level2.fits | modeM0/AS1A12_044T16_9000005442_39140cztM0_level2_quad_clean.evt |
| Size (bytes) | 344,871,360 | 92,580,480 |
| Size | 328.9 MB | 88.3 MB |
| Events in quadrant A | 2,810,914 | 627,463 |
| Events in quadrant B | 2,441,421 | 646,037 |
| Events in quadrant C | 2,578,967 | 615,501 |
| Events in quadrant D | 4,531,363 | 551,523 |
| Mode M0 | |||
|---|---|---|---|
| Quadrant | BADHDUFLAG | Total packets | Discarded packets |
| A | 0 | 11435 | 3 |
| B | 0 | 10556 | 2 |
| C | 0 | 10692 | 2 |
| D | 0 | 17061 | 2 |
| Mode M9 | |||
|---|---|---|---|
| Quadrant | BADHDUFLAG | Total packets | Discarded packets |
| A | 0 | 24 | 0 |
| B | 0 | 24 | 0 |
| C | 0 | 24 | 0 |
| D | 0 | 25 | 0 |
| Mode SS | |||
|---|---|---|---|
| Quadrant | BADHDUFLAG | Total packets | Discarded packets |
| A | 0 | 106 | 0 |
| B | 0 | 106 | 0 |
| C | 0 | 106 | 0 |
| D | 0 | 106 | 0 |
| Quadrant | Total seconds | Saturated seconds | Saturation percentage |
|---|---|---|---|
| A | 5182 | 17 | 0.328059% |
| B | 5182 | 15 | 0.289464% |
| C | 5182 | 6 | 0.115785% |
| D | 5182 | 230 | 4.438441% |
Noise dominated data is calculated using 1-second bins in cleaned event files. If a bin has >2000 counts, and if more than 50% of those come from <1% of pixels, then it is considered to be noise-dominated and hence unusable.
| Quadrant | # 1 sec bins | Bins with >0 counts | Bins with >2000 counts | High rate bins dominated by noise | Noise dominated (total time) | Noise dominated (detector-on time) | Marked lightcurve |
|---|---|---|---|---|---|---|---|
| A | 7005 | 5183 | 7 | 7 | 0.10% | 0.14% | 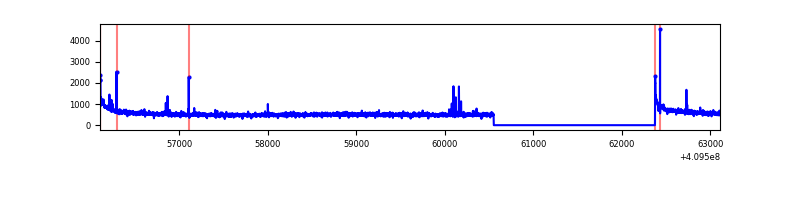 |
| B | 7005 | 5183 | 9 | 9 | 0.13% | 0.17% | 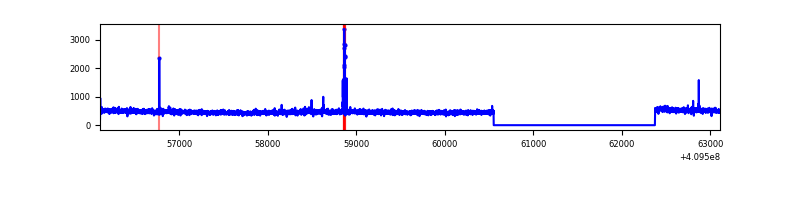 |
| C | 7005 | 5183 | 0 | 0 | 0.00% | 0.00% | 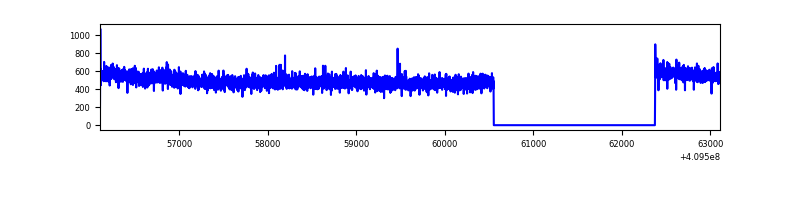 |
| D | 7005 | 5183 | 198 | 198 | 2.83% | 3.82% | 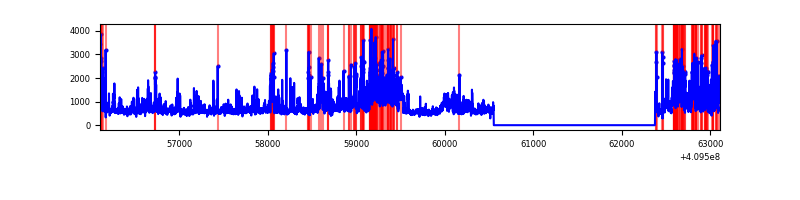 |
Top three noisy pixels from each quadrant. If the there are fewer than three noisy pixels in the level2.evt file, extra rows are filled as -1
| Pixel properties | Quadrant properties | ||||||
|---|---|---|---|---|---|---|---|
| Quadrant | DetID | PixID | Counts | Sigma | Mean | Median | Sigma |
| A | 10 | 83 | 395856 | 3179.31 | 612 | 602 | 124.3 |
| A | 9 | 143 | 40953 | 324.57 | 612 | 602 | 124.3 |
| A | 13 | 254 | 6646 | 48.62 | 612 | 602 | 124.3 |
| B | 5 | 172 | 46249 | 390.92 | 608 | 592 | 116.8 |
| B | 12 | 111 | 14919 | 122.67 | 608 | 592 | 116.8 |
| B | 11 | 111 | 13684 | 112.1 | 608 | 592 | 116.8 |
| C | 15 | 214 | 218448 | 1560.87 | 598 | 604 | 139.6 |
| C | 9 | 187 | 19764 | 137.28 | 598 | 604 | 139.6 |
| C | 13 | 61 | 3966 | 24.09 | 598 | 604 | 139.6 |
| D | 12 | 235 | 1068673 | 7594.07 | 586 | 570 | 140.6 |
| D | 5 | 222 | 412305 | 2927.38 | 586 | 570 | 140.6 |
| D | 2 | 120 | 337731 | 2397.17 | 586 | 570 | 140.6 |
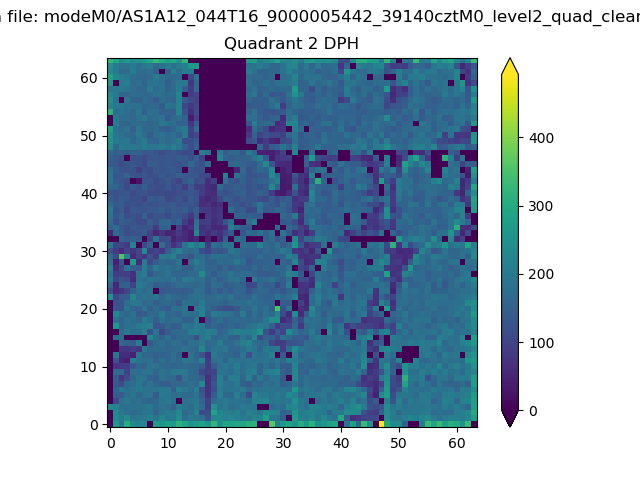
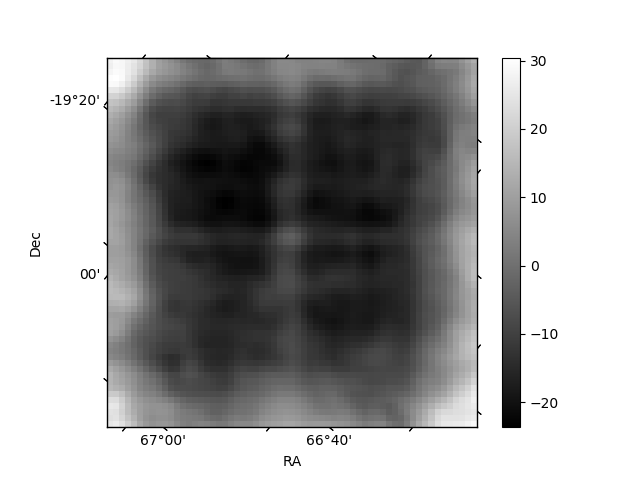
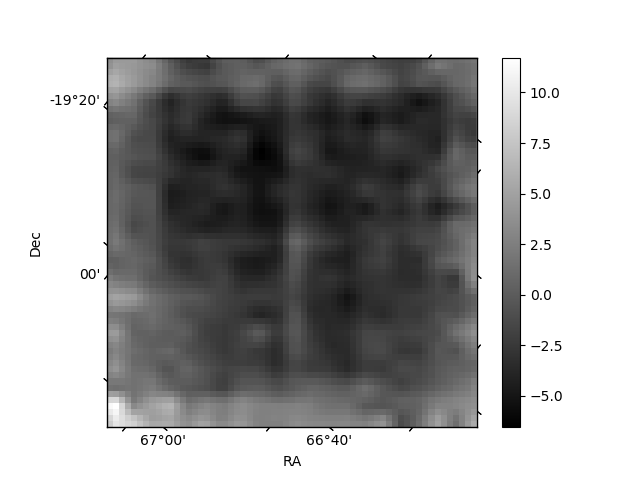
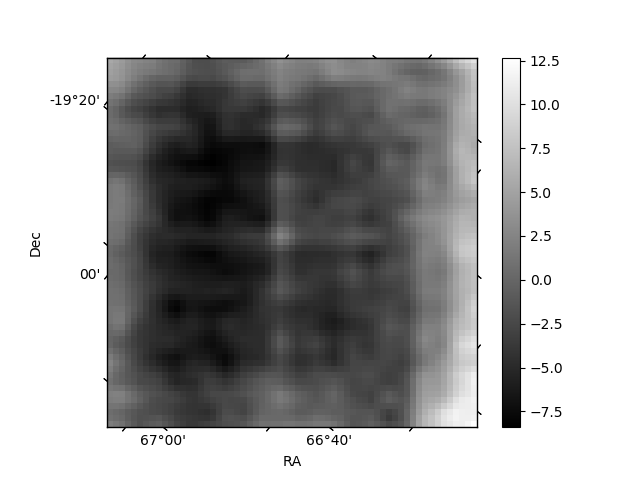
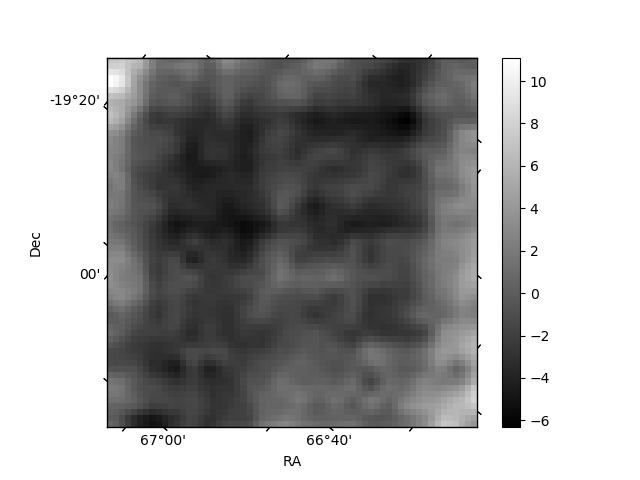
Histogram calculated using DETX and DETY for each event in the final _common_clean file
| Quadrant A | 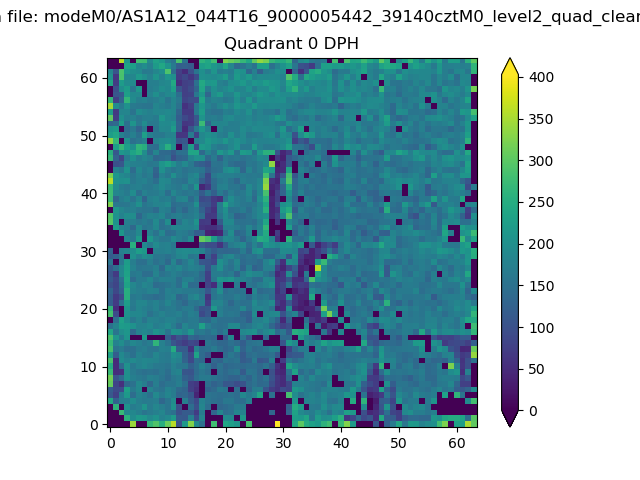 |
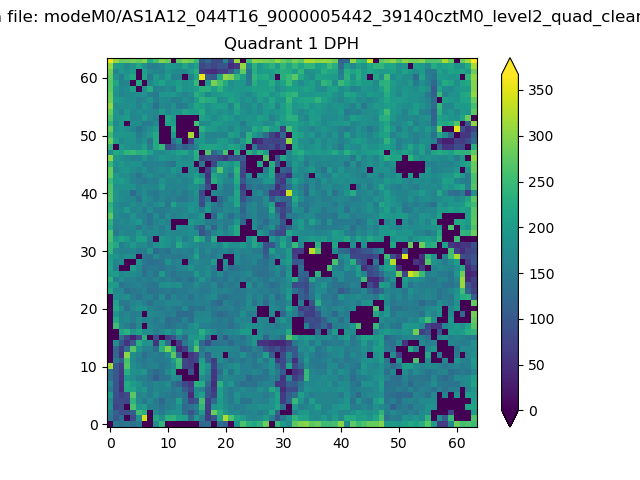 |
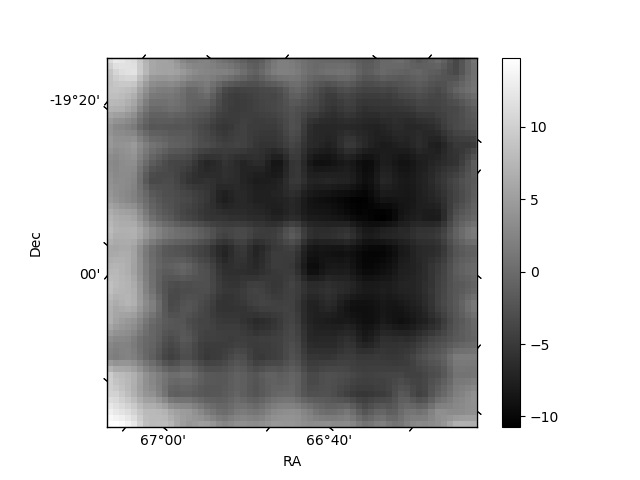
Quadrant B |
|---|---|---|---|
| Quadrant D | 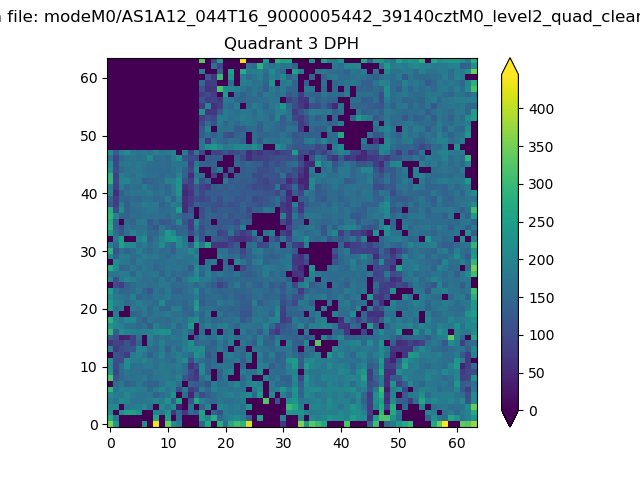 |
 |
Quadrant C |
| Plot type | Count rate plots | Images |
|---|---|---|
| Comparison with Poisson distribution Blue bars denote a histogram of data divided into 1 sec bins. Red curve is a Poisson curve with rate = median count rate of data. |
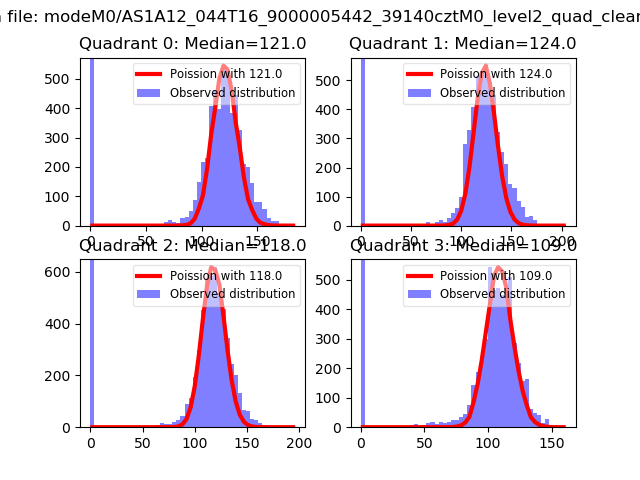 |
 |
| Quadrant-wise count rates Data is divided into 100 sec bins |
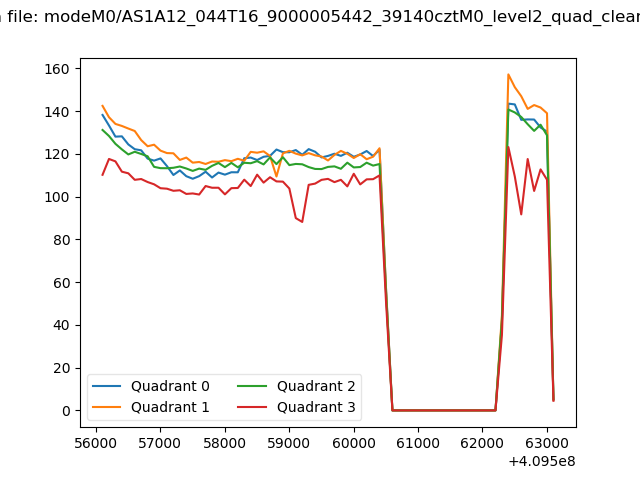 |
|
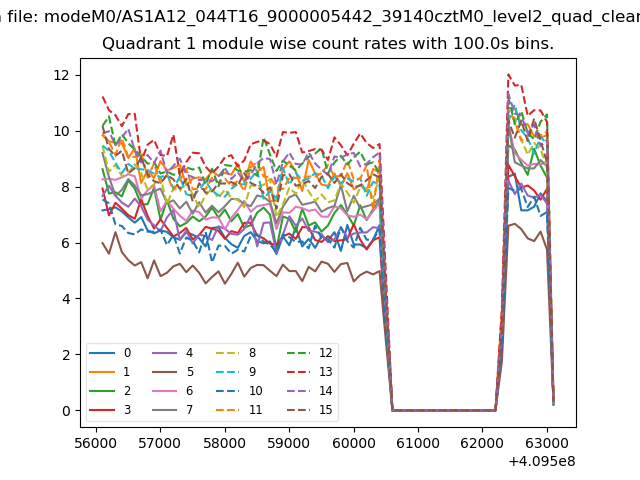
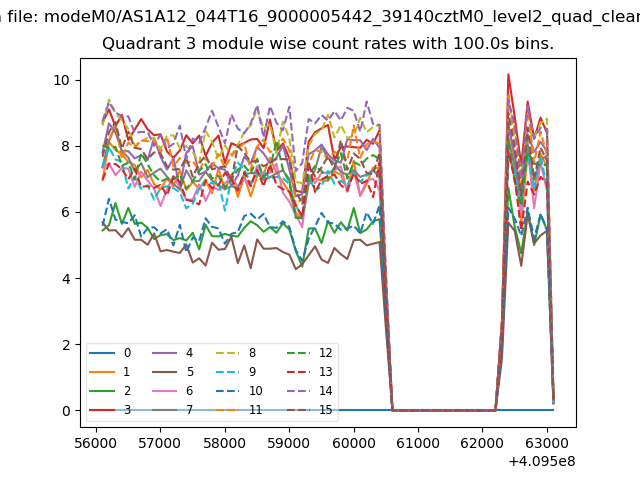
| Module-wise count rates for Quadrant A Data is divided into 100 sec bins |
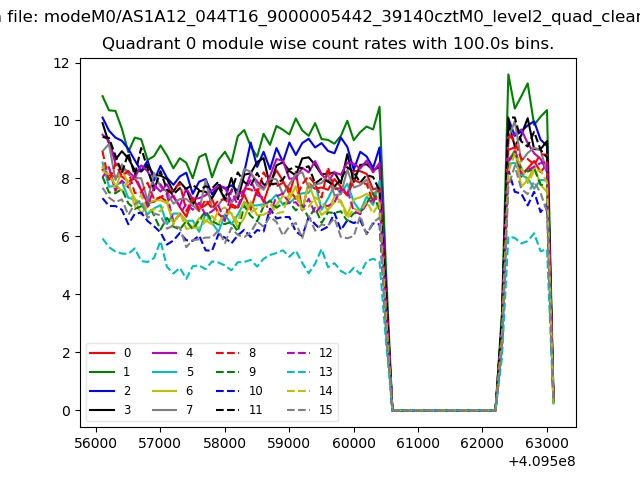 |
 |
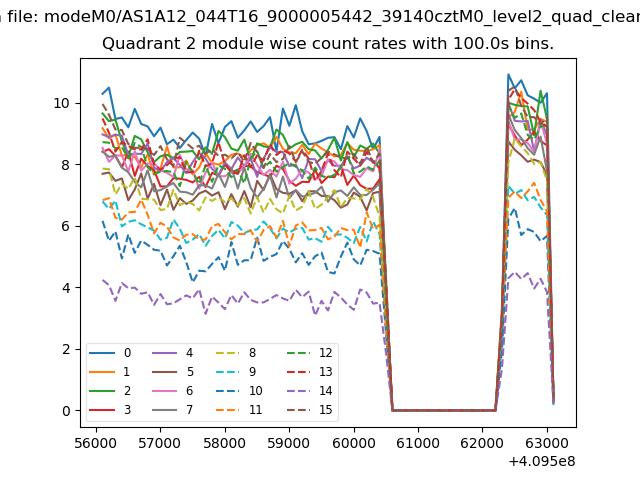
| Module-wise count rates for Quadrant B Data is divided into 100 sec bins |
 |
 |
| Module-wise count rates for Quadrant C Data is divided into 100 sec bins |
 |
 |
| Module-wise count rates for Quadrant D Data is divided into 100 sec bins |
 |
 |
| Parameter | Plot |
|---|---|
| CZT HV Monitor | 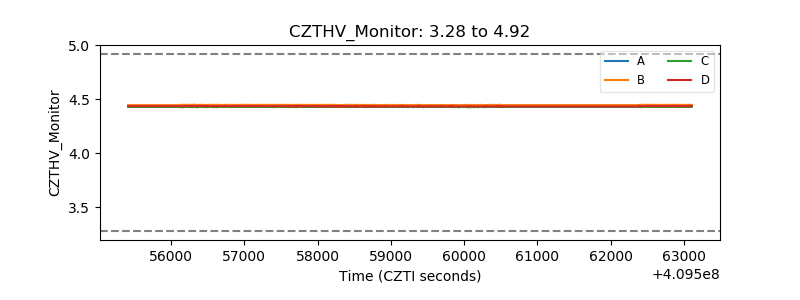 |
| D_VDD | 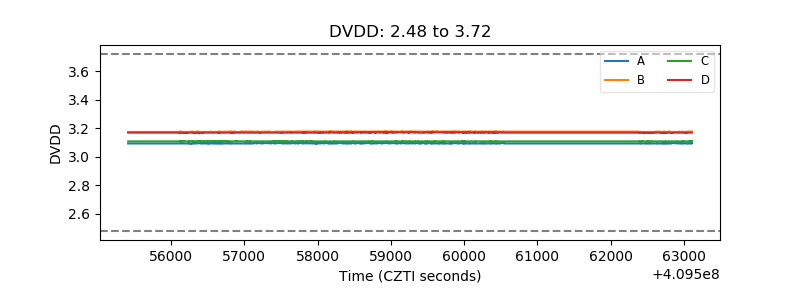 |
| Temperature 1 | 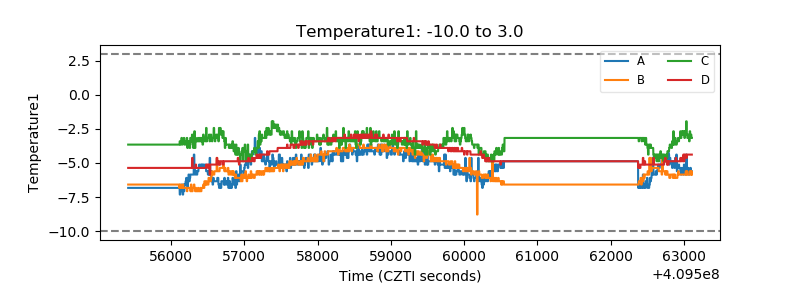 |
| Veto HV Monitor | 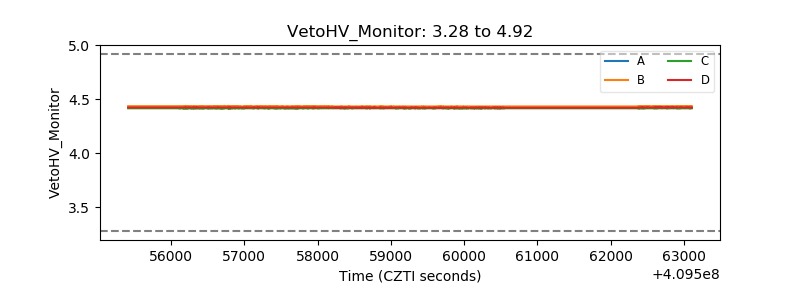 |
| Veto LLD | 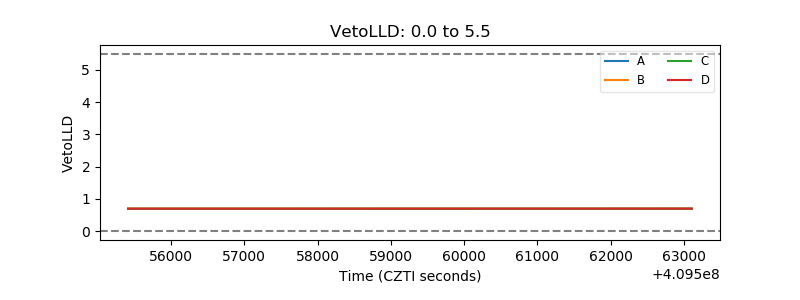 |
| Alpha Counter | 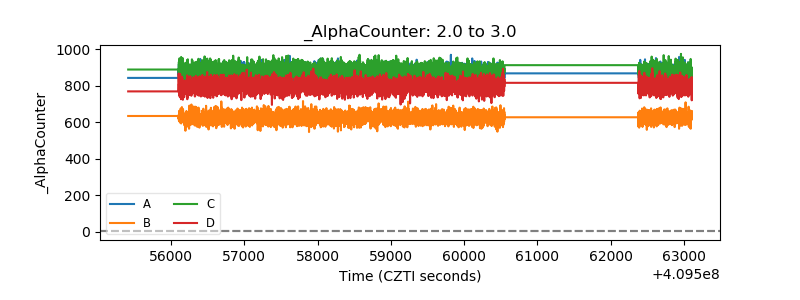 |
| _CPM_Rate | 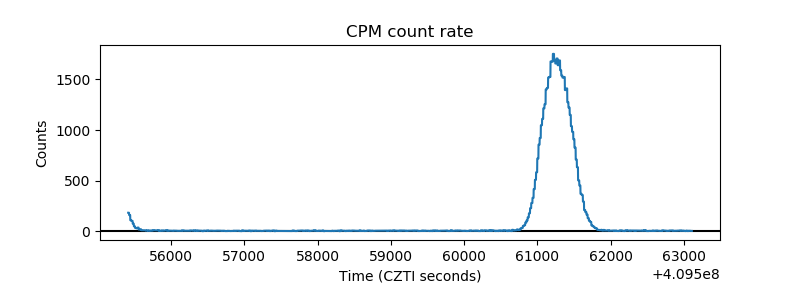 |
| CZT Counter | 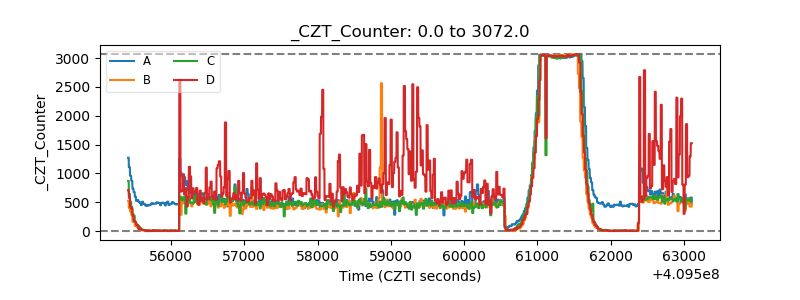 |
| +2.5 Volts monitor | 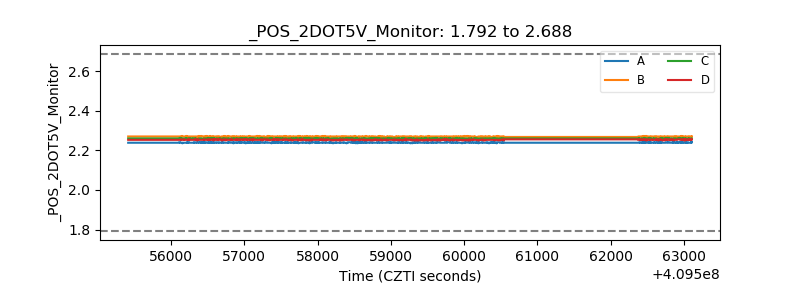 |
| +5 Volts monitor | 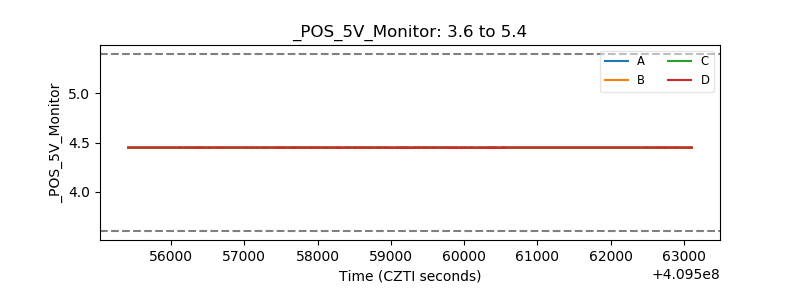 |
| _ROLL_ROT | 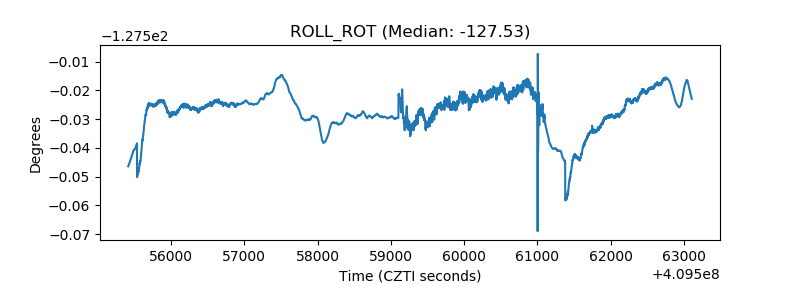 |
| _Roll_DEC | 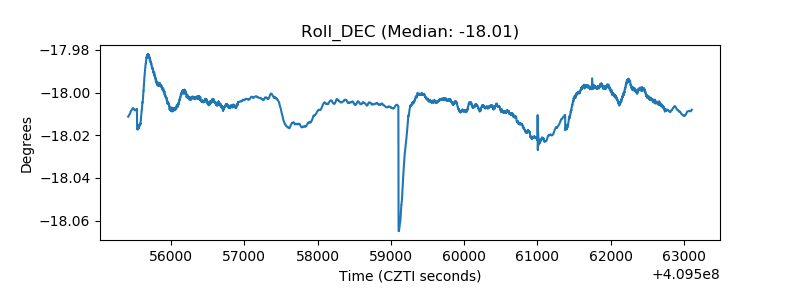 |
| _Roll_RA | 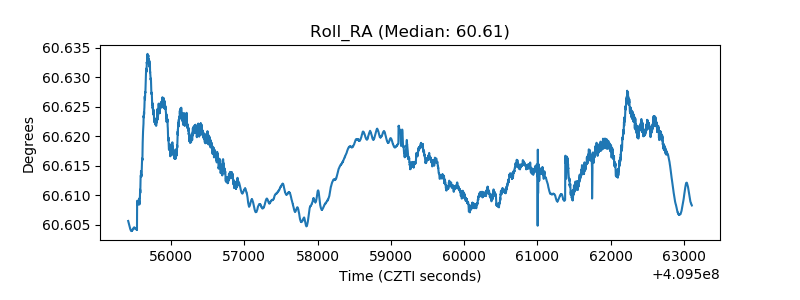 |
| Veto Counter | 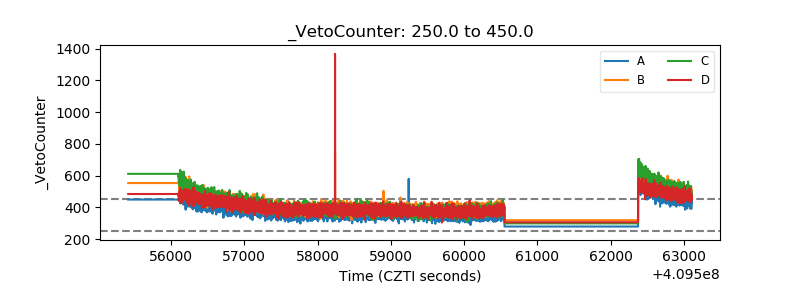 |