| Param | Original file | Final file |
|---|---|---|
| Filename | modeM0/AS1A12_044T16_9000005442_39141cztM0_level2.fits | modeM0/AS1A12_044T16_9000005442_39141cztM0_level2_quad_clean.evt |
| Size (bytes) | 372,723,840 | 96,719,040 |
| Size | 355.5 MB | 92.2 MB |
| Events in quadrant A | 2,921,734 | 660,549 |
| Events in quadrant B | 2,493,775 | 685,933 |
| Events in quadrant C | 2,643,820 | 648,815 |
| Events in quadrant D | 5,336,287 | 572,284 |
| Mode M0 | |||
|---|---|---|---|
| Quadrant | BADHDUFLAG | Total packets | Discarded packets |
| A | 0 | 11806 | 3 |
| B | 0 | 10488 | 2 |
| C | 0 | 10882 | 2 |
| D | 0 | 19462 | 2 |
| Mode M9 | |||
|---|---|---|---|
| Quadrant | BADHDUFLAG | Total packets | Discarded packets |
| A | 0 | 33 | 0 |
| B | 0 | 33 | 0 |
| C | 0 | 33 | 0 |
| D | 0 | 34 | 0 |
| Mode SS | |||
|---|---|---|---|
| Quadrant | BADHDUFLAG | Total packets | Discarded packets |
| A | 0 | 104 | 0 |
| B | 0 | 104 | 0 |
| C | 0 | 104 | 0 |
| D | 0 | 104 | 0 |
| Quadrant | Total seconds | Saturated seconds | Saturation percentage |
|---|---|---|---|
| A | 5162 | 26 | 0.503681% |
| B | 5162 | 10 | 0.193723% |
| C | 5162 | 4 | 0.077489% |
| D | 5162 | 389 | 7.535839% |
Noise dominated data is calculated using 1-second bins in cleaned event files. If a bin has >2000 counts, and if more than 50% of those come from <1% of pixels, then it is considered to be noise-dominated and hence unusable.
| Quadrant | # 1 sec bins | Bins with >0 counts | Bins with >2000 counts | High rate bins dominated by noise | Noise dominated (total time) | Noise dominated (detector-on time) | Marked lightcurve |
|---|---|---|---|---|---|---|---|
| A | 7106 | 5163 | 9 | 9 | 0.13% | 0.17% | 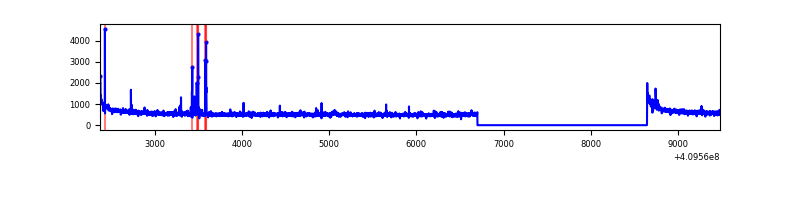 |
| B | 7106 | 5163 | 0 | 0 | 0.00% | 0.00% | 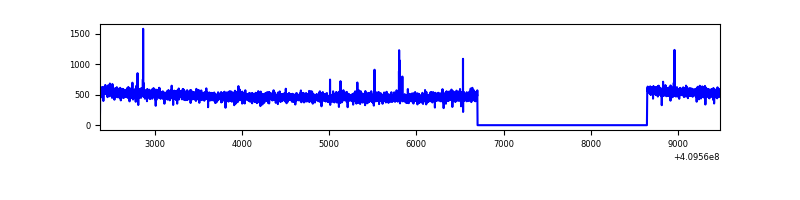 |
| C | 7106 | 5163 | 0 | 0 | 0.00% | 0.00% | 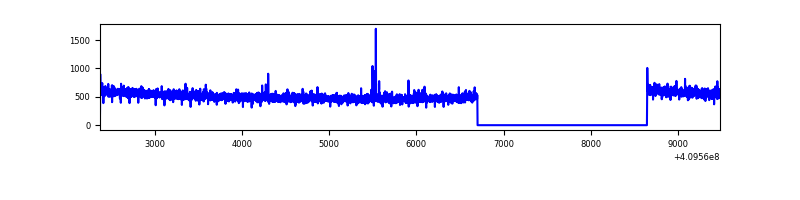 |
| D | 7106 | 5163 | 355 | 355 | 5.00% | 6.88% | 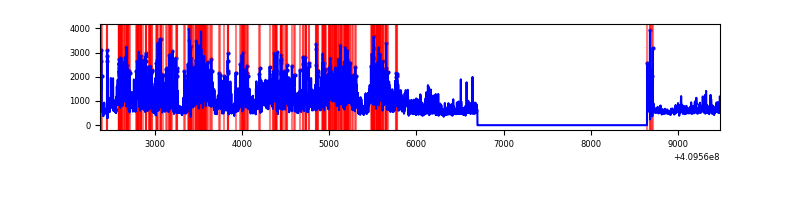 |
Top three noisy pixels from each quadrant. If the there are fewer than three noisy pixels in the level2.evt file, extra rows are filled as -1
| Pixel properties | Quadrant properties | ||||||
|---|---|---|---|---|---|---|---|
| Quadrant | DetID | PixID | Counts | Sigma | Mean | Median | Sigma |
| A | 10 | 83 | 390753 | 3054.25 | 632 | 622 | 127.7 |
| A | 9 | 143 | 65858 | 510.71 | 632 | 622 | 127.7 |
| A | 15 | 223 | 11313 | 83.69 | 632 | 622 | 127.7 |
| B | 12 | 111 | 15006 | 119.6 | 630 | 613 | 120.3 |
| B | 11 | 111 | 14019 | 111.4 | 630 | 613 | 120.3 |
| B | 14 | 111 | 13636 | 108.22 | 630 | 613 | 120.3 |
| C | 15 | 214 | 219910 | 1534.72 | 616 | 620 | 142.9 |
| C | 9 | 187 | 16034 | 107.88 | 616 | 620 | 142.9 |
| C | 13 | 61 | 4108 | 24.41 | 616 | 620 | 142.9 |
| D | 12 | 235 | 1499929 | 10487.72 | 600 | 584 | 143.0 |
| D | 2 | 120 | 1266333 | 8853.75 | 600 | 584 | 143.0 |
| D | 2 | 249 | 116306 | 809.46 | 600 | 584 | 143.0 |
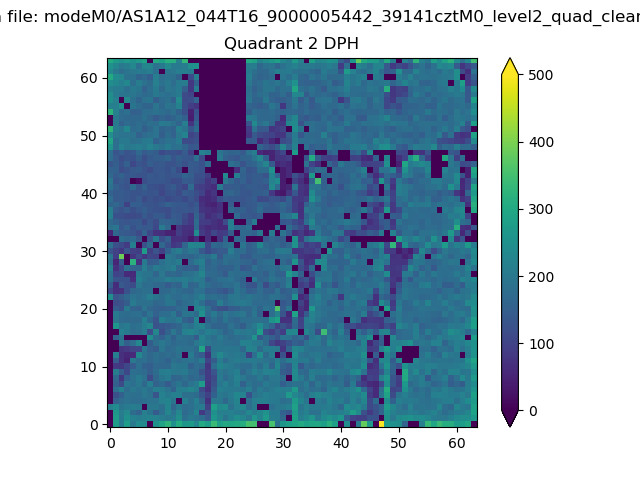
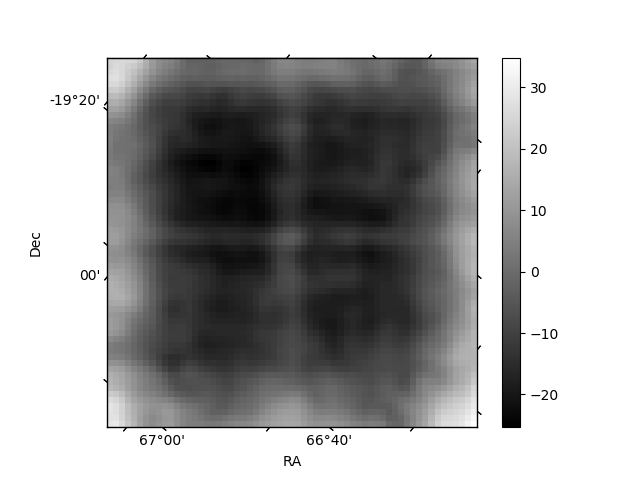
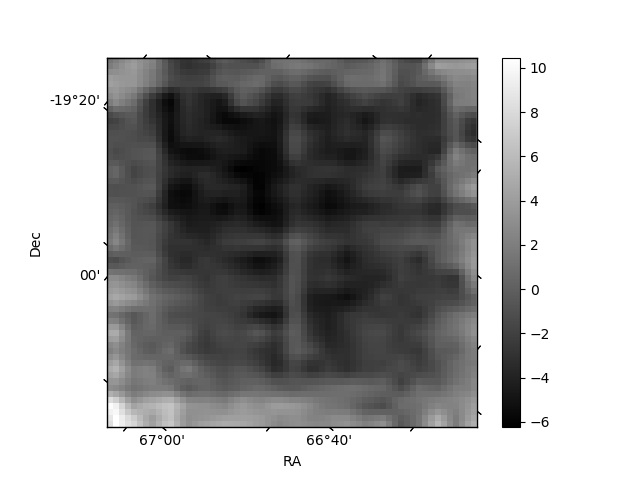
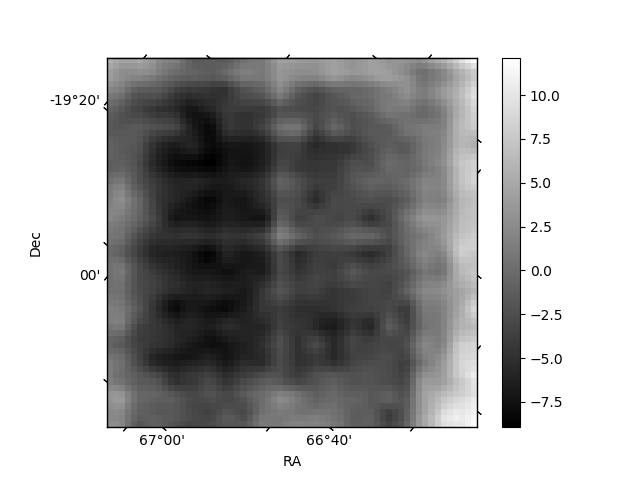
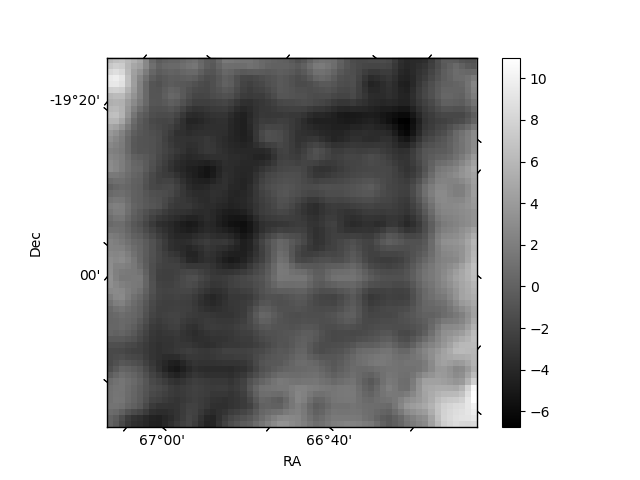
Histogram calculated using DETX and DETY for each event in the final _common_clean file
| Quadrant A | 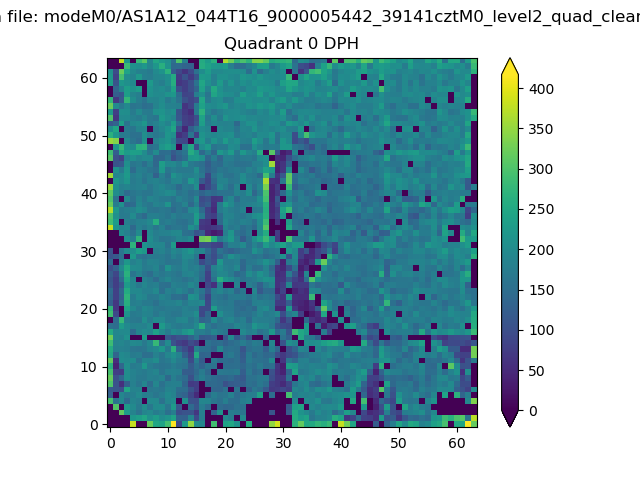 |
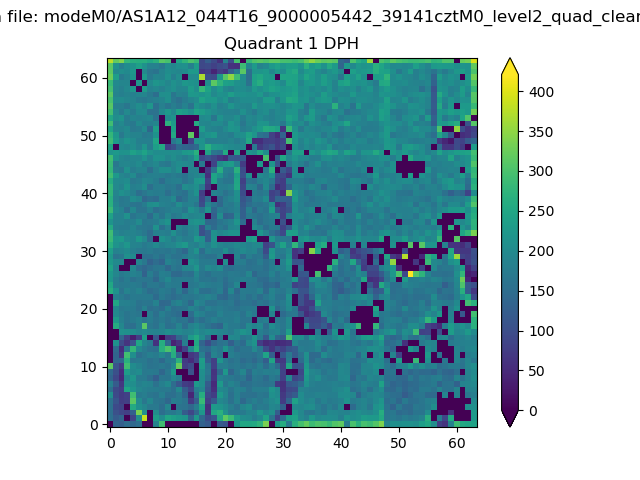 |
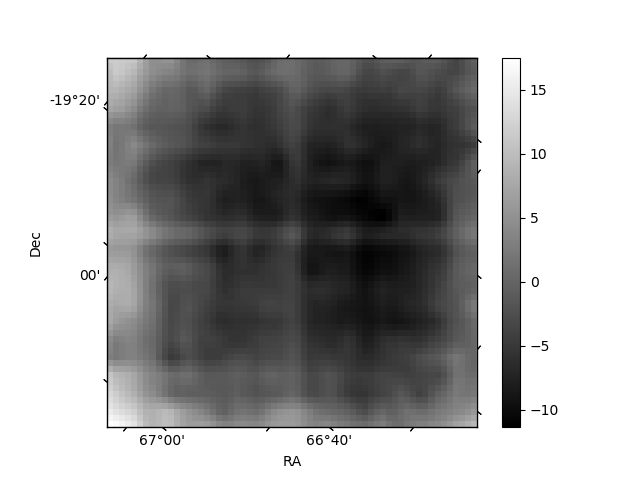
Quadrant B |
|---|---|---|---|
| Quadrant D | 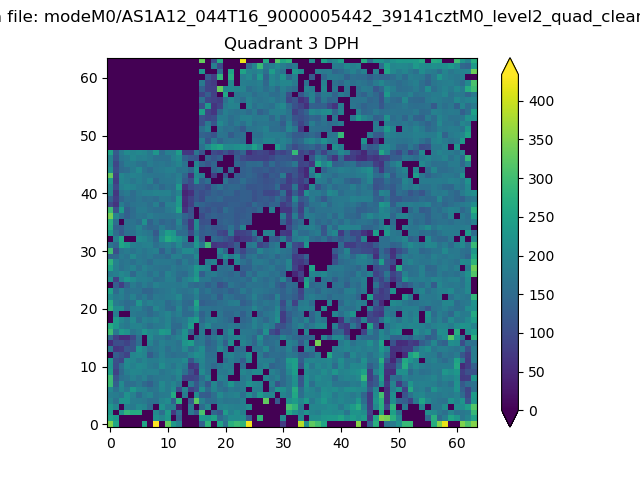 |
 |
Quadrant C |
| Plot type | Count rate plots | Images |
|---|---|---|
| Comparison with Poisson distribution Blue bars denote a histogram of data divided into 1 sec bins. Red curve is a Poisson curve with rate = median count rate of data. |
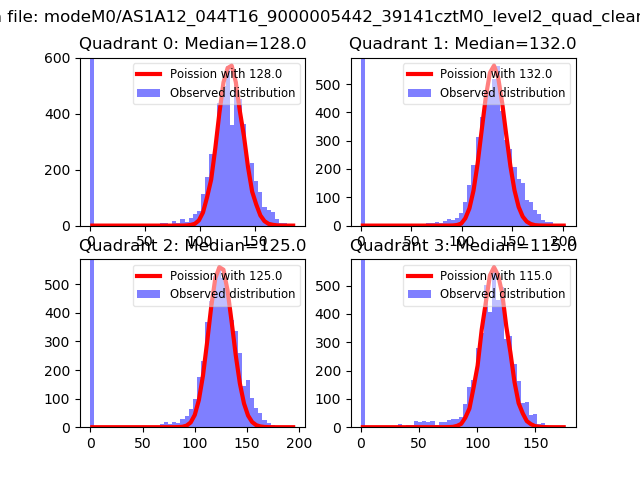 |
 |
| Quadrant-wise count rates Data is divided into 100 sec bins |
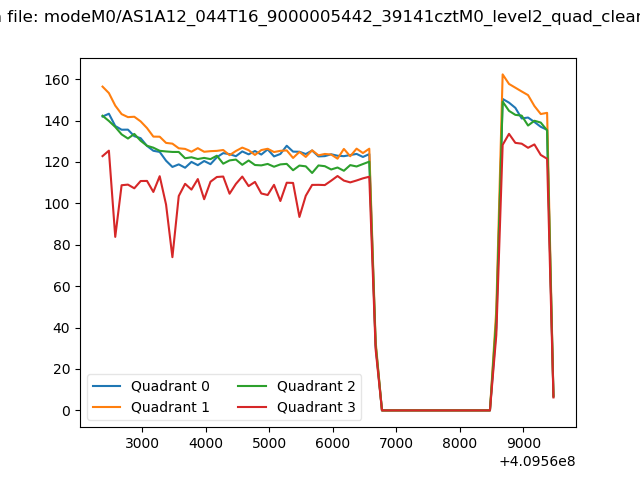 |
|
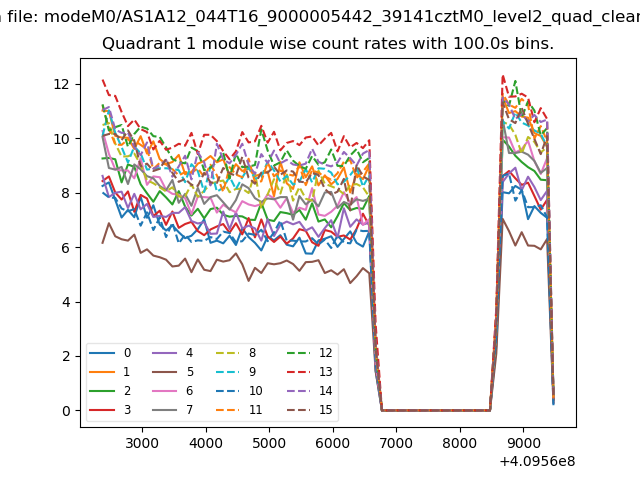
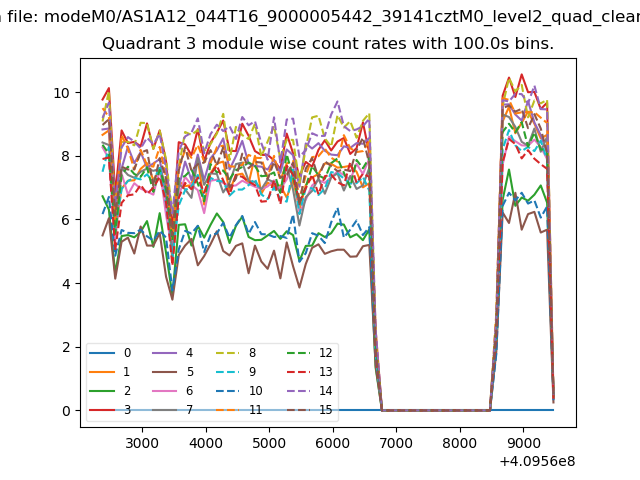
| Module-wise count rates for Quadrant A Data is divided into 100 sec bins |
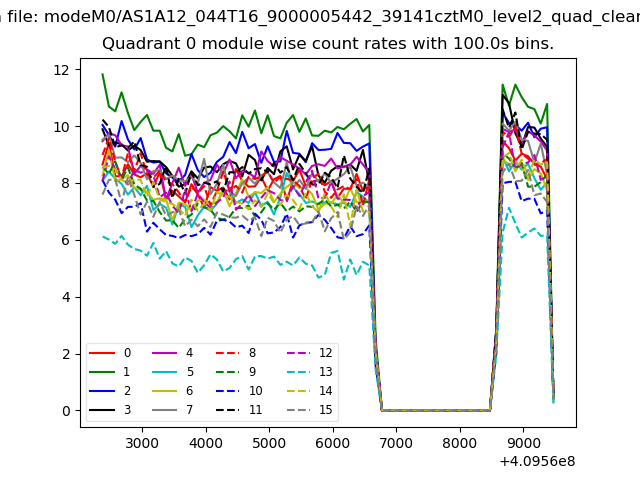 |
 |
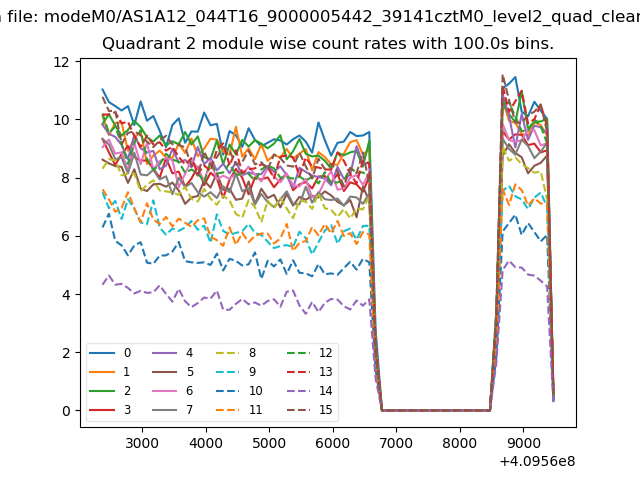
| Module-wise count rates for Quadrant B Data is divided into 100 sec bins |
 |
 |
| Module-wise count rates for Quadrant C Data is divided into 100 sec bins |
 |
 |
| Module-wise count rates for Quadrant D Data is divided into 100 sec bins |
 |
 |
| Parameter | Plot |
|---|---|
| CZT HV Monitor | 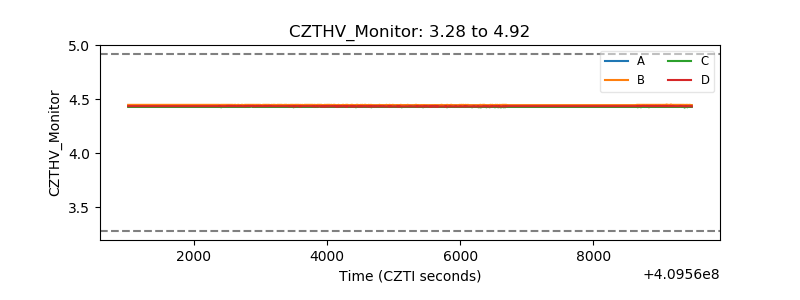 |
| D_VDD |  |
| Temperature 1 | 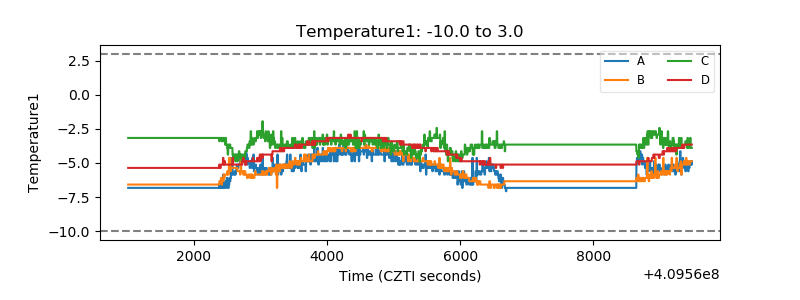 |
| Veto HV Monitor | 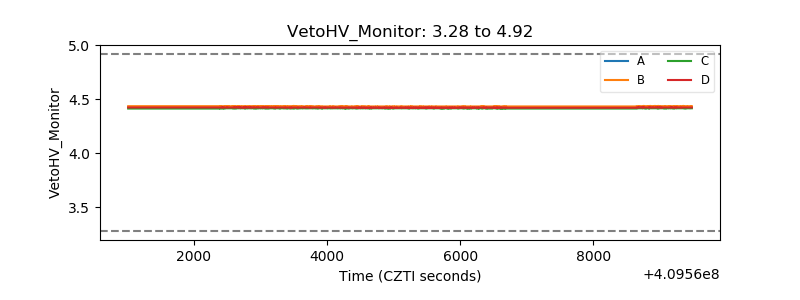 |
| Veto LLD | 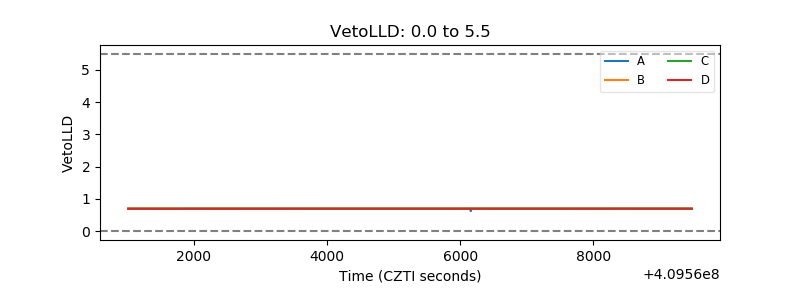 |
| Alpha Counter | 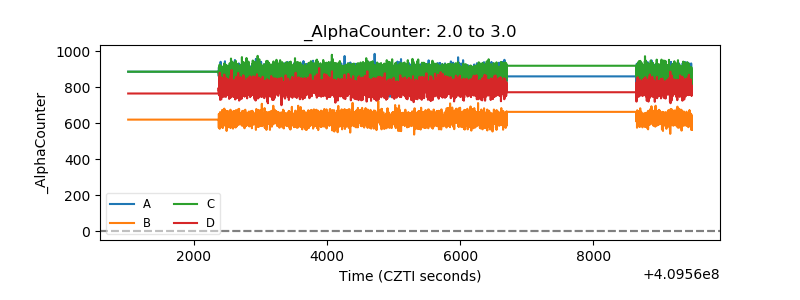 |
| _CPM_Rate | 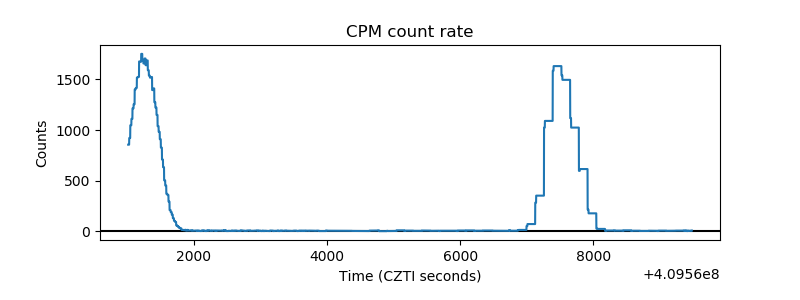 |
| CZT Counter | 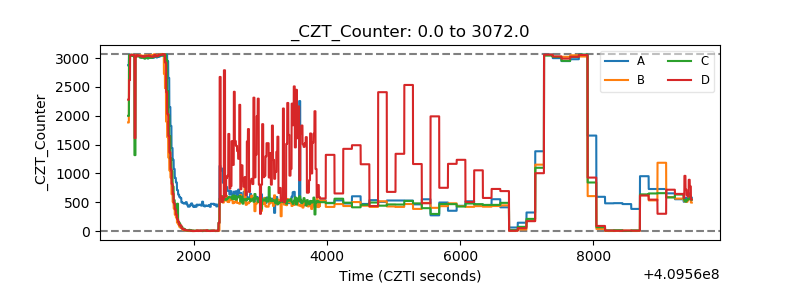 |
| +2.5 Volts monitor |  |
| +5 Volts monitor | 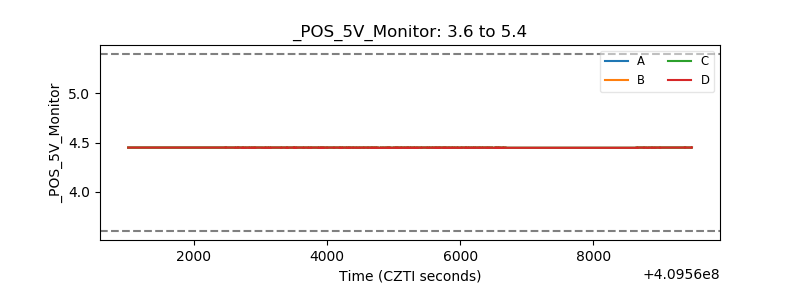 |
| _ROLL_ROT | 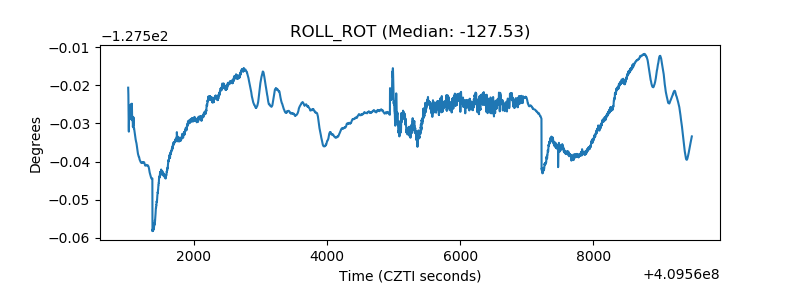 |
| _Roll_DEC | 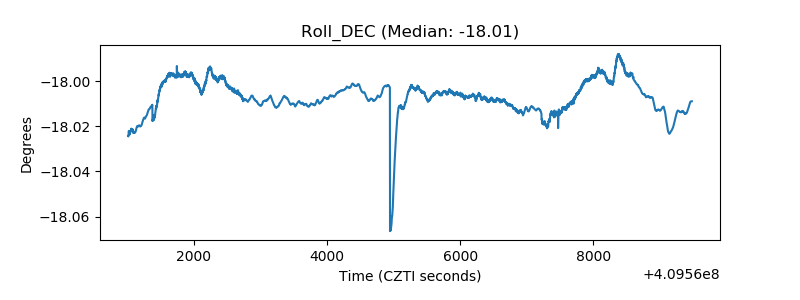 |
| _Roll_RA | 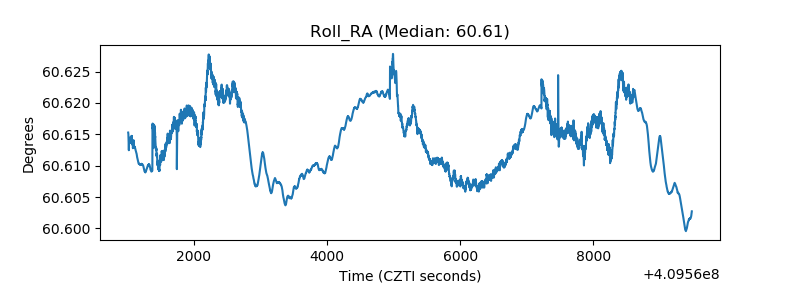 |
| Veto Counter | 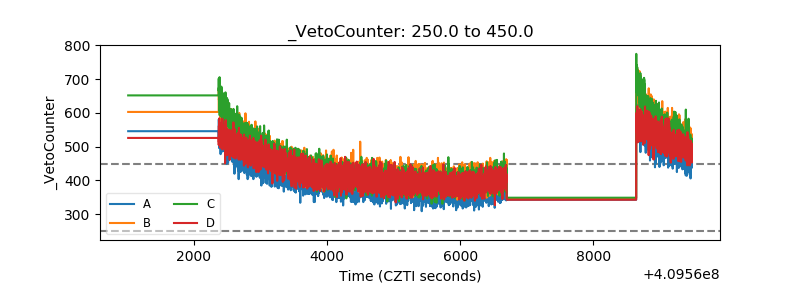 |