| Param | Original file | Final file |
|---|---|---|
| Filename | modeM0/AS1A12_044T16_9000005442_39142cztM0_level2.fits | modeM0/AS1A12_044T16_9000005442_39142cztM0_level2_quad_clean.evt |
| Size (bytes) | 340,246,080 | 97,750,080 |
| Size | 324.5 MB | 93.2 MB |
| Events in quadrant A | 2,898,290 | 668,885 |
| Events in quadrant B | 2,462,216 | 693,178 |
| Events in quadrant C | 2,620,698 | 651,905 |
| Events in quadrant D | 4,222,399 | 594,001 |
| Mode M0 | |||
|---|---|---|---|
| Quadrant | BADHDUFLAG | Total packets | Discarded packets |
| A | 0 | 11670 | 3 |
| B | 0 | 10263 | 2 |
| C | 0 | 10737 | 2 |
| D | 0 | 16263 | 2 |
| Mode M9 | |||
|---|---|---|---|
| Quadrant | BADHDUFLAG | Total packets | Discarded packets |
| A | 0 | 32 | 0 |
| B | 0 | 32 | 0 |
| C | 0 | 32 | 0 |
| D | 0 | 33 | 0 |
| Mode SS | |||
|---|---|---|---|
| Quadrant | BADHDUFLAG | Total packets | Discarded packets |
| A | 0 | 102 | 0 |
| B | 0 | 102 | 0 |
| C | 0 | 102 | 0 |
| D | 0 | 102 | 0 |
| Quadrant | Total seconds | Saturated seconds | Saturation percentage |
|---|---|---|---|
| A | 5027 | 12 | 0.238711% |
| B | 5027 | 9 | 0.179033% |
| C | 5027 | 3 | 0.059678% |
| D | 5027 | 121 | 2.407002% |
Noise dominated data is calculated using 1-second bins in cleaned event files. If a bin has >2000 counts, and if more than 50% of those come from <1% of pixels, then it is considered to be noise-dominated and hence unusable.
| Quadrant | # 1 sec bins | Bins with >0 counts | Bins with >2000 counts | High rate bins dominated by noise | Noise dominated (total time) | Noise dominated (detector-on time) | Marked lightcurve |
|---|---|---|---|---|---|---|---|
| A | 7090 | 5028 | 2 | 2 | 0.03% | 0.04% | 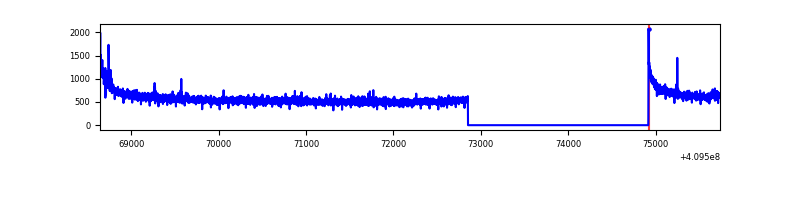 |
| B | 7090 | 5028 | 0 | 0 | 0.00% | 0.00% | 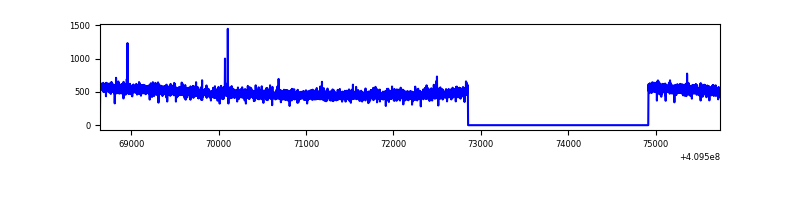 |
| C | 7090 | 5028 | 1 | 1 | 0.01% | 0.02% | 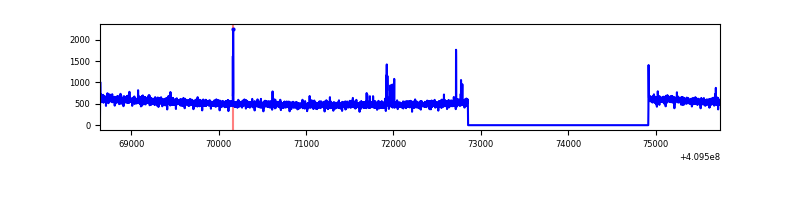 |
| D | 7090 | 5028 | 115 | 115 | 1.62% | 2.29% | 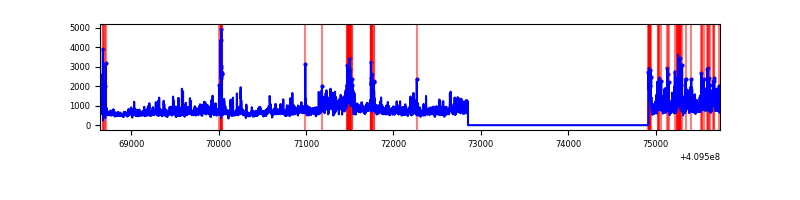 |
Top three noisy pixels from each quadrant. If the there are fewer than three noisy pixels in the level2.evt file, extra rows are filled as -1
| Pixel properties | Quadrant properties | ||||||
|---|---|---|---|---|---|---|---|
| Quadrant | DetID | PixID | Counts | Sigma | Mean | Median | Sigma |
| A | 10 | 83 | 382086 | 3013.9 | 631 | 621 | 126.6 |
| A | 15 | 223 | 47549 | 370.77 | 631 | 621 | 126.6 |
| A | 13 | 6 | 11969 | 89.66 | 631 | 621 | 126.6 |
| B | 12 | 111 | 14839 | 119.32 | 625 | 610 | 119.2 |
| B | 11 | 111 | 13718 | 109.92 | 625 | 610 | 119.2 |
| B | 14 | 111 | 13366 | 106.97 | 625 | 610 | 119.2 |
| C | 15 | 214 | 214616 | 1521.73 | 608 | 613 | 140.6 |
| C | 9 | 187 | 19912 | 137.23 | 608 | 613 | 140.6 |
| C | 15 | 208 | 6965 | 45.17 | 608 | 613 | 140.6 |
| D | 12 | 235 | 1608347 | 11042.71 | 603 | 588 | 145.6 |
| D | 2 | 249 | 106598 | 728.12 | 603 | 588 | 145.6 |
| D | 13 | 249 | 54933 | 373.26 | 603 | 588 | 145.6 |
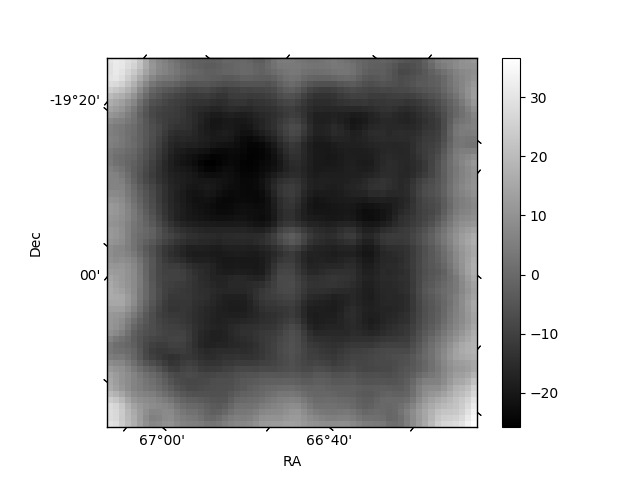
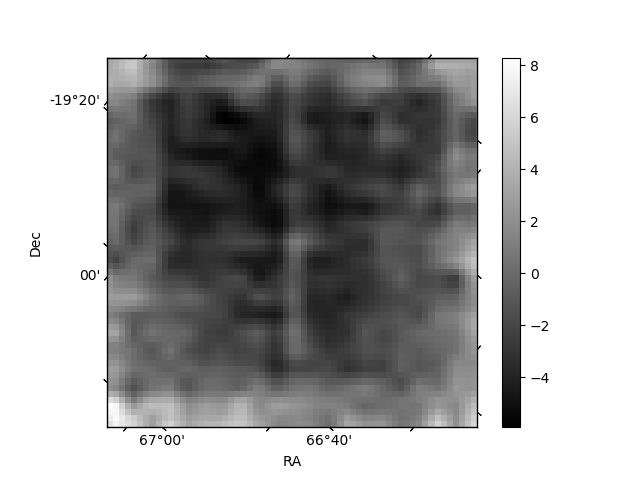
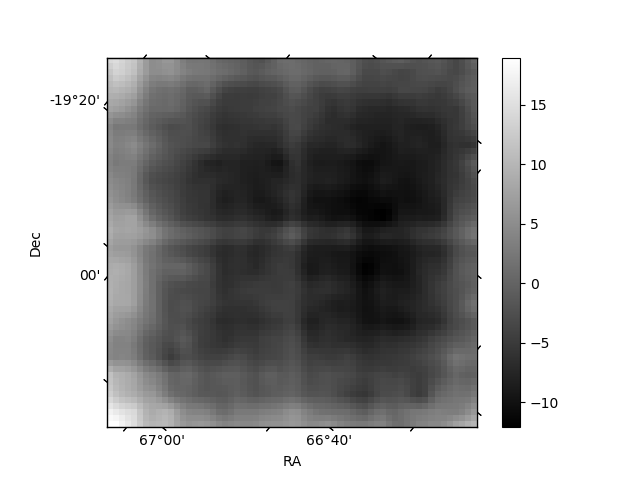
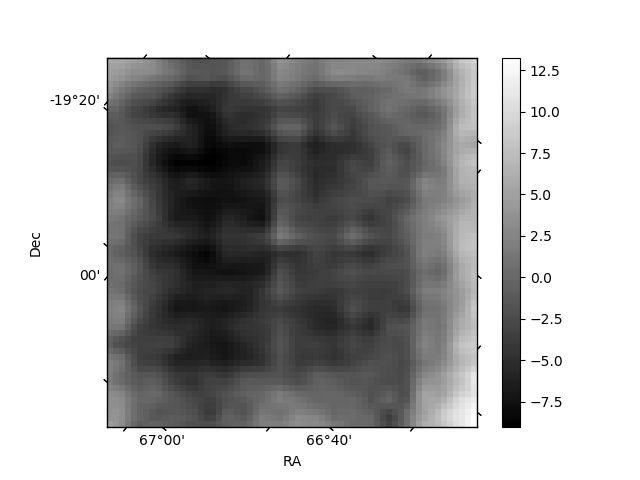
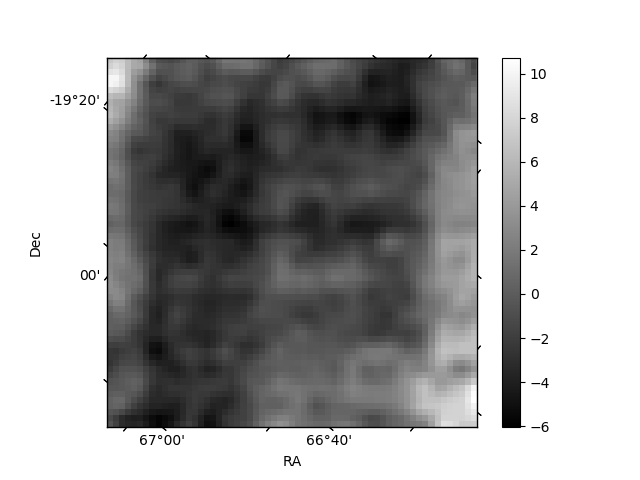
Histogram calculated using DETX and DETY for each event in the final _common_clean file
| Quadrant A | 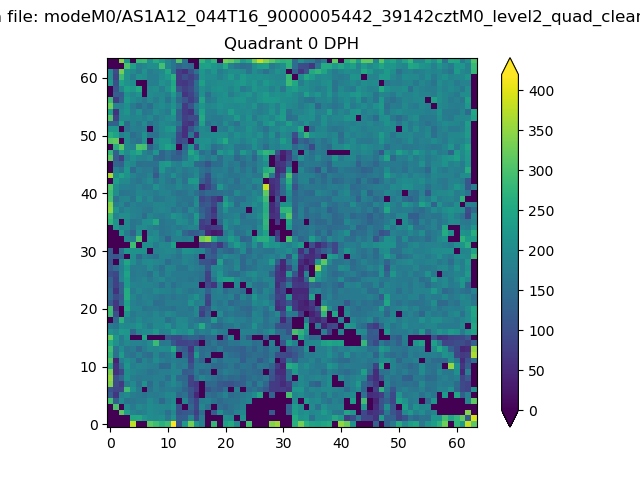 |
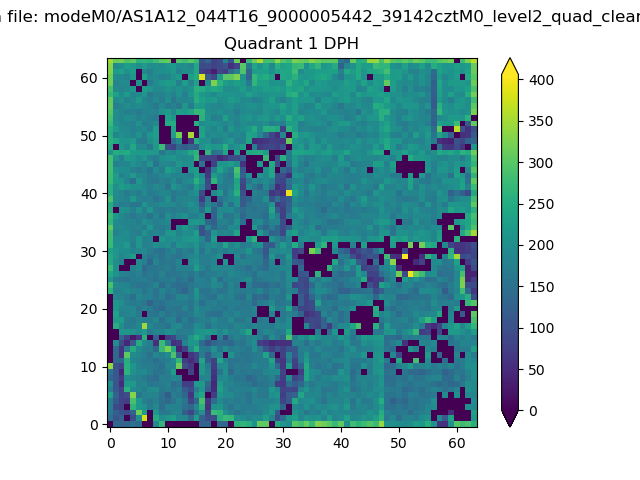 |
Quadrant B |
|---|---|---|---|
| Quadrant D | 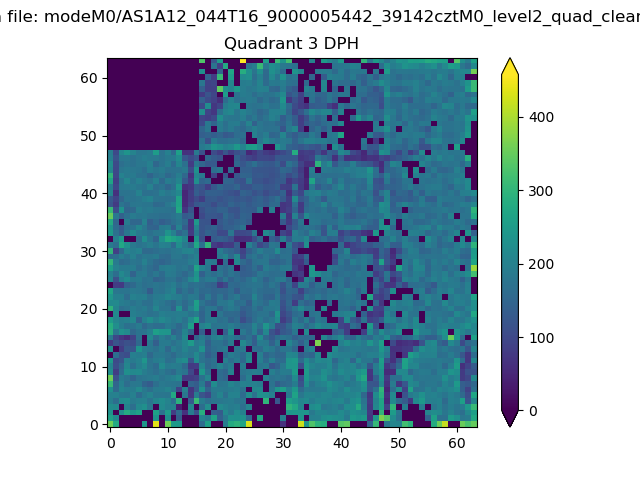 |
 |
Quadrant C |
| Plot type | Count rate plots | Images |
|---|---|---|
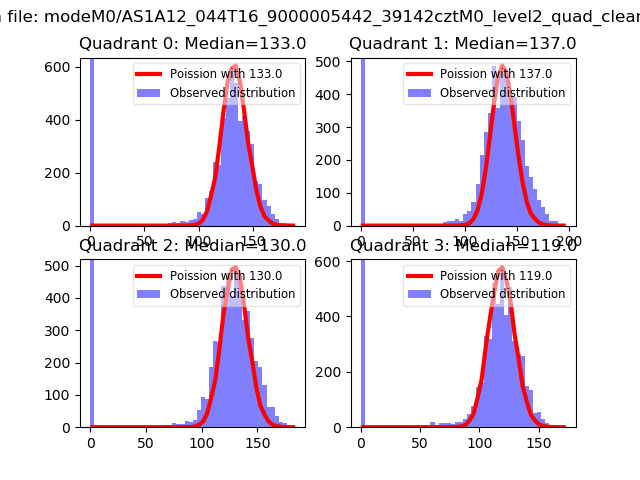
| Comparison with Poisson distribution Blue bars denote a histogram of data divided into 1 sec bins. Red curve is a Poisson curve with rate = median count rate of data. |
 |
 |
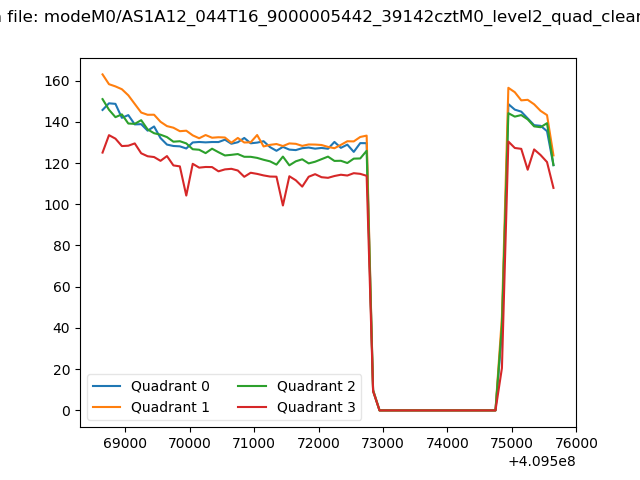
| Quadrant-wise count rates Data is divided into 100 sec bins |
 |
|
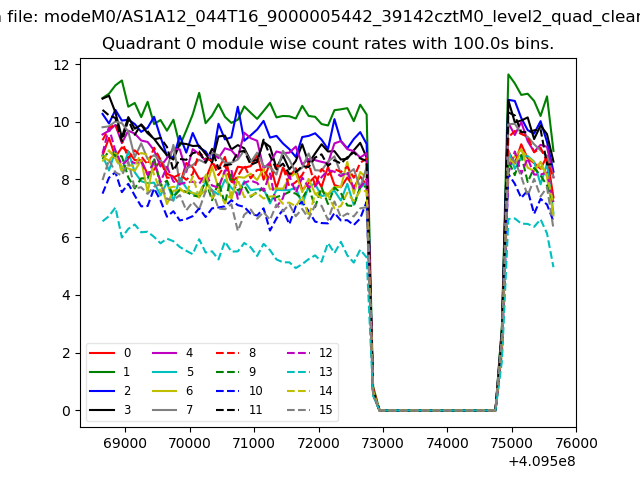
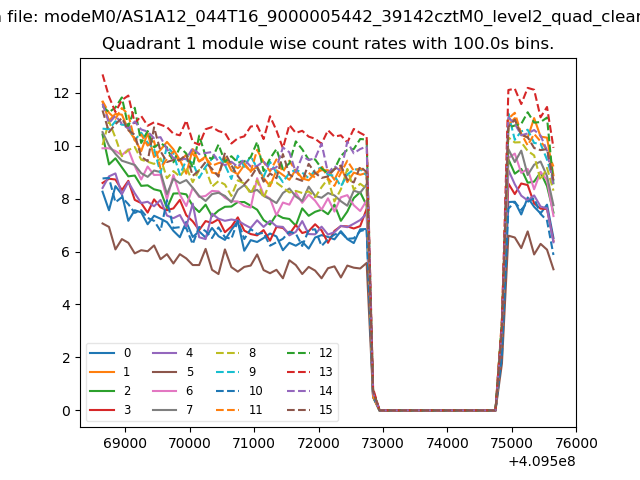
| Module-wise count rates for Quadrant A Data is divided into 100 sec bins |
 |
 |
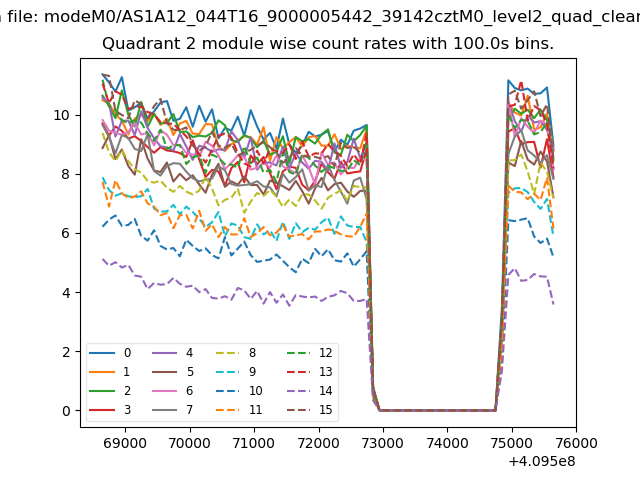
| Module-wise count rates for Quadrant B Data is divided into 100 sec bins |
 |
 |
| Module-wise count rates for Quadrant C Data is divided into 100 sec bins |
 |
 |
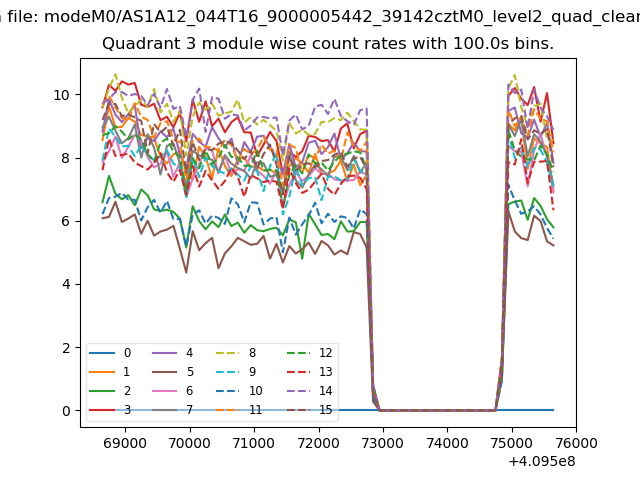
| Module-wise count rates for Quadrant D Data is divided into 100 sec bins |
 |
 |
| Parameter | Plot |
|---|---|
| CZT HV Monitor | 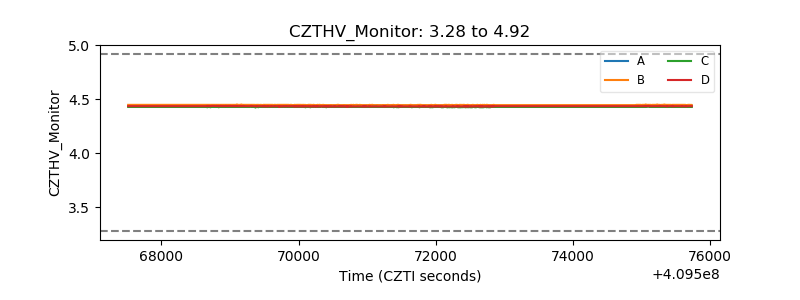 |
| D_VDD | 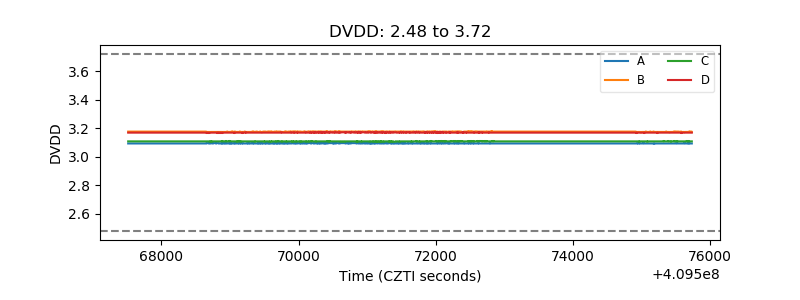 |
| Temperature 1 | 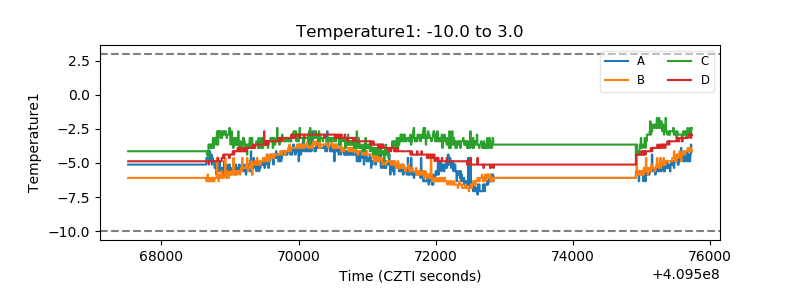 |
| Veto HV Monitor | 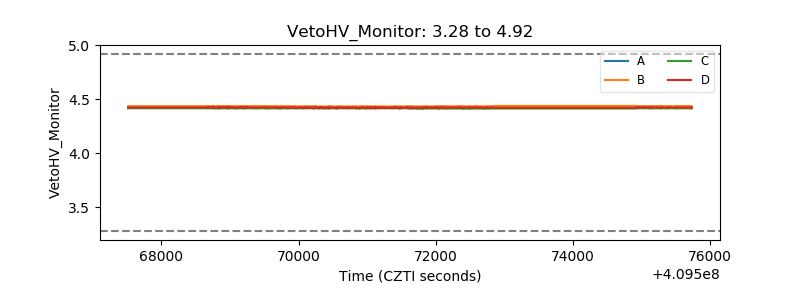 |
| Veto LLD | 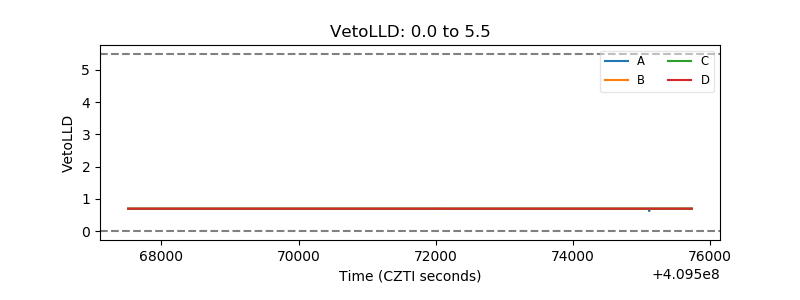 |
| Alpha Counter | 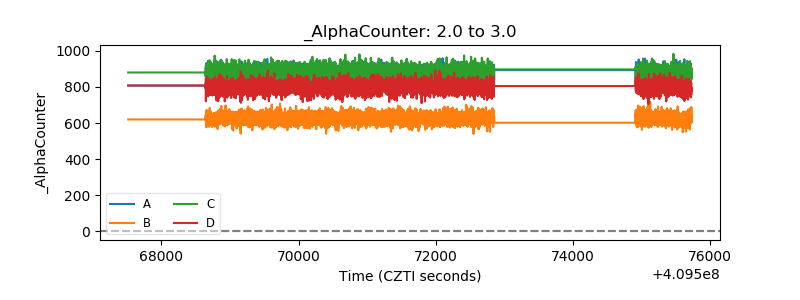 |
| _CPM_Rate | 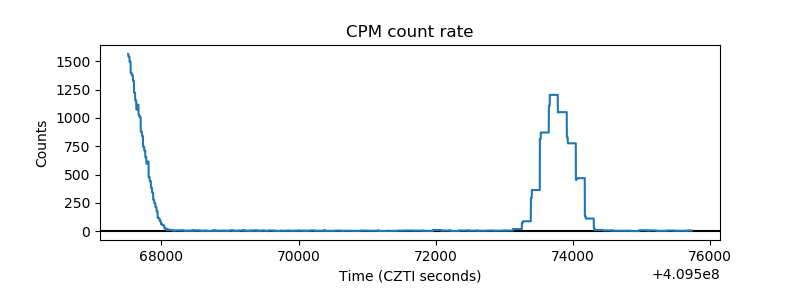 |
| CZT Counter |  |
| +2.5 Volts monitor | 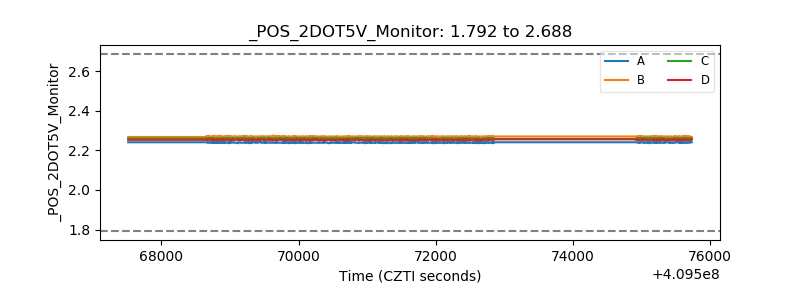 |
| +5 Volts monitor | 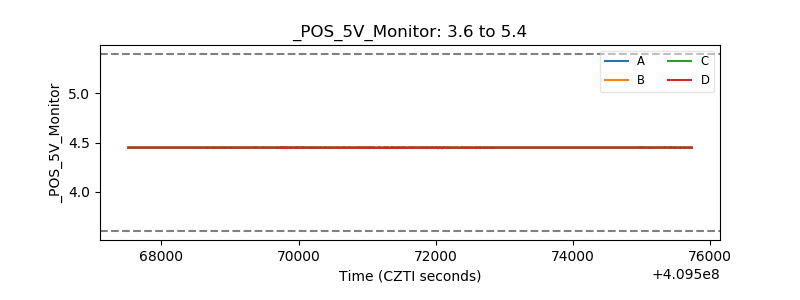 |
| _ROLL_ROT | 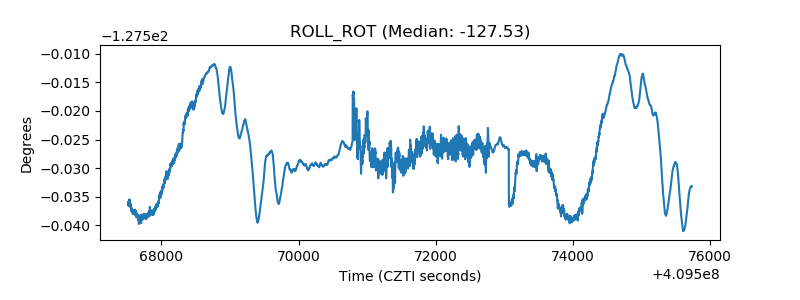 |
| _Roll_DEC | 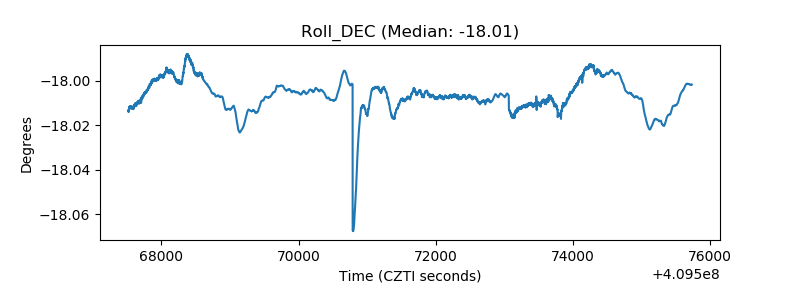 |
| _Roll_RA | 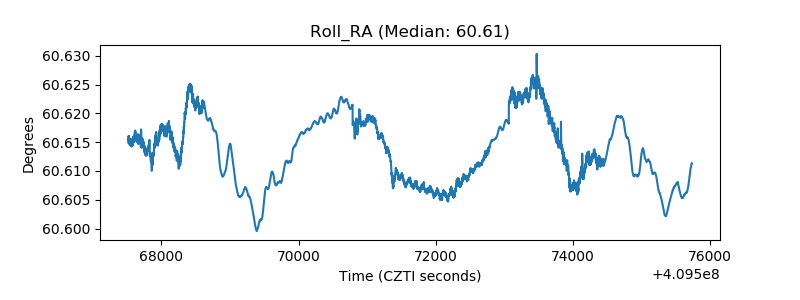 |
| Veto Counter | 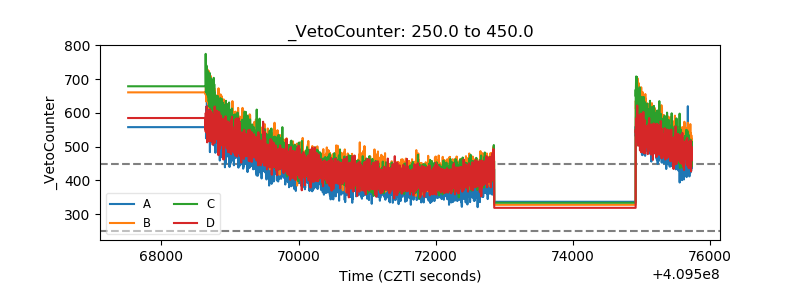 |