| Param | Original file | Final file |
|---|---|---|
| Filename | modeM0/AS1A12_044T16_9000005442_39143cztM0_level2.fits | modeM0/AS1A12_044T16_9000005442_39143cztM0_level2_quad_clean.evt |
| Size (bytes) | 349,776,000 | 94,685,760 |
| Size | 333.6 MB | 90.3 MB |
| Events in quadrant A | 2,948,027 | 653,899 |
| Events in quadrant B | 2,401,519 | 666,432 |
| Events in quadrant C | 2,553,208 | 627,539 |
| Events in quadrant D | 4,660,929 | 573,691 |
| Mode M0 | |||
|---|---|---|---|
| Quadrant | BADHDUFLAG | Total packets | Discarded packets |
| A | 0 | 12202 | 3 |
| B | 0 | 10086 | 2 |
| C | 0 | 10520 | 2 |
| D | 0 | 17569 | 2 |
| Mode M9 | |||
|---|---|---|---|
| Quadrant | BADHDUFLAG | Total packets | Discarded packets |
| A | 0 | 36 | 0 |
| B | 0 | 36 | 0 |
| C | 0 | 36 | 0 |
| D | 0 | 37 | 0 |
| Mode SS | |||
|---|---|---|---|
| Quadrant | BADHDUFLAG | Total packets | Discarded packets |
| A | 0 | 100 | 0 |
| B | 0 | 100 | 0 |
| C | 0 | 100 | 0 |
| D | 0 | 100 | 0 |
| Quadrant | Total seconds | Saturated seconds | Saturation percentage |
|---|---|---|---|
| A | 4935 | 18 | 0.364742% |
| B | 4935 | 7 | 0.141844% |
| C | 4935 | 9 | 0.182371% |
| D | 4935 | 146 | 2.958460% |
Noise dominated data is calculated using 1-second bins in cleaned event files. If a bin has >2000 counts, and if more than 50% of those come from <1% of pixels, then it is considered to be noise-dominated and hence unusable.
| Quadrant | # 1 sec bins | Bins with >0 counts | Bins with >2000 counts | High rate bins dominated by noise | Noise dominated (total time) | Noise dominated (detector-on time) | Marked lightcurve |
|---|---|---|---|---|---|---|---|
| A | 7058 | 4936 | 4 | 4 | 0.06% | 0.08% | 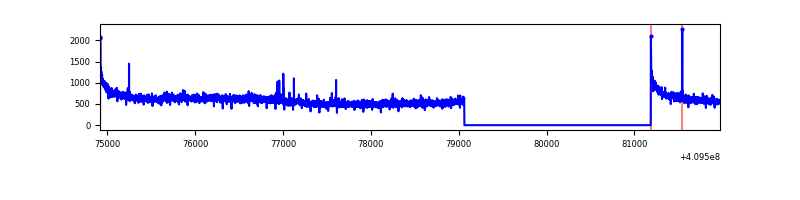 |
| B | 7058 | 4936 | 3 | 3 | 0.04% | 0.06% | 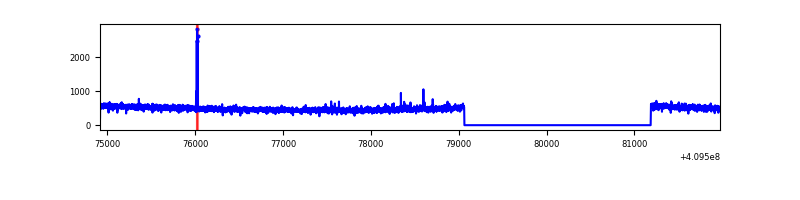 |
| C | 7058 | 4936 | 6 | 6 | 0.09% | 0.12% | 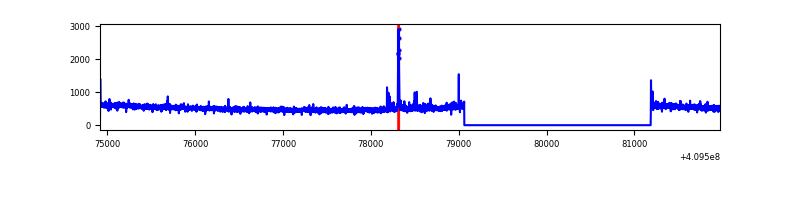 |
| D | 7058 | 4936 | 139 | 139 | 1.97% | 2.82% | 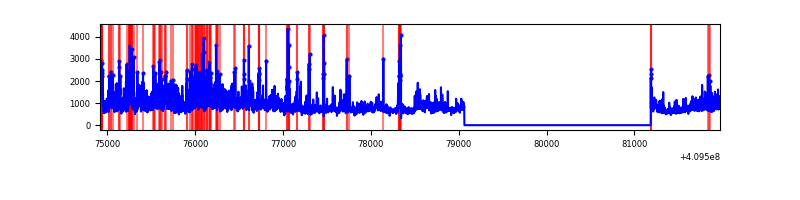 |
Top three noisy pixels from each quadrant. If the there are fewer than three noisy pixels in the level2.evt file, extra rows are filled as -1
| Pixel properties | Quadrant properties | ||||||
|---|---|---|---|---|---|---|---|
| Quadrant | DetID | PixID | Counts | Sigma | Mean | Median | Sigma |
| A | 10 | 83 | 371686 | 3047.48 | 610 | 600 | 121.8 |
| A | 13 | 6 | 118214 | 965.88 | 610 | 600 | 121.8 |
| A | 15 | 223 | 79559 | 648.44 | 610 | 600 | 121.8 |
| B | 0 | 199 | 16795 | 139.71 | 602 | 587 | 116.0 |
| B | 12 | 111 | 14109 | 116.55 | 602 | 587 | 116.0 |
| B | 11 | 111 | 13150 | 108.29 | 602 | 587 | 116.0 |
| C | 15 | 214 | 210329 | 1553.62 | 582 | 587 | 135.0 |
| C | 9 | 187 | 62711 | 460.17 | 582 | 587 | 135.0 |
| C | 0 | 10 | 6340 | 42.61 | 582 | 587 | 135.0 |
| D | 12 | 235 | 2078680 | 14838.42 | 579 | 565 | 140.0 |
| D | 2 | 249 | 148490 | 1056.23 | 579 | 565 | 140.0 |
| D | 5 | 222 | 47417 | 334.54 | 579 | 565 | 140.0 |
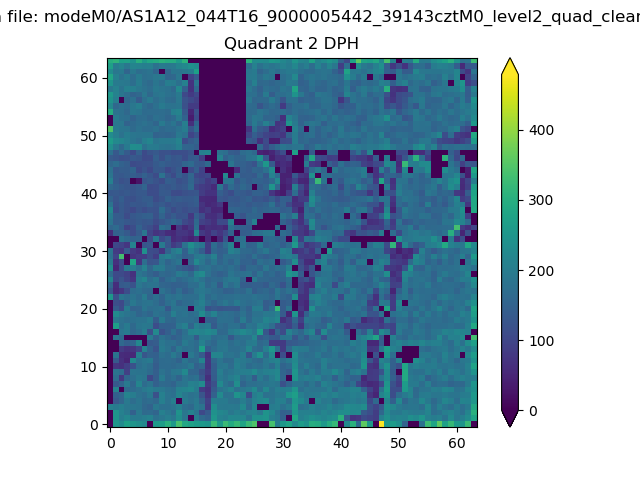
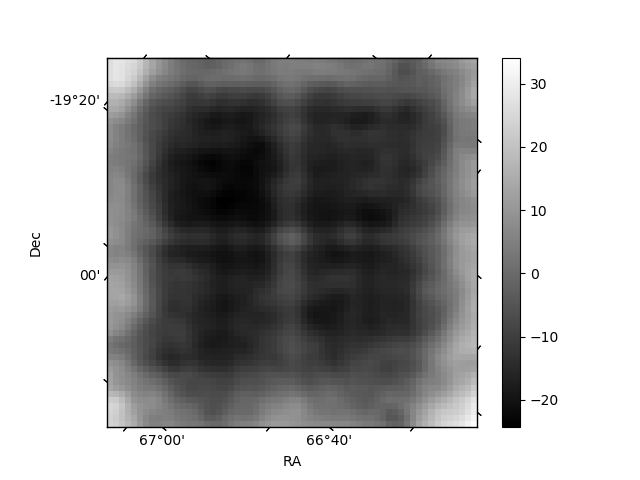
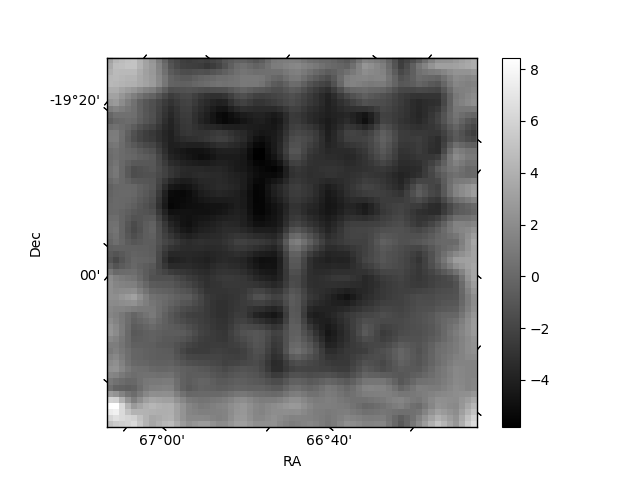
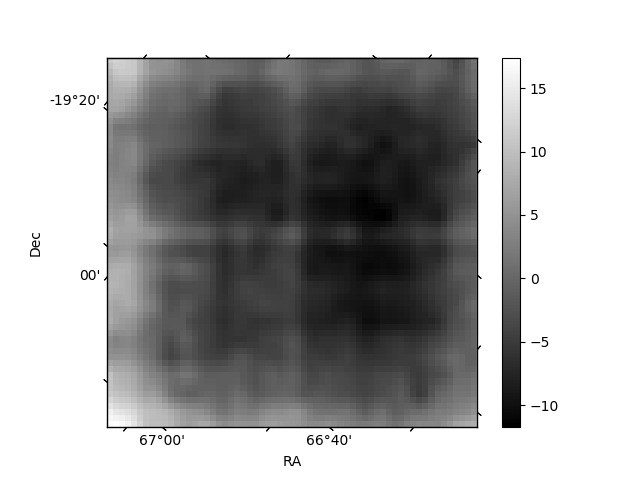
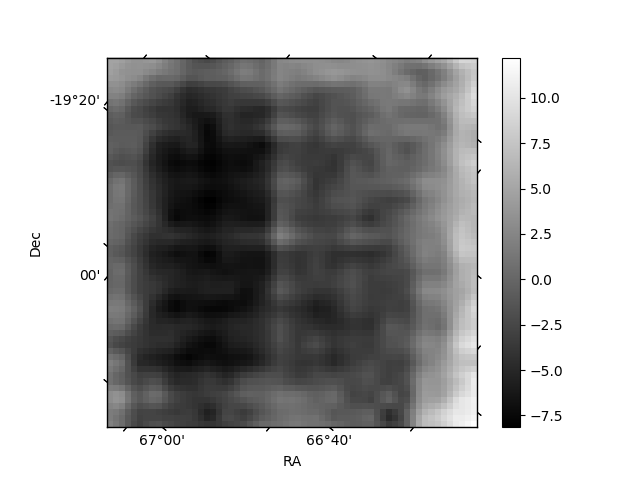
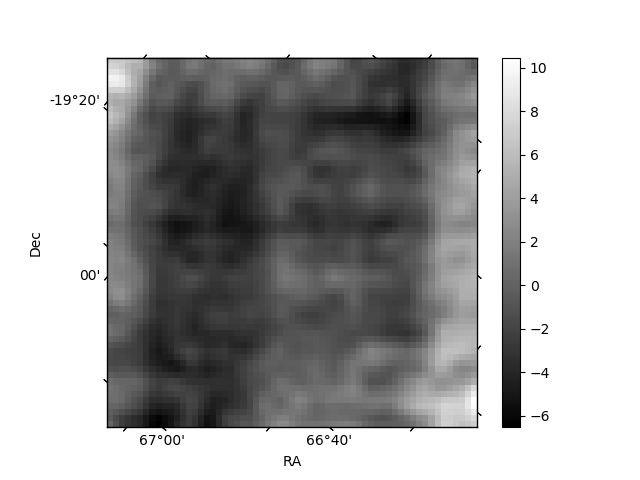
Histogram calculated using DETX and DETY for each event in the final _common_clean file
| Quadrant A | 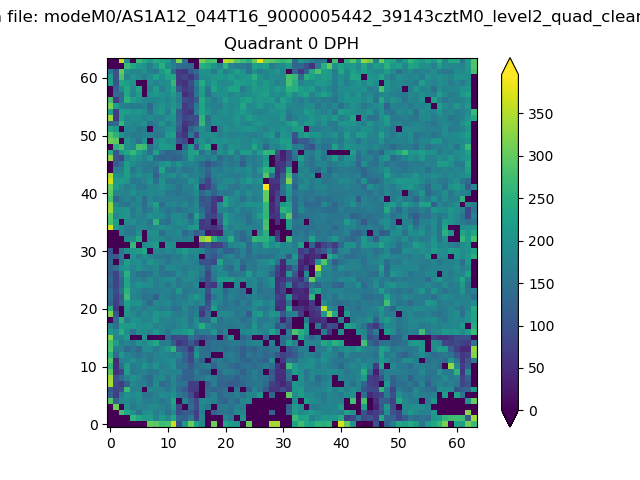 |
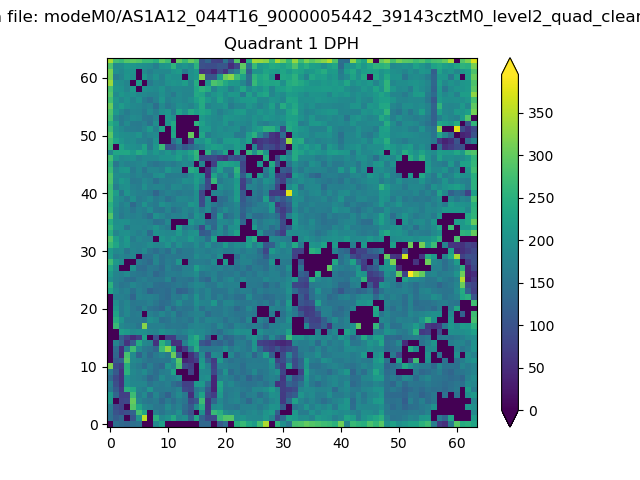 |
Quadrant B |
|---|---|---|---|
| Quadrant D | 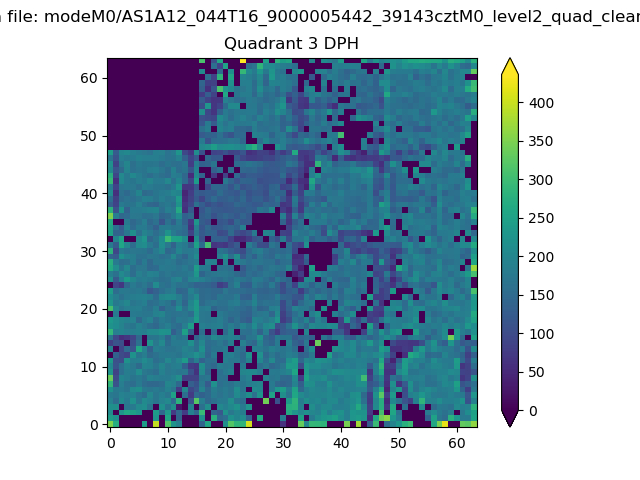 |
 |
Quadrant C |
| Plot type | Count rate plots | Images |
|---|---|---|
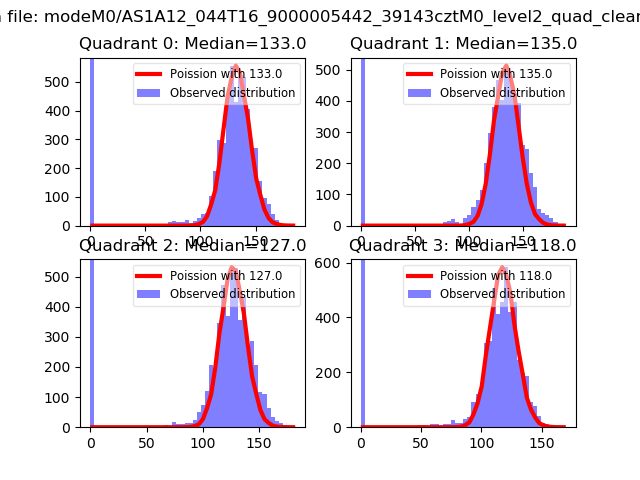
| Comparison with Poisson distribution Blue bars denote a histogram of data divided into 1 sec bins. Red curve is a Poisson curve with rate = median count rate of data. |
 |
 |
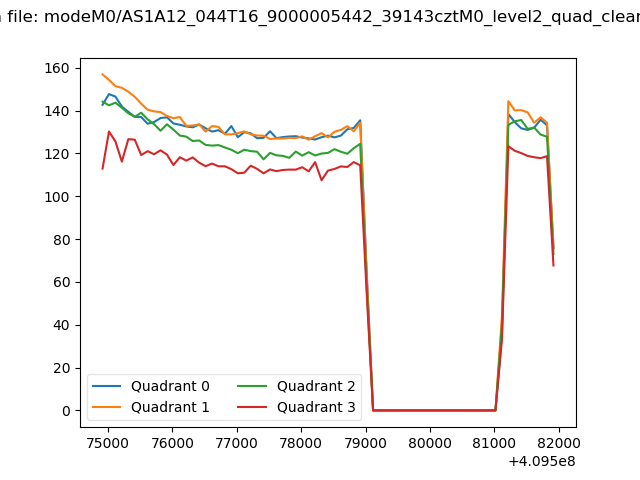
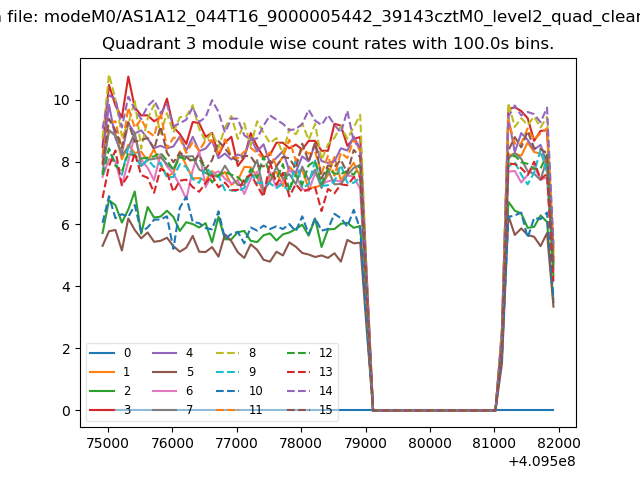
| Quadrant-wise count rates Data is divided into 100 sec bins |
 |
|
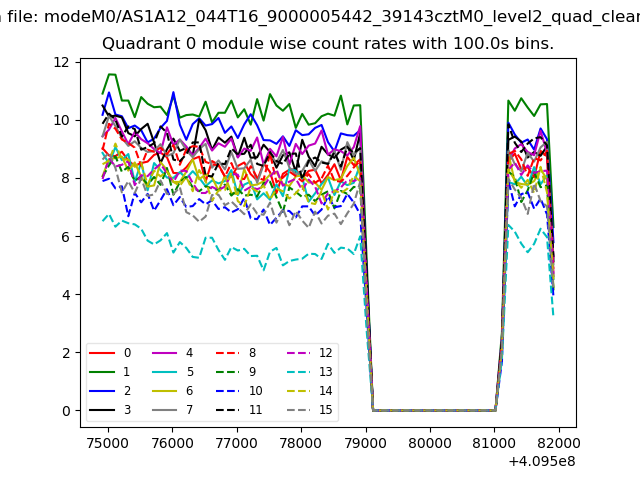
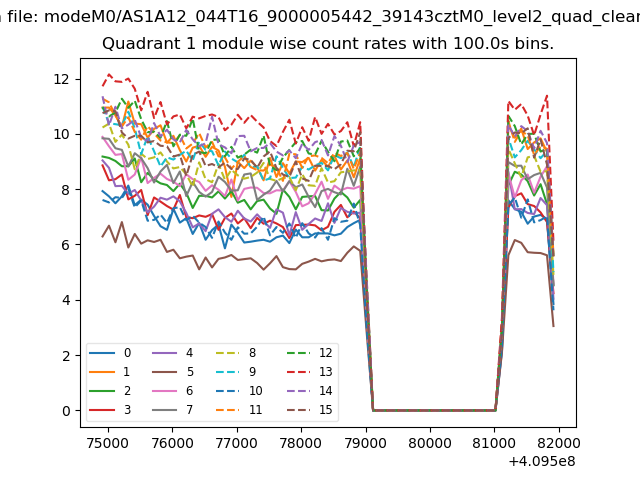
| Module-wise count rates for Quadrant A Data is divided into 100 sec bins |
 |
 |
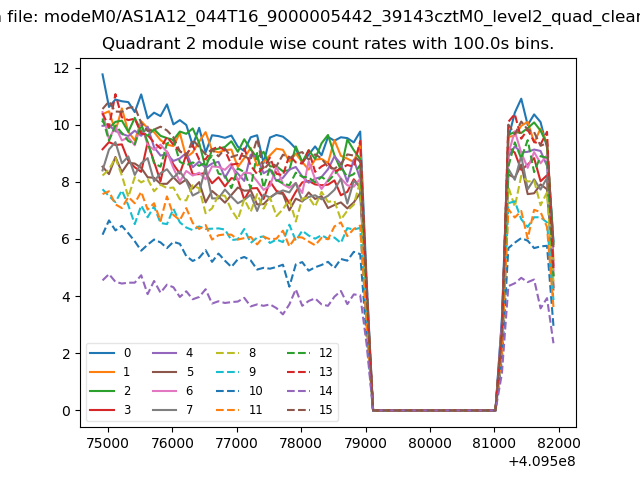
| Module-wise count rates for Quadrant B Data is divided into 100 sec bins |
 |
 |
| Module-wise count rates for Quadrant C Data is divided into 100 sec bins |
 |
 |
| Module-wise count rates for Quadrant D Data is divided into 100 sec bins |
 |
 |
| Parameter | Plot |
|---|---|
| CZT HV Monitor | 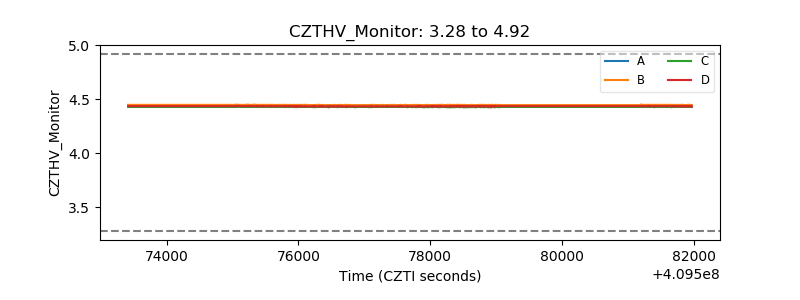 |
| D_VDD | 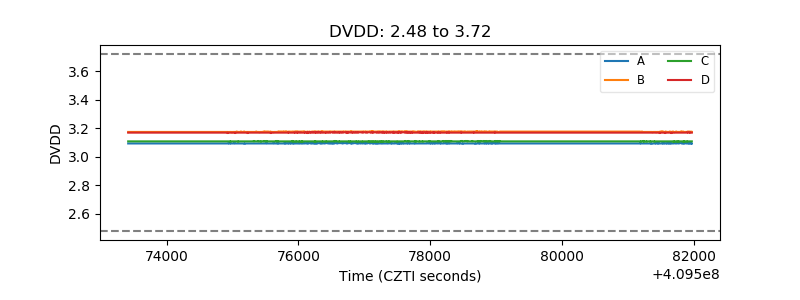 |
| Temperature 1 | 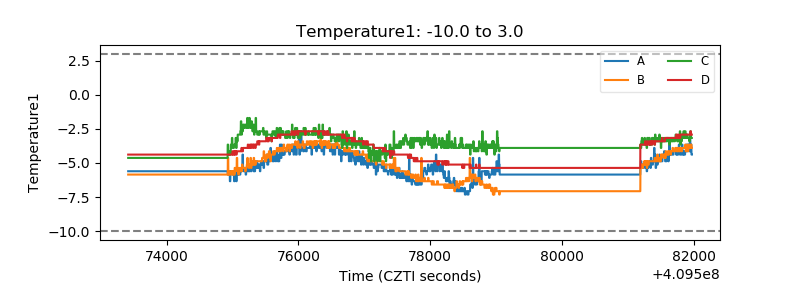 |
| Veto HV Monitor | 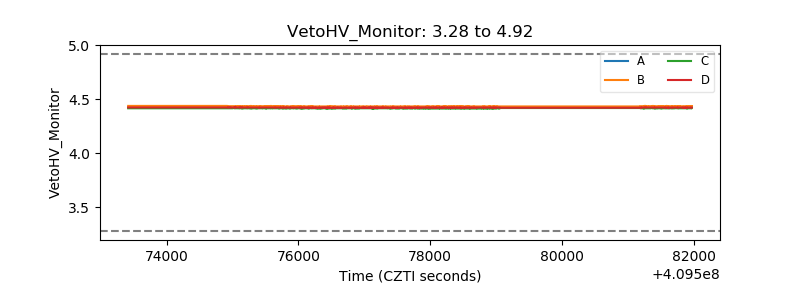 |
| Veto LLD | 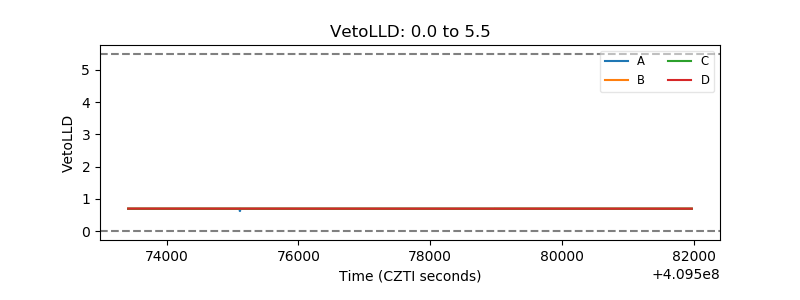 |
| Alpha Counter | 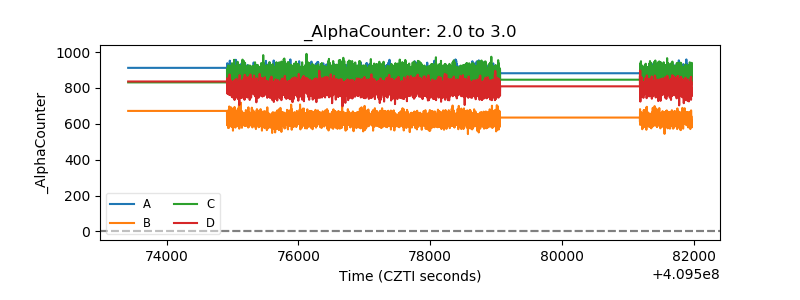 |
| _CPM_Rate |  |
| CZT Counter | 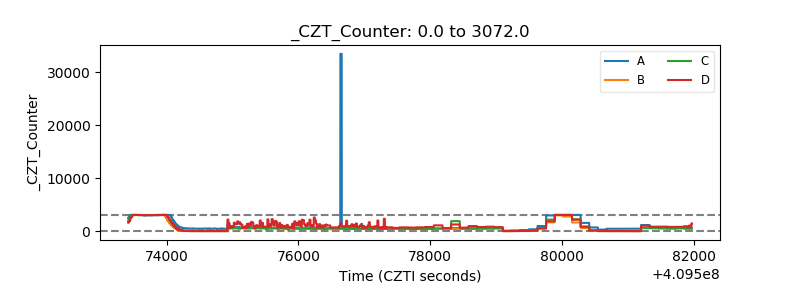 |
| +2.5 Volts monitor | 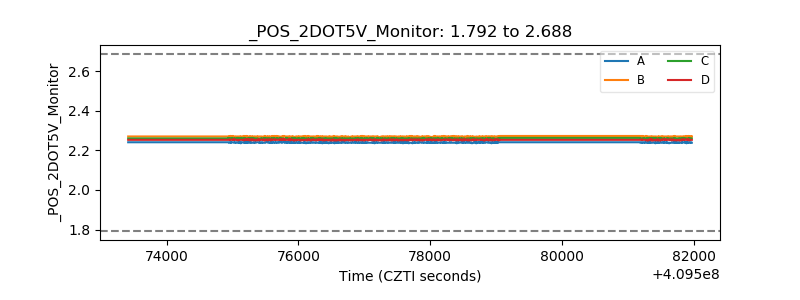 |
| +5 Volts monitor | 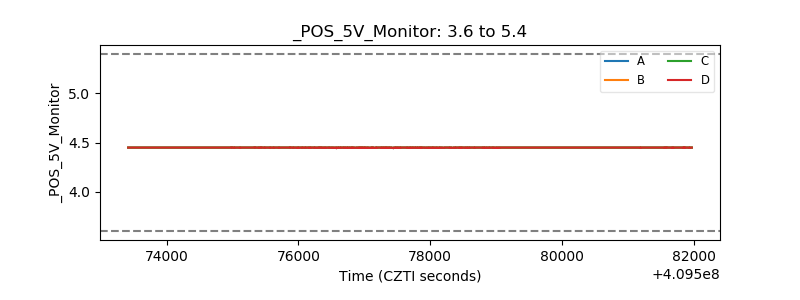 |
| _ROLL_ROT | 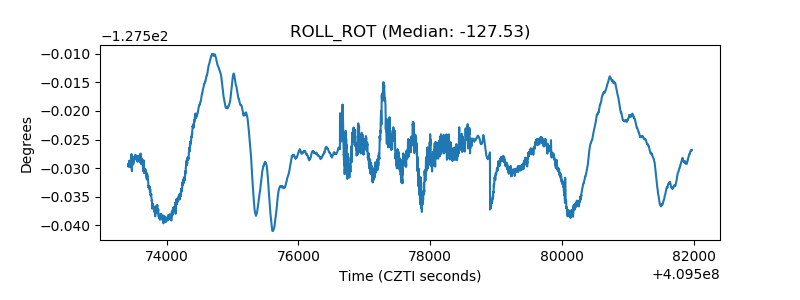 |
| _Roll_DEC | 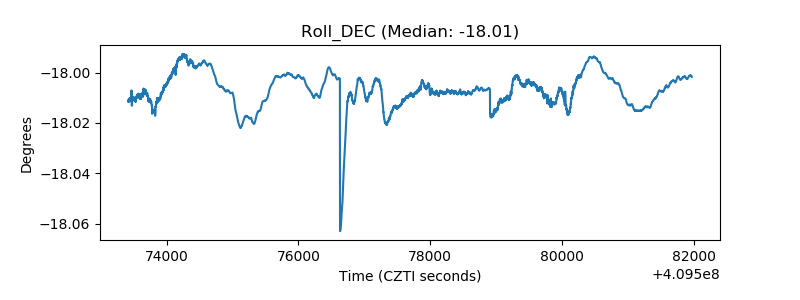 |
| _Roll_RA | 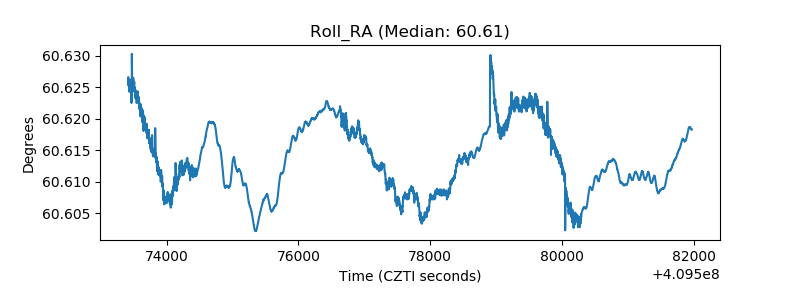 |
| Veto Counter | 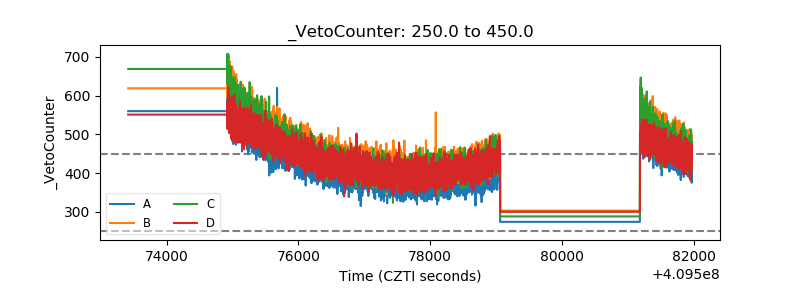 |