| Param | Original file | Final file |
|---|---|---|
| Filename | modeM0/AS1A12_083T07_9000005440_39132cztM0_level2.fits | modeM0/AS1A12_083T07_9000005440_39132cztM0_level2_quad_clean.evt |
| Size (bytes) | 283,890,240 | 44,089,920 |
| Size | 270.7 MB | 42.0 MB |
| Events in quadrant A | 1,981,557 | 321,674 |
| Events in quadrant B | 1,347,279 | 328,467 |
| Events in quadrant C | 1,655,239 | 310,856 |
| Events in quadrant D | 5,306,248 | 174,679 |
| Mode M0 | |||
|---|---|---|---|
| Quadrant | BADHDUFLAG | Total packets | Discarded packets |
| A | 0 | 8084 | 1 |
| B | 0 | 5839 | 0 |
| C | 0 | 6599 | 0 |
| D | 0 | 17680 | 0 |
| Mode M9 | |||
|---|---|---|---|
| Quadrant | BADHDUFLAG | Total packets | Discarded packets |
| A | 0 | 16 | 0 |
| B | 0 | 16 | 0 |
| C | 0 | 16 | 0 |
| D | 0 | 16 | 0 |
| Mode SS | |||
|---|---|---|---|
| Quadrant | BADHDUFLAG | Total packets | Discarded packets |
| A | 0 | 58 | 0 |
| B | 0 | 58 | 0 |
| C | 0 | 58 | 0 |
| D | 0 | 58 | 0 |
| Quadrant | Total seconds | Saturated seconds | Saturation percentage |
|---|---|---|---|
| A | 2790 | 53 | 1.899642% |
| B | 2790 | 22 | 0.788530% |
| C | 2790 | 35 | 1.254480% |
| D | 2790 | 1382 | 49.534050% |
Noise dominated data is calculated using 1-second bins in cleaned event files. If a bin has >2000 counts, and if more than 50% of those come from <1% of pixels, then it is considered to be noise-dominated and hence unusable.
| Quadrant | # 1 sec bins | Bins with >0 counts | Bins with >2000 counts | High rate bins dominated by noise | Noise dominated (total time) | Noise dominated (detector-on time) | Marked lightcurve |
|---|---|---|---|---|---|---|---|
| A | 4313 | 2791 | 35 | 35 | 0.81% | 1.25% | 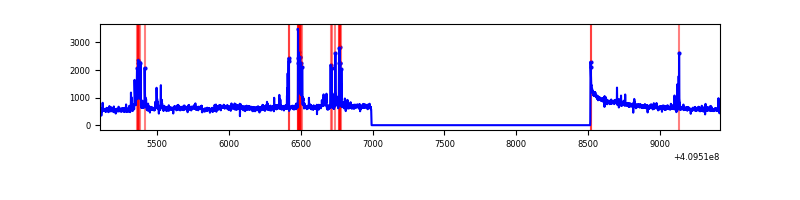 |
| B | 4313 | 2791 | 9 | 9 | 0.21% | 0.32% | 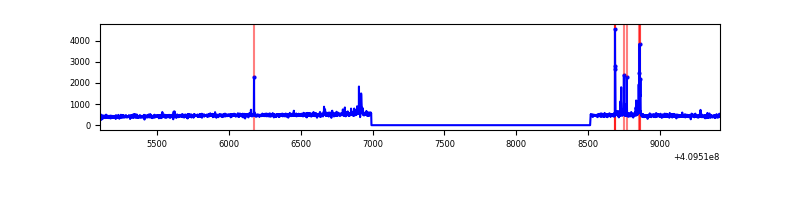 |
| C | 4313 | 2791 | 24 | 24 | 0.56% | 0.86% | 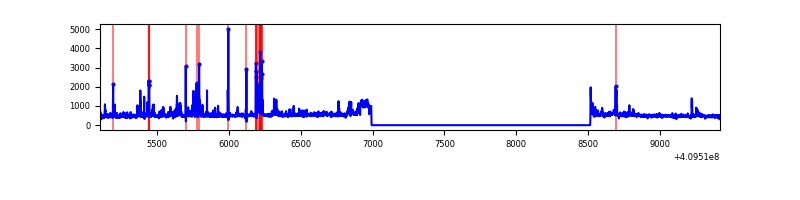 |
| D | 4313 | 2791 | 1172 | 1172 | 27.17% | 41.99% | 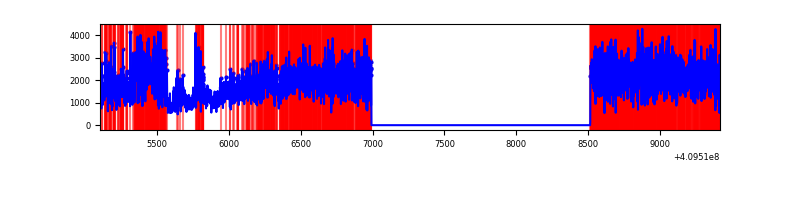 |
Top three noisy pixels from each quadrant. If the there are fewer than three noisy pixels in the level2.evt file, extra rows are filled as -1
| Pixel properties | Quadrant properties | ||||||
|---|---|---|---|---|---|---|---|
| Quadrant | DetID | PixID | Counts | Sigma | Mean | Median | Sigma |
| A | 15 | 223 | 305799 | 4537.06 | 324 | 318 | 67.3 |
| A | 10 | 83 | 220364 | 3268.16 | 324 | 318 | 67.3 |
| A | 14 | 235 | 146000 | 2163.7 | 324 | 318 | 67.3 |
| B | 5 | 172 | 74008 | 1145.82 | 321 | 313 | 64.3 |
| B | 12 | 111 | 7941 | 118.6 | 321 | 313 | 64.3 |
| B | 11 | 111 | 7347 | 109.37 | 321 | 313 | 64.3 |
| C | 9 | 187 | 288291 | 3822.88 | 314 | 316 | 75.3 |
| C | 15 | 214 | 117401 | 1554.31 | 314 | 316 | 75.3 |
| C | 3 | 233 | 8081 | 103.08 | 314 | 316 | 75.3 |
| D | 12 | 235 | 3474529 | 52287.46 | 267 | 259 | 66.4 |
| D | 12 | 33 | 692222 | 10413.98 | 267 | 259 | 66.4 |
| D | 2 | 120 | 26251 | 391.18 | 267 | 259 | 66.4 |
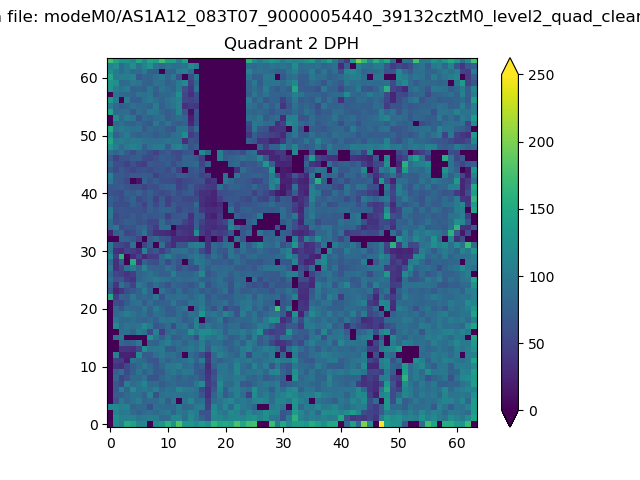
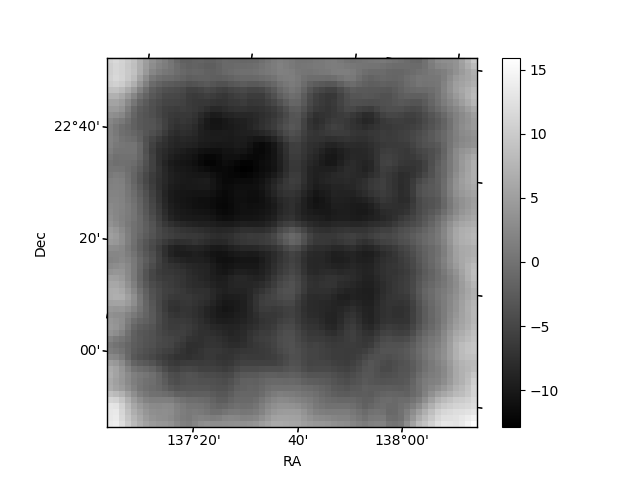
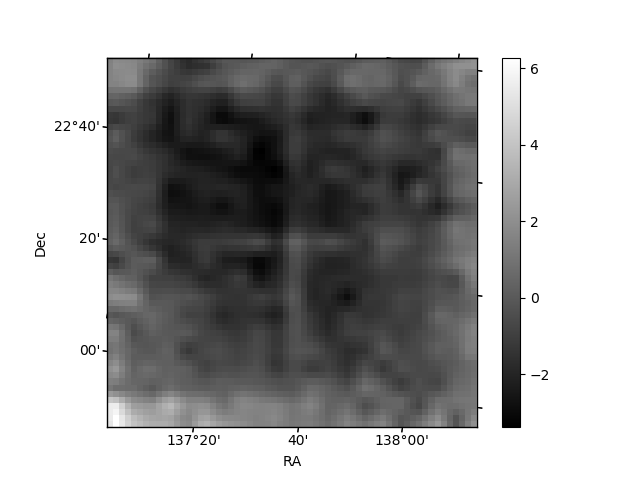
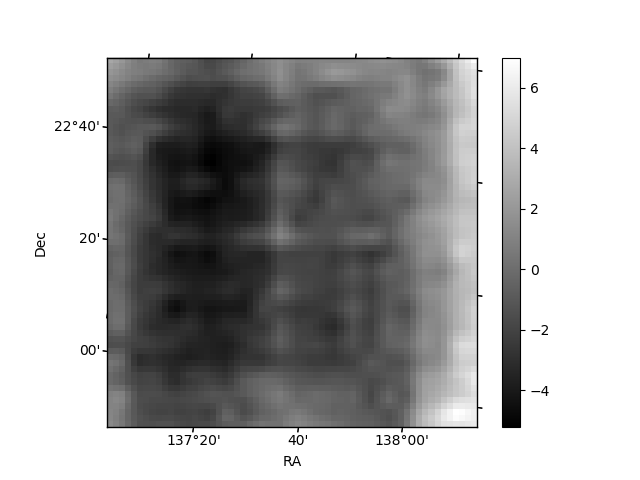
Histogram calculated using DETX and DETY for each event in the final _common_clean file
| Quadrant A | 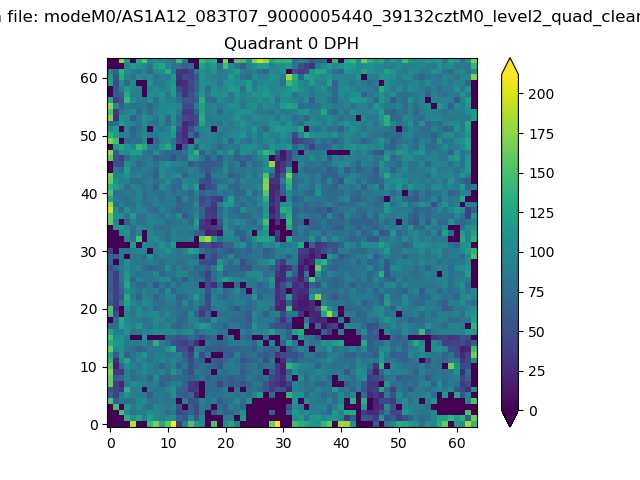 |
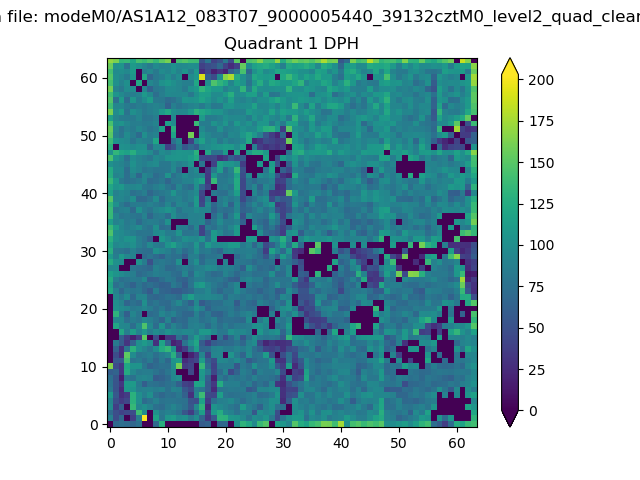 |
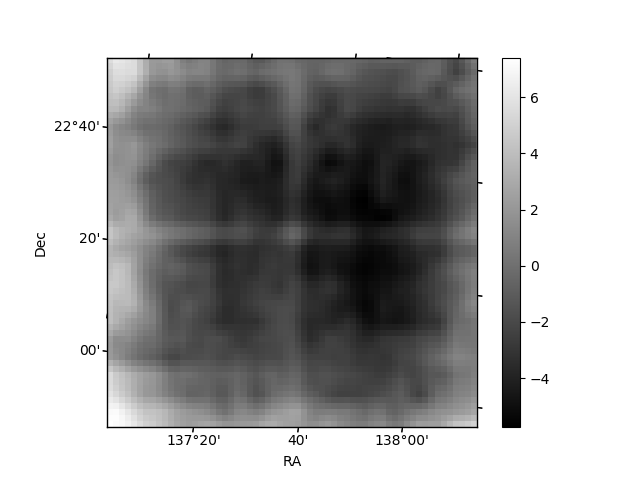
Quadrant B |
|---|---|---|---|
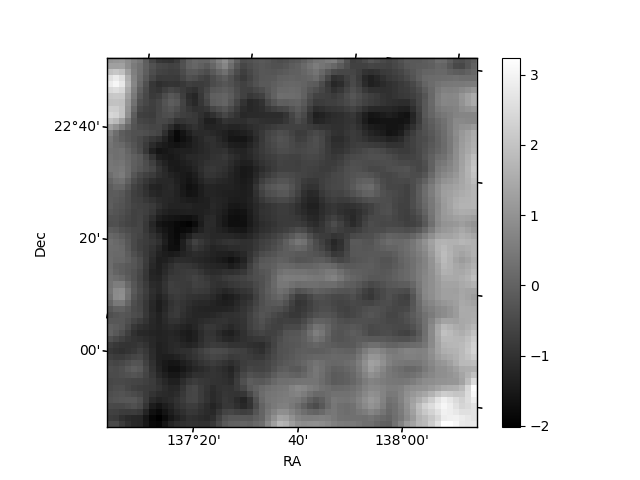
| Quadrant D | 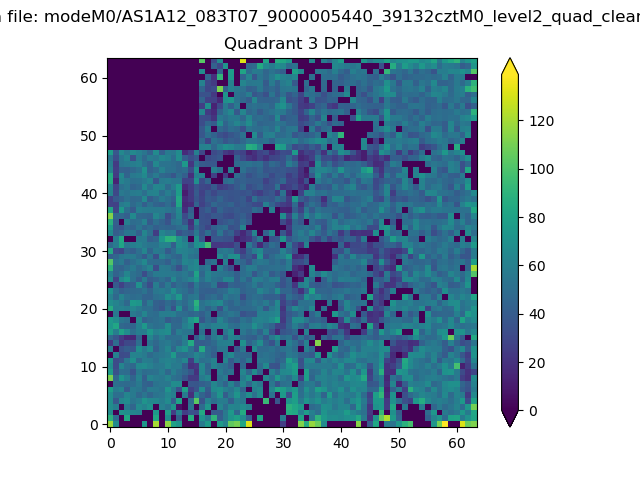 |
 |
Quadrant C |
| Plot type | Count rate plots | Images |
|---|---|---|
| Comparison with Poisson distribution Blue bars denote a histogram of data divided into 1 sec bins. Red curve is a Poisson curve with rate = median count rate of data. |
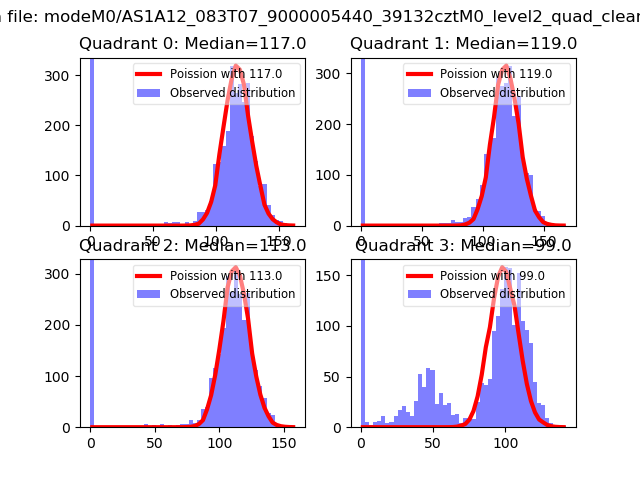 |
 |
| Quadrant-wise count rates Data is divided into 100 sec bins |
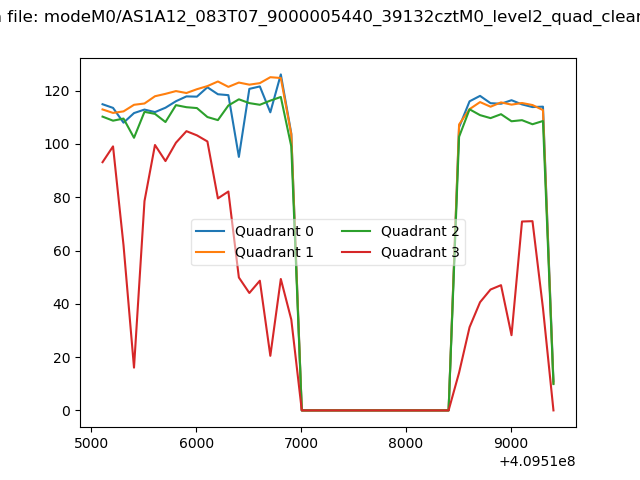 |
|
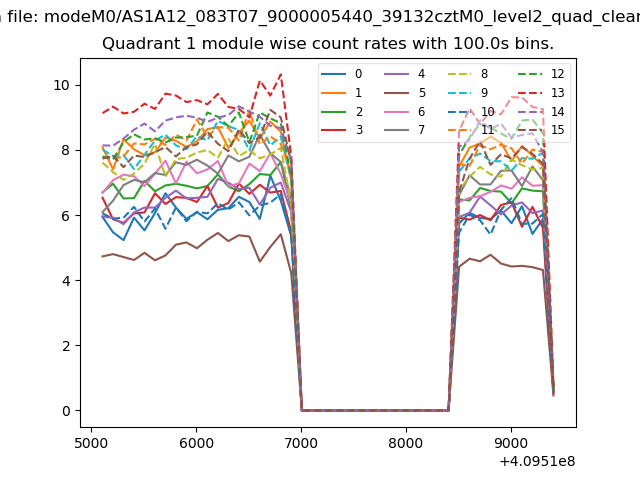
| Module-wise count rates for Quadrant A Data is divided into 100 sec bins |
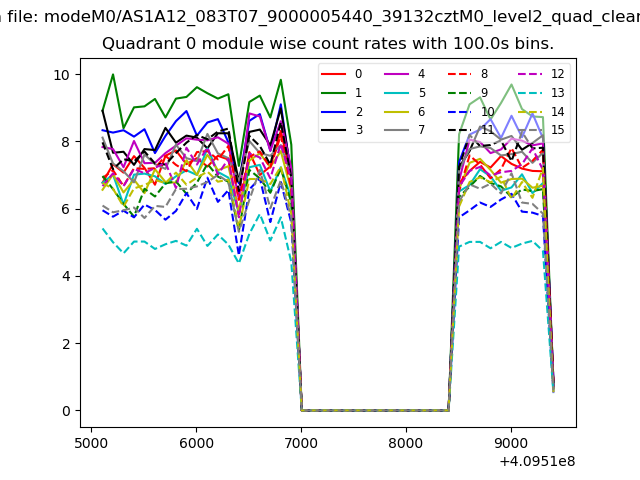 |
 |
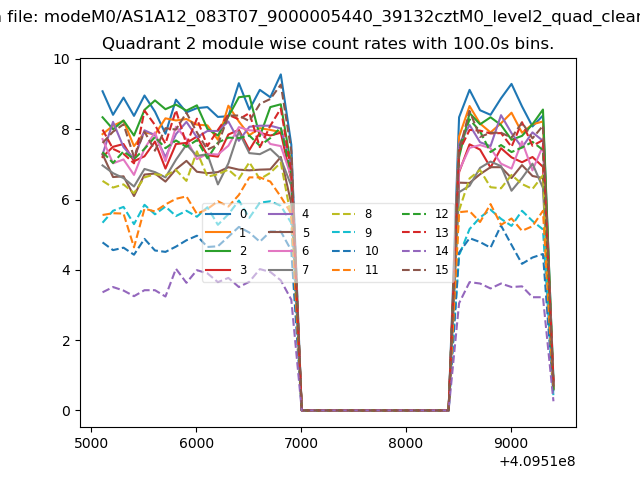
| Module-wise count rates for Quadrant B Data is divided into 100 sec bins |
 |
 |
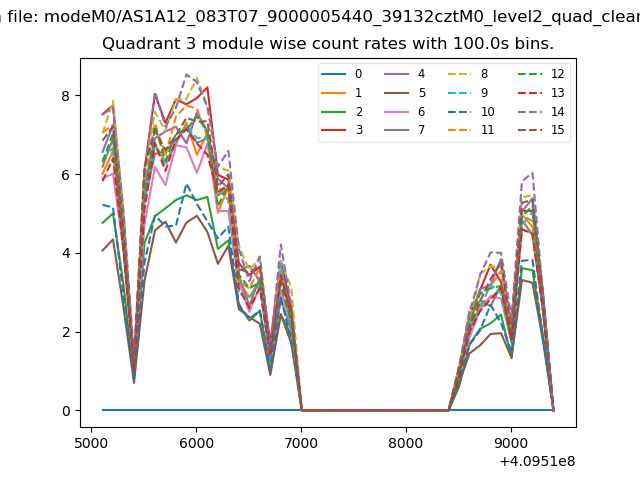
| Module-wise count rates for Quadrant C Data is divided into 100 sec bins |
 |
 |
| Module-wise count rates for Quadrant D Data is divided into 100 sec bins |
 |
 |
| Parameter | Plot |
|---|---|
| CZT HV Monitor | 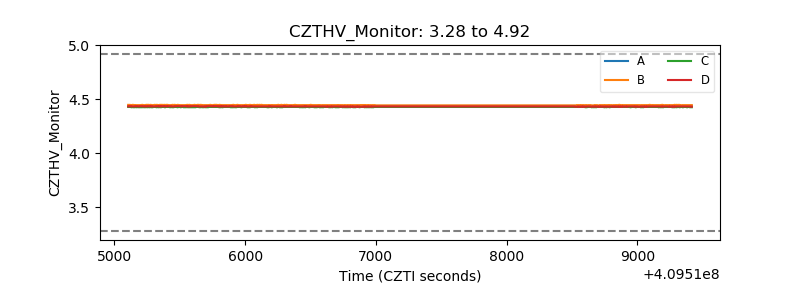 |
| D_VDD | 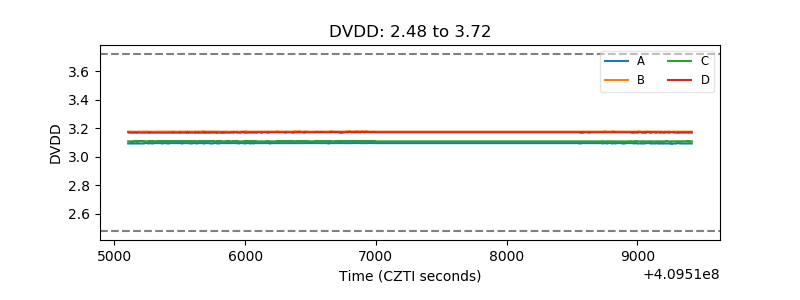 |
| Temperature 1 | 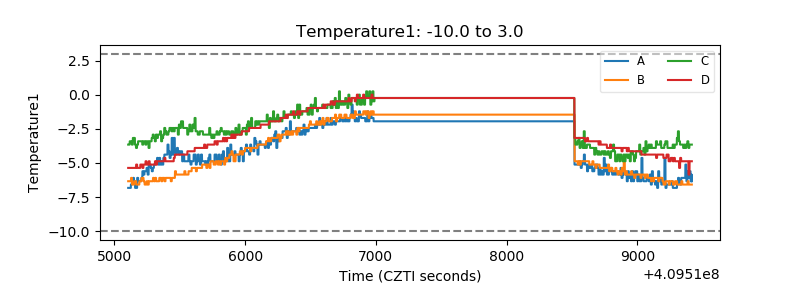 |
| Veto HV Monitor | 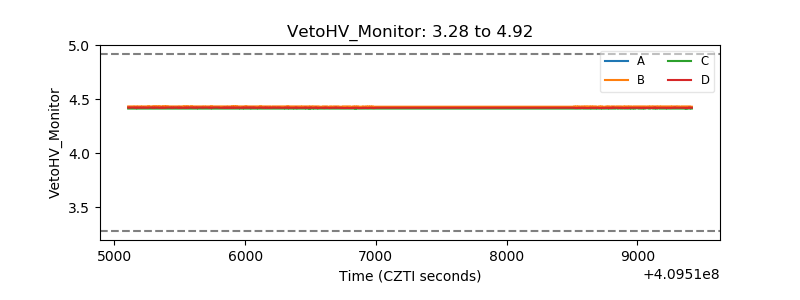 |
| Veto LLD | 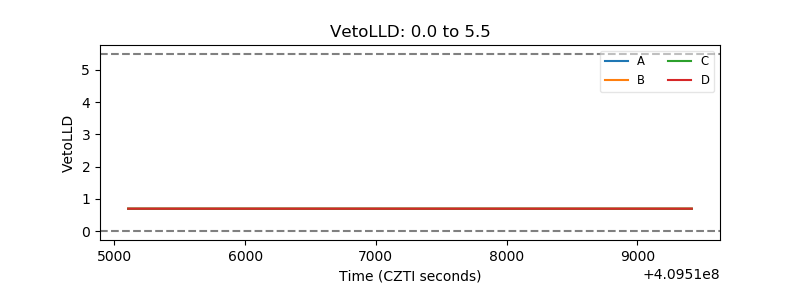 |
| Alpha Counter | 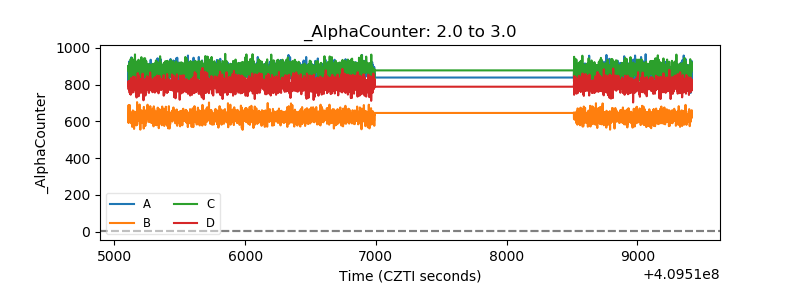 |
| _CPM_Rate | 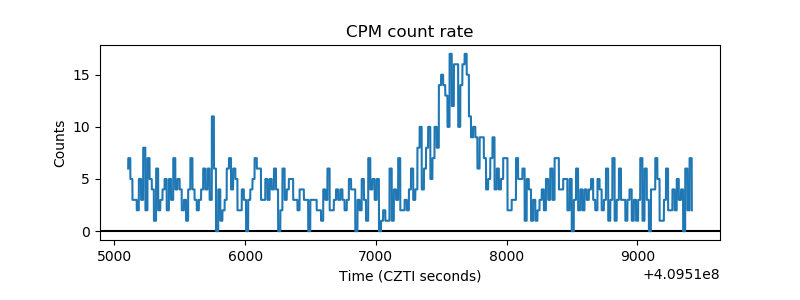 |
| CZT Counter | 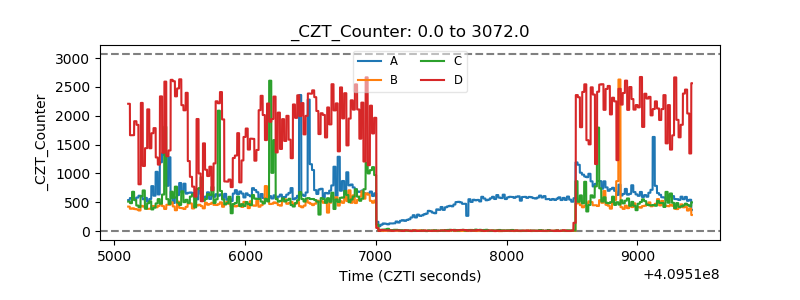 |
| +2.5 Volts monitor | 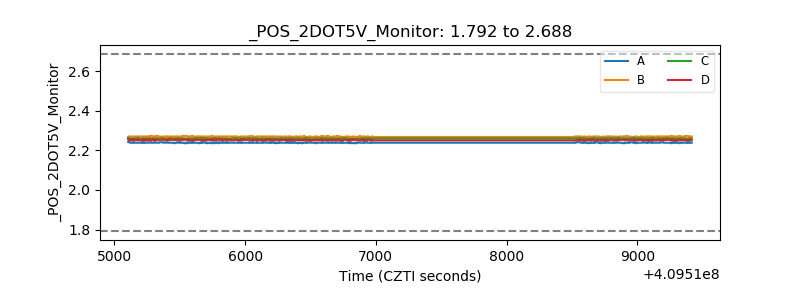 |
| +5 Volts monitor | 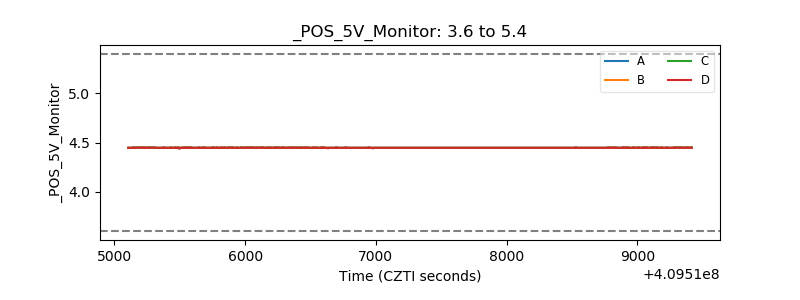 |
| _ROLL_ROT | 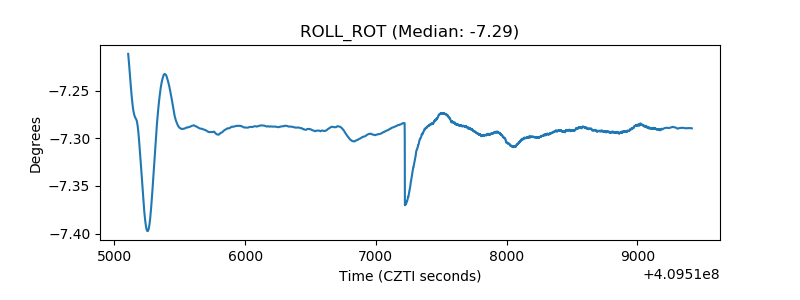 |
| _Roll_DEC | 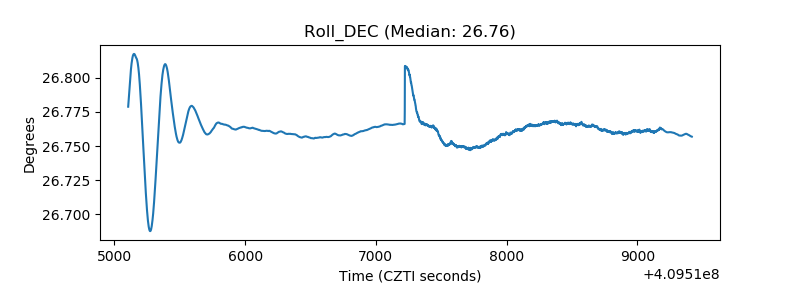 |
| _Roll_RA | 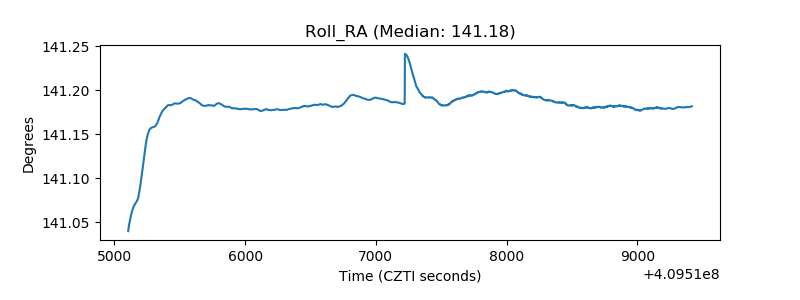 |
| Veto Counter |  |