| Param | Original file | Final file |
|---|---|---|
| Filename | modeM0/AS1A12_083T07_9000005440_39133cztM0_level2.fits | modeM0/AS1A12_083T07_9000005440_39133cztM0_level2_quad_clean.evt |
| Size (bytes) | 570,257,280 | 88,418,880 |
| Size | 543.8 MB | 84.3 MB |
| Events in quadrant A | 3,608,018 | 653,065 |
| Events in quadrant B | 2,747,825 | 656,029 |
| Events in quadrant C | 4,418,682 | 584,132 |
| Events in quadrant D | 9,884,549 | 378,452 |
| Mode M0 | |||
|---|---|---|---|
| Quadrant | BADHDUFLAG | Total packets | Discarded packets |
| A | 0 | 14416 | 2 |
| B | 0 | 12335 | 1 |
| C | 0 | 16971 | 1 |
| D | 0 | 33375 | 1 |
| Mode M9 | |||
|---|---|---|---|
| Quadrant | BADHDUFLAG | Total packets | Discarded packets |
| A | 0 | 22 | 0 |
| B | 0 | 22 | 0 |
| C | 0 | 22 | 0 |
| D | 0 | 23 | 0 |
| Mode SS | |||
|---|---|---|---|
| Quadrant | BADHDUFLAG | Total packets | Discarded packets |
| A | 0 | 118 | 0 |
| B | 0 | 118 | 0 |
| C | 0 | 118 | 0 |
| D | 0 | 118 | 0 |
| Quadrant | Total seconds | Saturated seconds | Saturation percentage |
|---|---|---|---|
| A | 5798 | 24 | 0.413936% |
| B | 5798 | 59 | 1.017592% |
| C | 5798 | 474 | 8.175233% |
| D | 5798 | 2431 | 41.928251% |
Noise dominated data is calculated using 1-second bins in cleaned event files. If a bin has >2000 counts, and if more than 50% of those come from <1% of pixels, then it is considered to be noise-dominated and hence unusable.
| Quadrant | # 1 sec bins | Bins with >0 counts | Bins with >2000 counts | High rate bins dominated by noise | Noise dominated (total time) | Noise dominated (detector-on time) | Marked lightcurve |
|---|---|---|---|---|---|---|---|
| A | 7141 | 5799 | 10 | 10 | 0.14% | 0.17% | 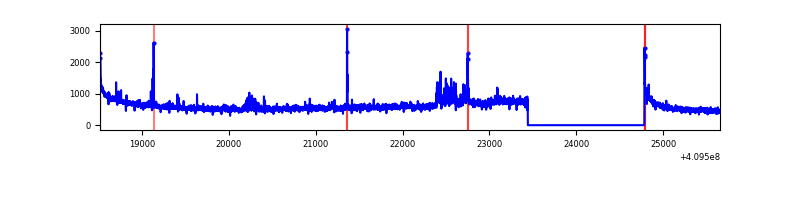 |
| B | 7141 | 5799 | 28 | 28 | 0.39% | 0.48% | 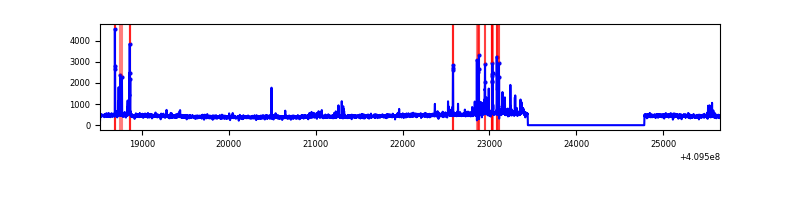 |
| C | 7141 | 5799 | 328 | 328 | 4.59% | 5.66% | 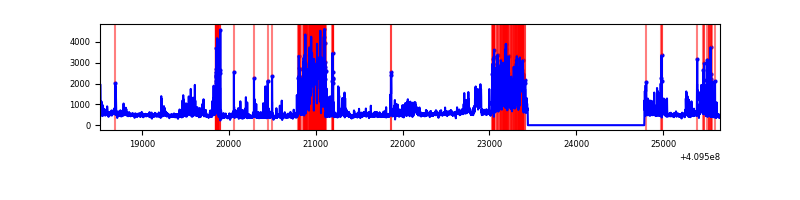 |
| D | 7141 | 5799 | 2014 | 2014 | 28.20% | 34.73% | 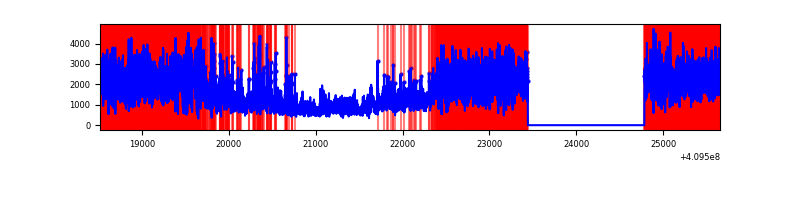 |
Top three noisy pixels from each quadrant. If the there are fewer than three noisy pixels in the level2.evt file, extra rows are filled as -1
| Pixel properties | Quadrant properties | ||||||
|---|---|---|---|---|---|---|---|
| Quadrant | DetID | PixID | Counts | Sigma | Mean | Median | Sigma |
| A | 15 | 223 | 511875 | 3901.03 | 640 | 625 | 131.1 |
| A | 10 | 83 | 455655 | 3472.05 | 640 | 625 | 131.1 |
| A | 14 | 235 | 129759 | 985.34 | 640 | 625 | 131.1 |
| B | 5 | 172 | 210628 | 1703.05 | 636 | 620 | 123.3 |
| B | 12 | 111 | 15661 | 121.97 | 636 | 620 | 123.3 |
| B | 0 | 190 | 15082 | 117.28 | 636 | 620 | 123.3 |
| C | 9 | 187 | 1818049 | 12906.02 | 600 | 603 | 140.8 |
| C | 15 | 214 | 233591 | 1654.49 | 600 | 603 | 140.8 |
| C | 3 | 233 | 14354 | 97.65 | 600 | 603 | 140.8 |
| D | 12 | 235 | 6029968 | 46110.39 | 528 | 512 | 130.8 |
| D | 12 | 33 | 949283 | 7255.74 | 528 | 512 | 130.8 |
| D | 12 | 233 | 366835 | 2801.46 | 528 | 512 | 130.8 |
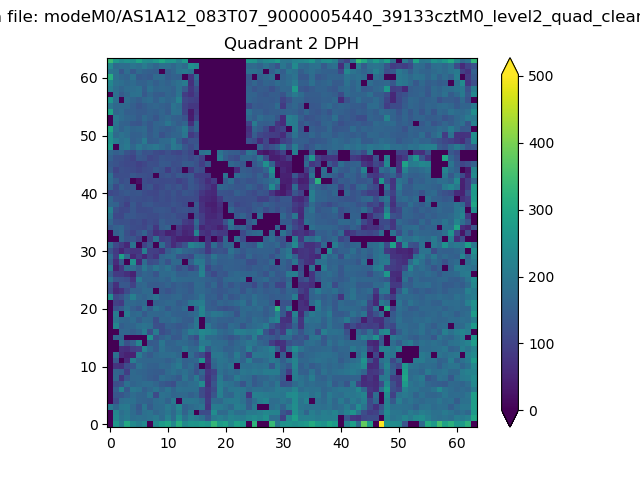
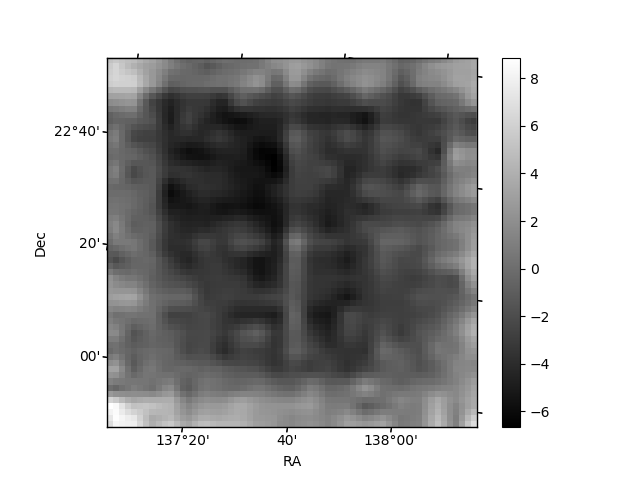
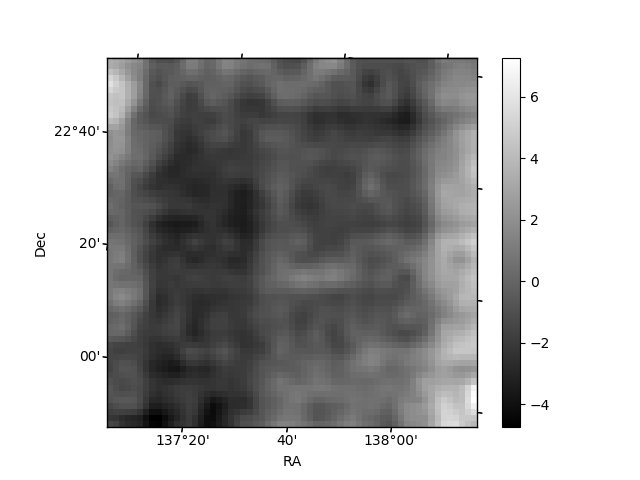
Histogram calculated using DETX and DETY for each event in the final _common_clean file
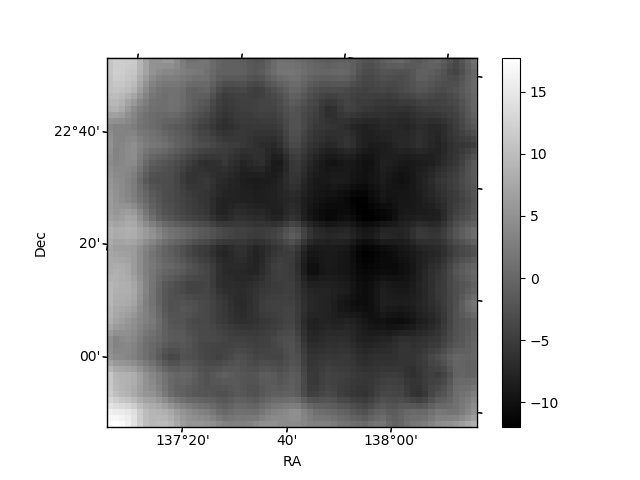
| Quadrant A | 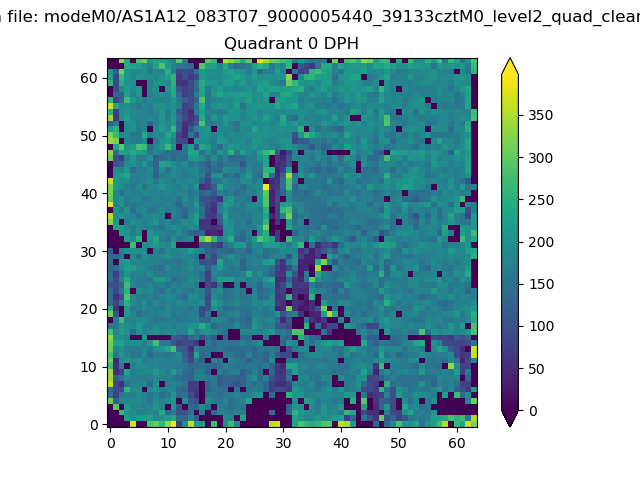 |
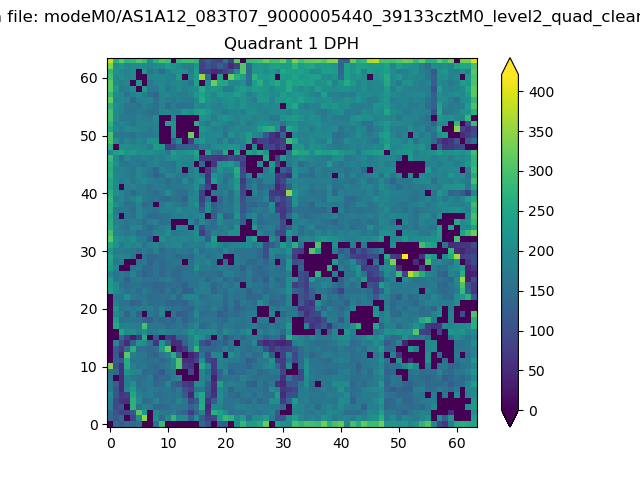 |
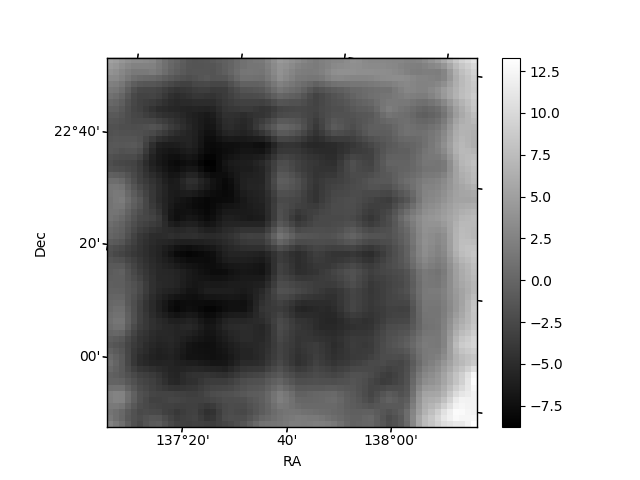
Quadrant B |
|---|---|---|---|
| Quadrant D | 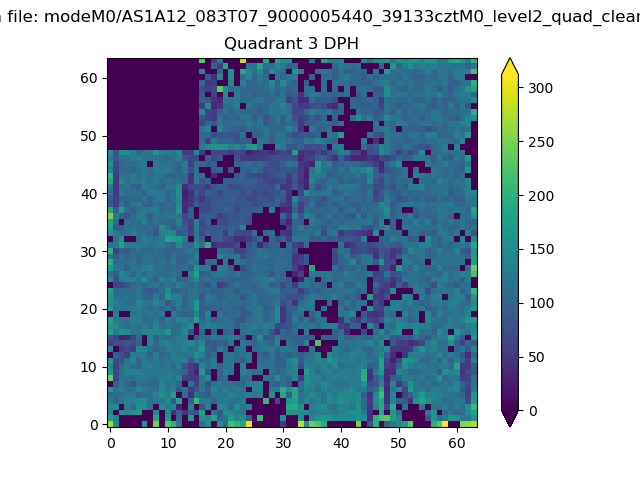 |
 |
Quadrant C |
| Plot type | Count rate plots | Images |
|---|---|---|
| Comparison with Poisson distribution Blue bars denote a histogram of data divided into 1 sec bins. Red curve is a Poisson curve with rate = median count rate of data. |
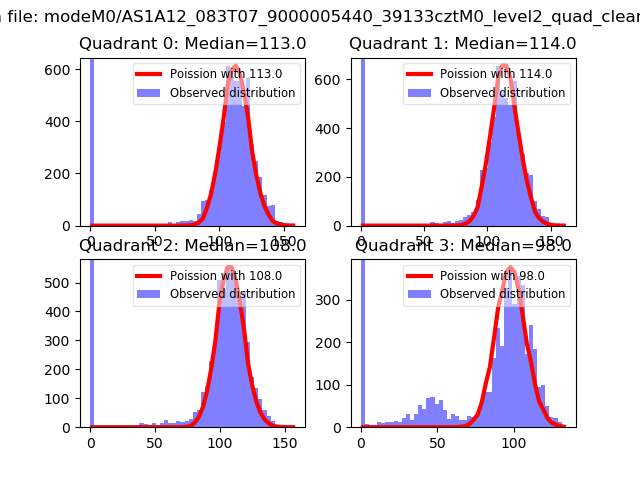 |
 |
| Quadrant-wise count rates Data is divided into 100 sec bins |
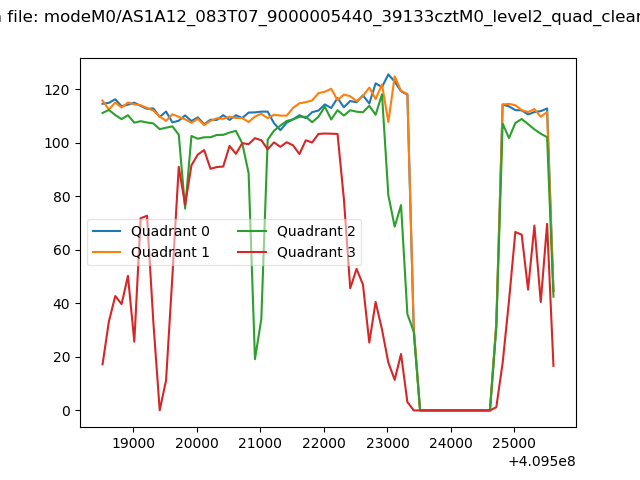 |
|
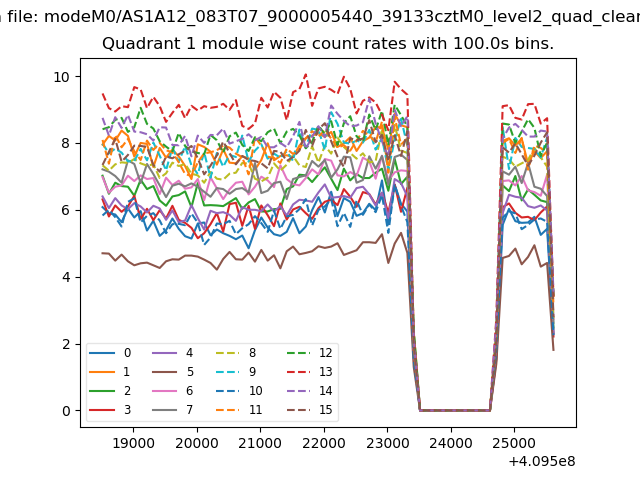
| Module-wise count rates for Quadrant A Data is divided into 100 sec bins |
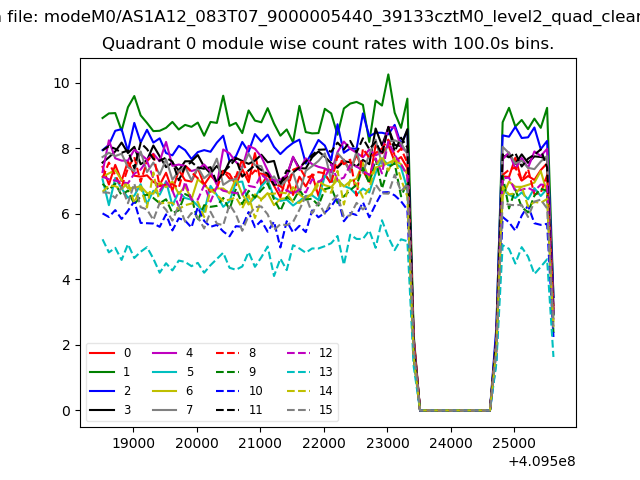 |
 |
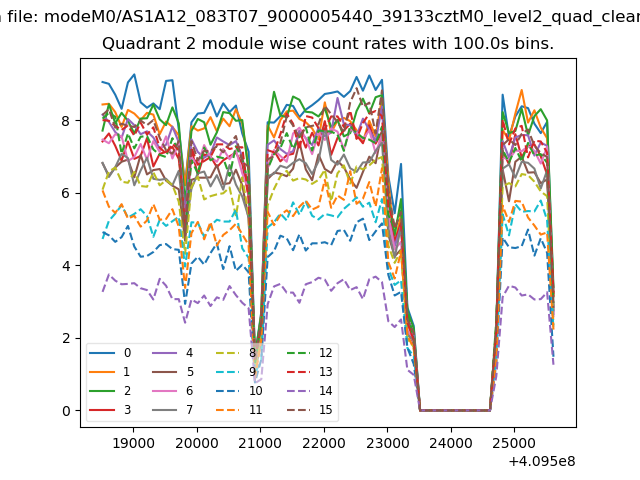
| Module-wise count rates for Quadrant B Data is divided into 100 sec bins |
 |
 |
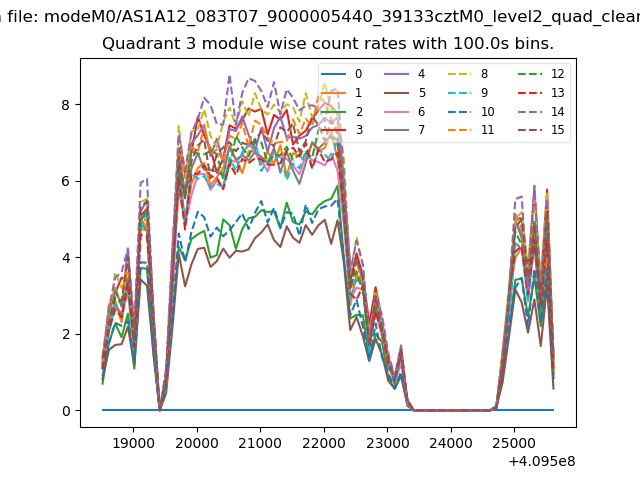
| Module-wise count rates for Quadrant C Data is divided into 100 sec bins |
 |
 |
| Module-wise count rates for Quadrant D Data is divided into 100 sec bins |
 |
 |
| Parameter | Plot |
|---|---|
| CZT HV Monitor | 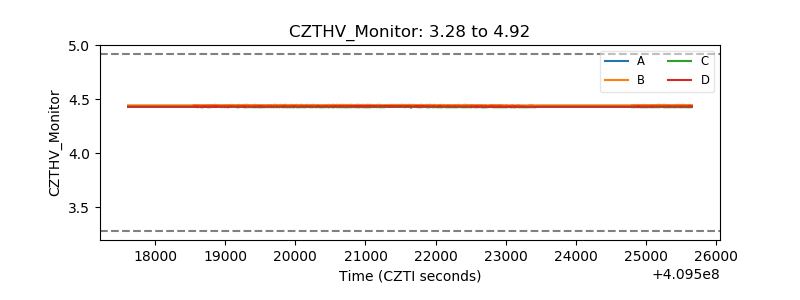 |
| D_VDD | 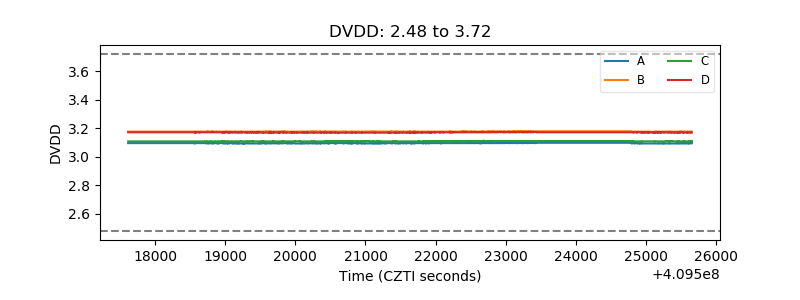 |
| Temperature 1 | 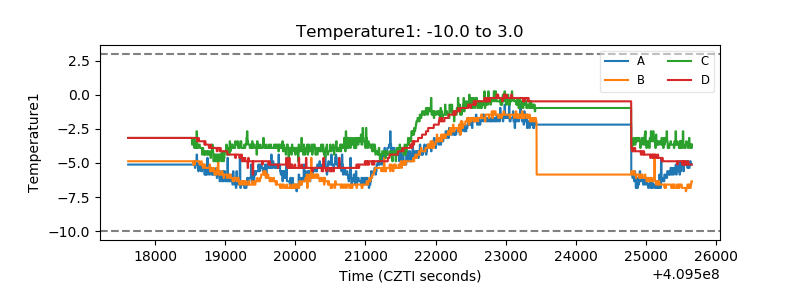 |
| Veto HV Monitor | 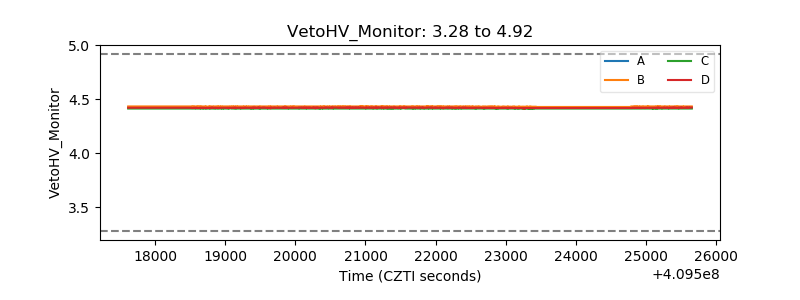 |
| Veto LLD | 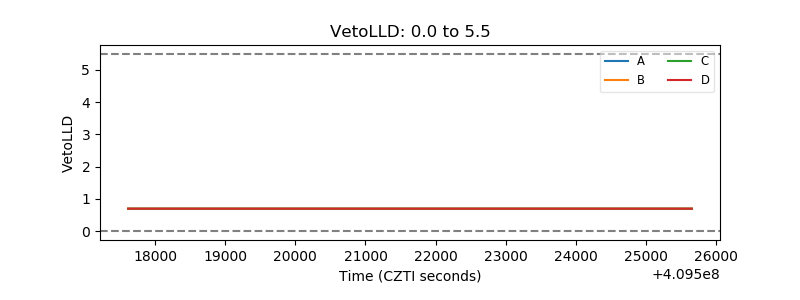 |
| Alpha Counter | 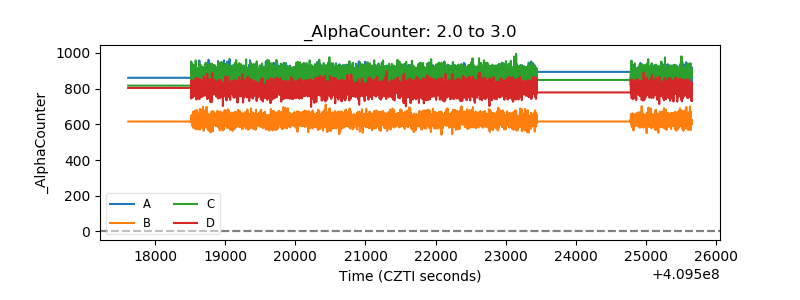 |
| _CPM_Rate | 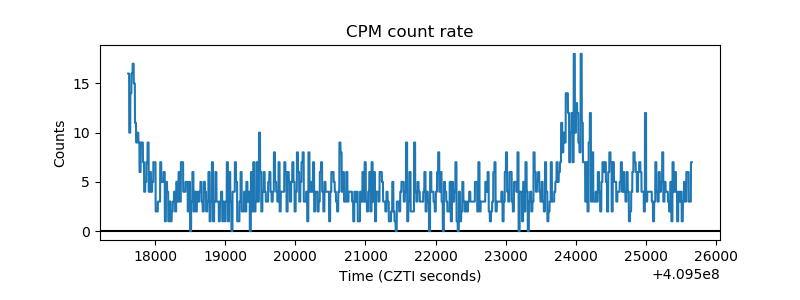 |
| CZT Counter | 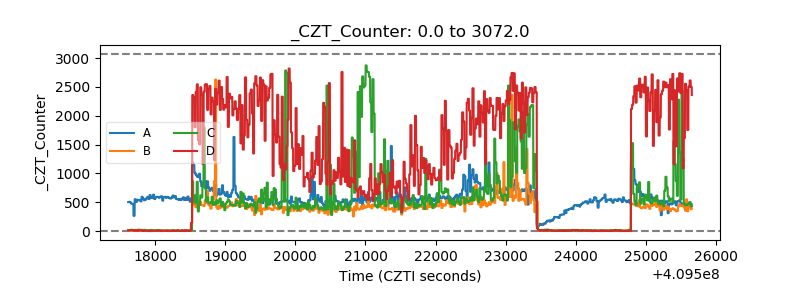 |
| +2.5 Volts monitor |  |
| +5 Volts monitor | 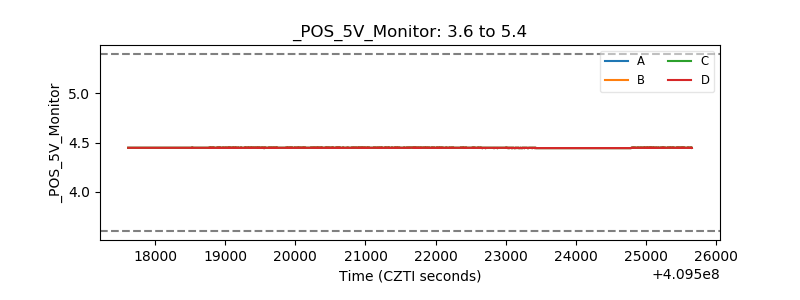 |
| _ROLL_ROT | 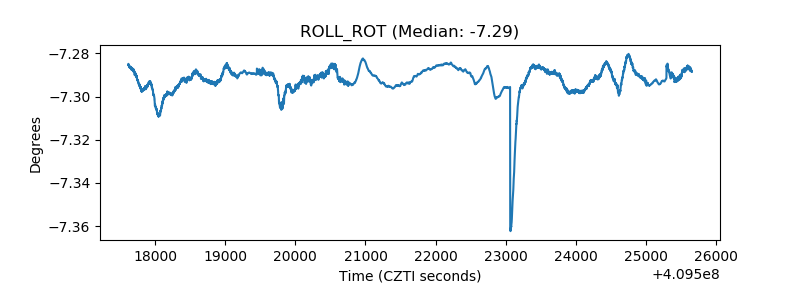 |
| _Roll_DEC | 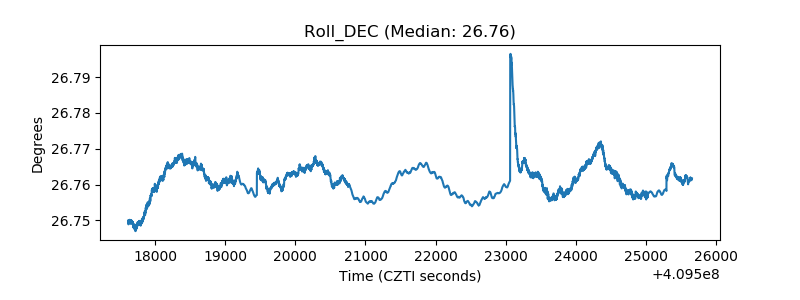 |
| _Roll_RA | 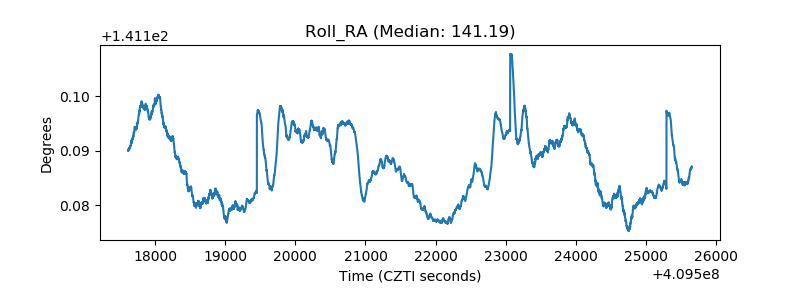 |
| Veto Counter | 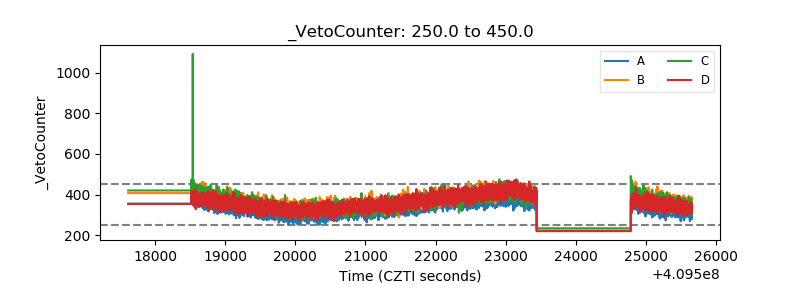 |