| Param | Original file | Final file |
|---|---|---|
| Filename | modeM0/AS1A12_083T07_9000005440_39136cztM0_level2.fits | modeM0/AS1A12_083T07_9000005440_39136cztM0_level2_quad_clean.evt |
| Size (bytes) | 618,632,640 | 83,488,320 |
| Size | 590.0 MB | 79.6 MB |
| Events in quadrant A | 3,022,188 | 638,625 |
| Events in quadrant B | 2,547,634 | 646,216 |
| Events in quadrant C | 5,594,577 | 515,383 |
| Events in quadrant D | 11,293,246 | 328,325 |
| Mode M0 | |||
|---|---|---|---|
| Quadrant | BADHDUFLAG | Total packets | Discarded packets |
| A | 0 | 12634 | 2 |
| B | 0 | 11596 | 2 |
| C | 0 | 20476 | 2 |
| D | 0 | 37447 | 2 |
| Mode M9 | |||
|---|---|---|---|
| Quadrant | BADHDUFLAG | Total packets | Discarded packets |
| A | 0 | 26 | 0 |
| B | 0 | 26 | 0 |
| C | 0 | 26 | 0 |
| D | 0 | 26 | 0 |
| Mode SS | |||
|---|---|---|---|
| Quadrant | BADHDUFLAG | Total packets | Discarded packets |
| A | 0 | 120 | 0 |
| B | 0 | 120 | 0 |
| C | 0 | 120 | 0 |
| D | 0 | 120 | 0 |
| Quadrant | Total seconds | Saturated seconds | Saturation percentage |
|---|---|---|---|
| A | 5699 | 30 | 0.526408% |
| B | 5699 | 9 | 0.157922% |
| C | 5699 | 976 | 17.125812% |
| D | 5699 | 2815 | 49.394631% |
Noise dominated data is calculated using 1-second bins in cleaned event files. If a bin has >2000 counts, and if more than 50% of those come from <1% of pixels, then it is considered to be noise-dominated and hence unusable.
| Quadrant | # 1 sec bins | Bins with >0 counts | Bins with >2000 counts | High rate bins dominated by noise | Noise dominated (total time) | Noise dominated (detector-on time) | Marked lightcurve |
|---|---|---|---|---|---|---|---|
| A | 8355 | 5701 | 17 | 17 | 0.20% | 0.30% | 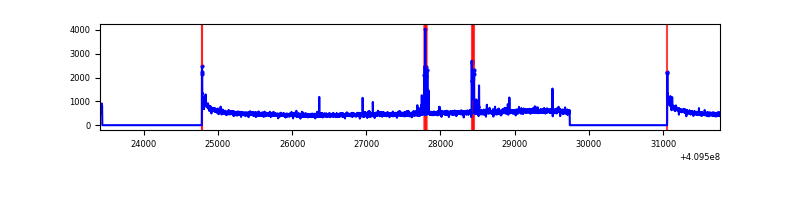 |
| B | 8355 | 5701 | 2 | 2 | 0.02% | 0.04% | 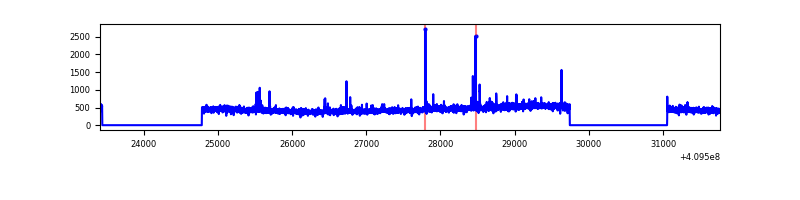 |
| C | 8355 | 5701 | 782 | 782 | 9.36% | 13.72% | 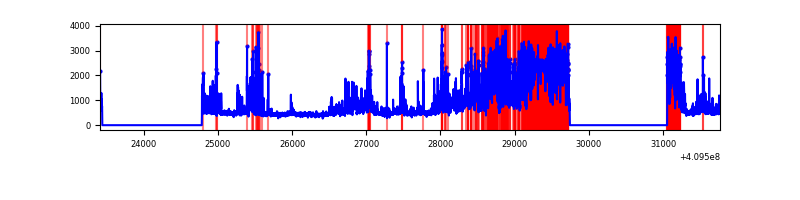 |
| D | 8355 | 5700 | 2723 | 2723 | 32.59% | 47.77% | 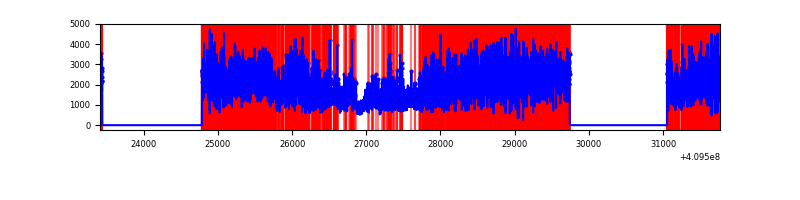 |
Top three noisy pixels from each quadrant. If the there are fewer than three noisy pixels in the level2.evt file, extra rows are filled as -1
| Pixel properties | Quadrant properties | ||||||
|---|---|---|---|---|---|---|---|
| Quadrant | DetID | PixID | Counts | Sigma | Mean | Median | Sigma |
| A | 10 | 83 | 446363 | 3473.7 | 631 | 618 | 128.3 |
| A | 14 | 235 | 90413 | 699.77 | 631 | 618 | 128.3 |
| A | 15 | 223 | 23613 | 179.2 | 631 | 618 | 128.3 |
| B | 5 | 172 | 44008 | 353.71 | 628 | 609 | 122.7 |
| B | 12 | 111 | 15315 | 119.86 | 628 | 609 | 122.7 |
| B | 11 | 111 | 14005 | 109.18 | 628 | 609 | 122.7 |
| C | 9 | 187 | 3125559 | 23879.8 | 559 | 562 | 130.9 |
| C | 15 | 214 | 220017 | 1676.98 | 559 | 562 | 130.9 |
| C | 1 | 16 | 63803 | 483.26 | 559 | 562 | 130.9 |
| D | 12 | 235 | 8362988 | 70506.91 | 481 | 468 | 118.6 |
| D | 5 | 222 | 766364 | 6457.5 | 481 | 468 | 118.6 |
| D | 2 | 249 | 87430 | 733.2 | 481 | 468 | 118.6 |
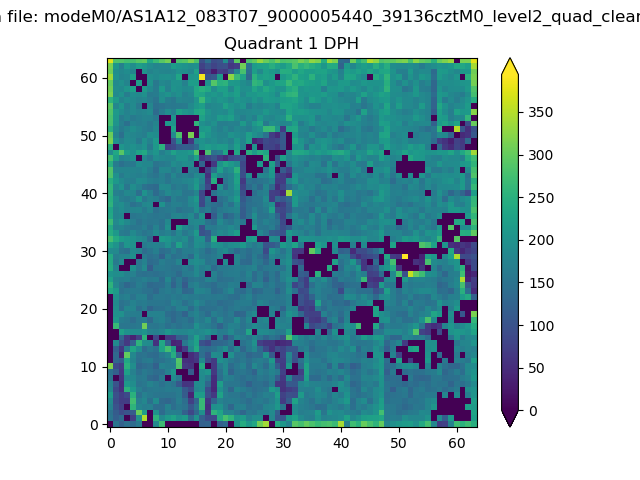
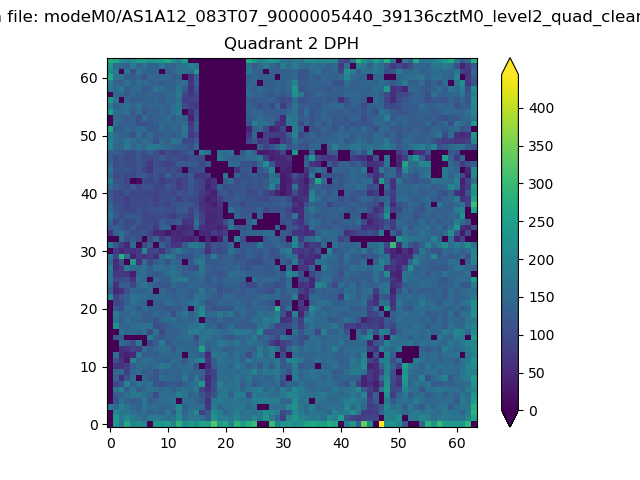
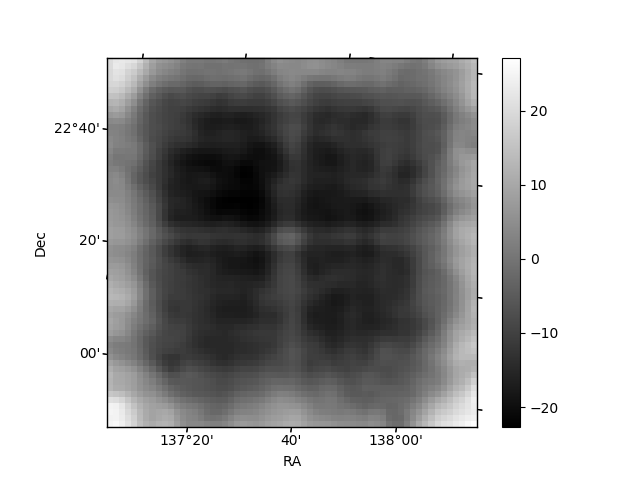
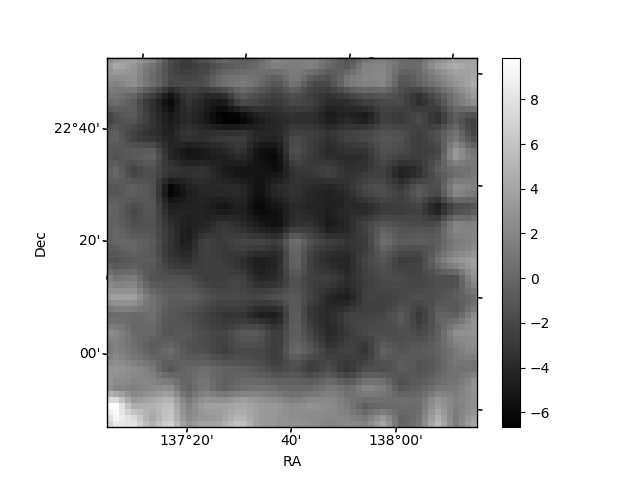
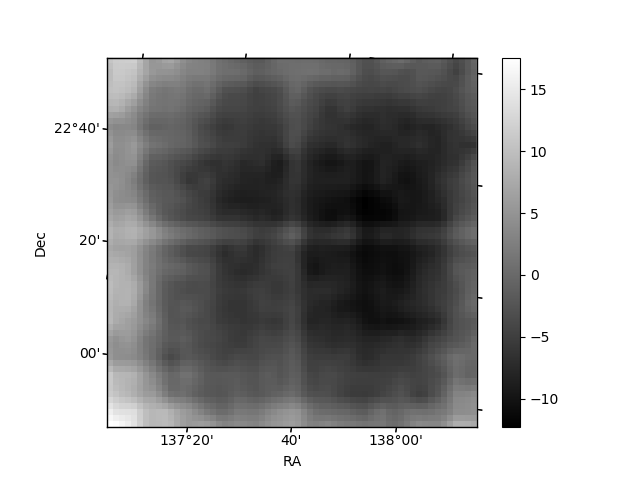
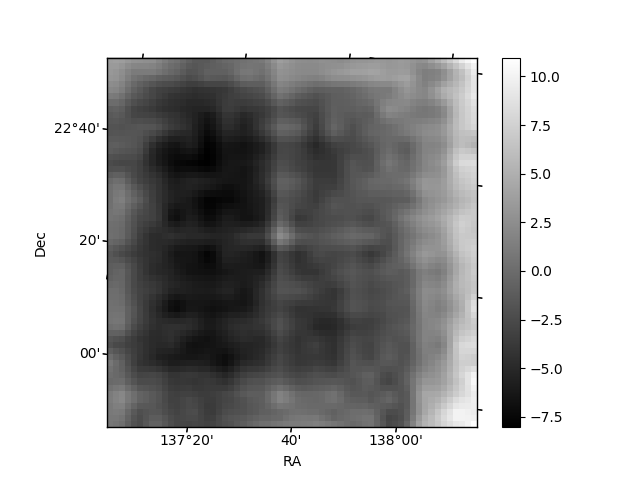
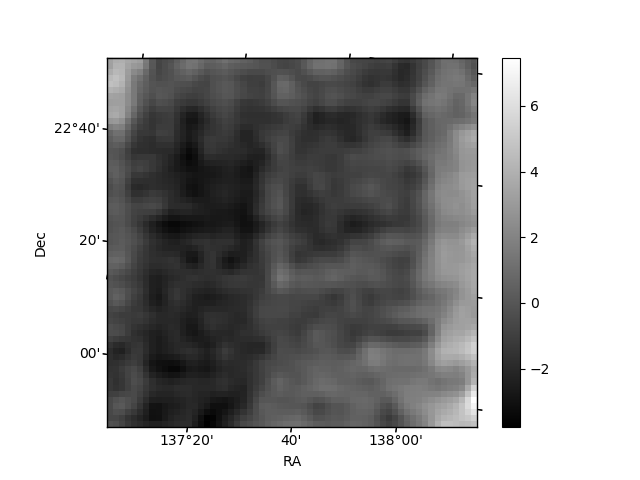
Histogram calculated using DETX and DETY for each event in the final _common_clean file
| Quadrant A |  |
 |
Quadrant B |
|---|---|---|---|
| Quadrant D | 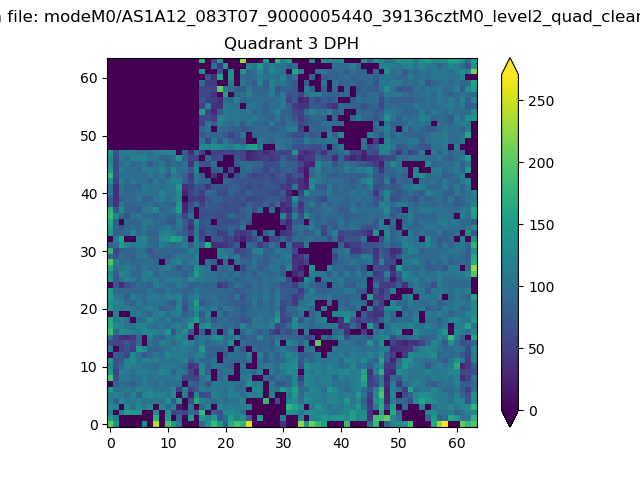 |
 |
Quadrant C |
| Plot type | Count rate plots | Images |
|---|---|---|
| Comparison with Poisson distribution Blue bars denote a histogram of data divided into 1 sec bins. Red curve is a Poisson curve with rate = median count rate of data. |
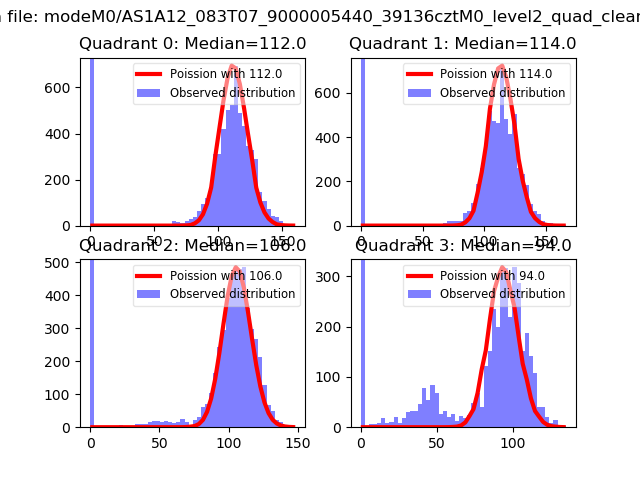 |
 |
| Quadrant-wise count rates Data is divided into 100 sec bins |
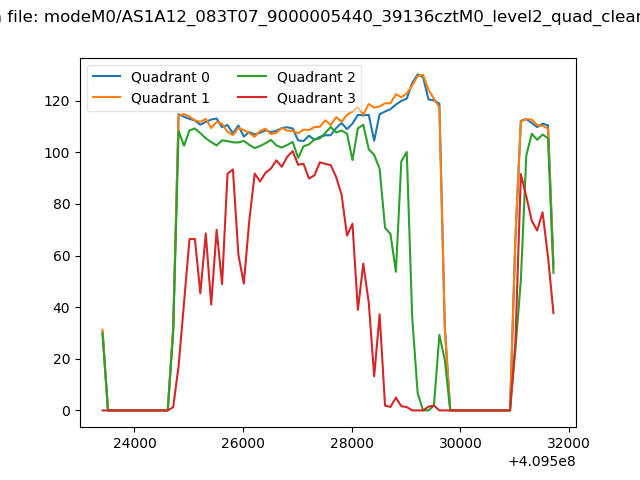 |
|
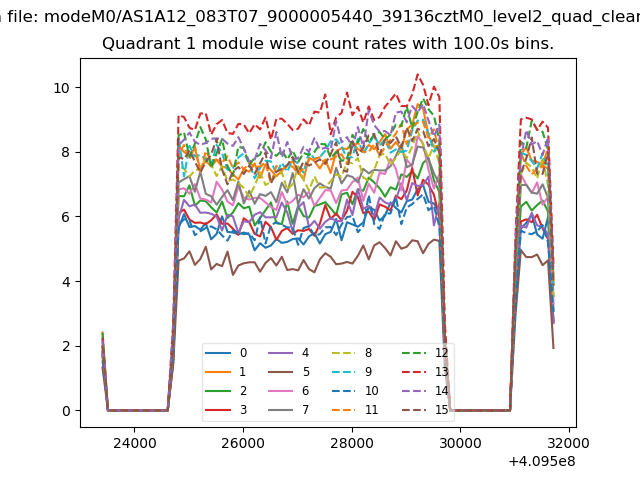
| Module-wise count rates for Quadrant A Data is divided into 100 sec bins |
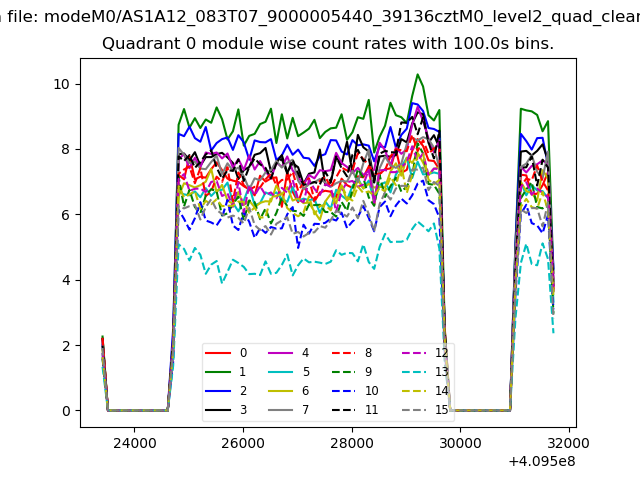 |
 |
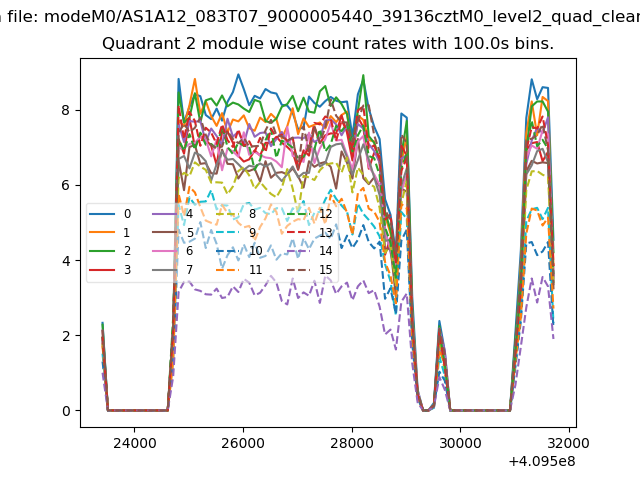
| Module-wise count rates for Quadrant B Data is divided into 100 sec bins |
 |
 |
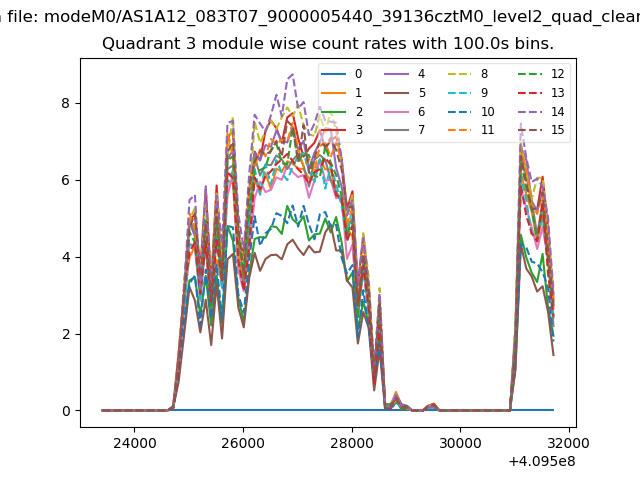
| Module-wise count rates for Quadrant C Data is divided into 100 sec bins |
 |
 |
| Module-wise count rates for Quadrant D Data is divided into 100 sec bins |
 |
 |
| Parameter | Plot |
|---|---|
| CZT HV Monitor | 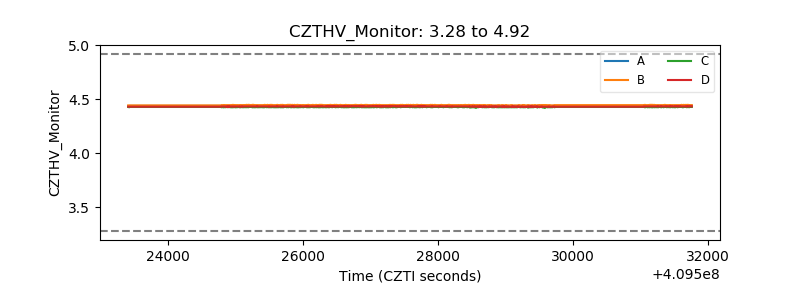 |
| D_VDD | 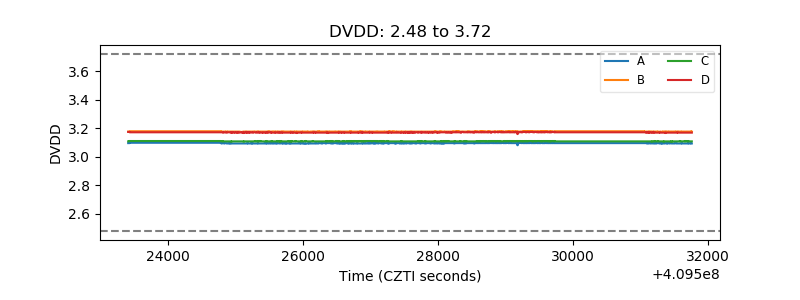 |
| Temperature 1 | 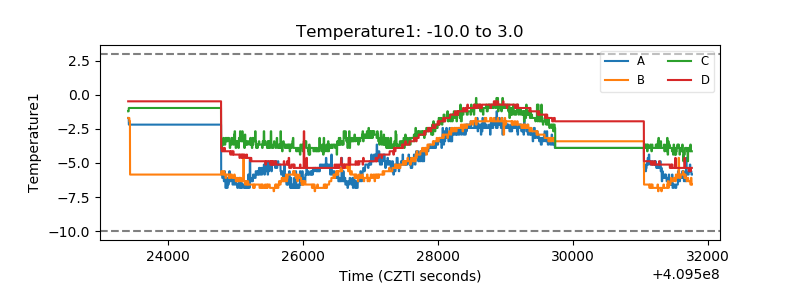 |
| Veto HV Monitor |  |
| Veto LLD | 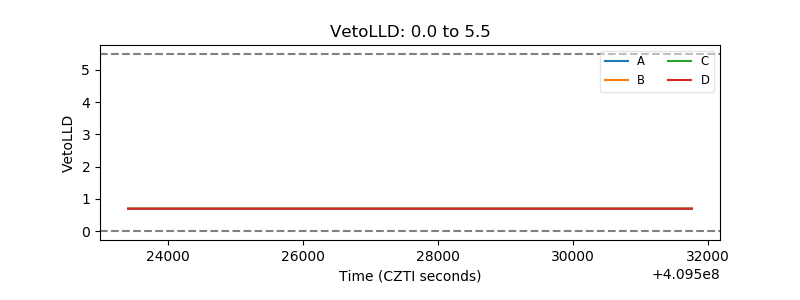 |
| Alpha Counter | 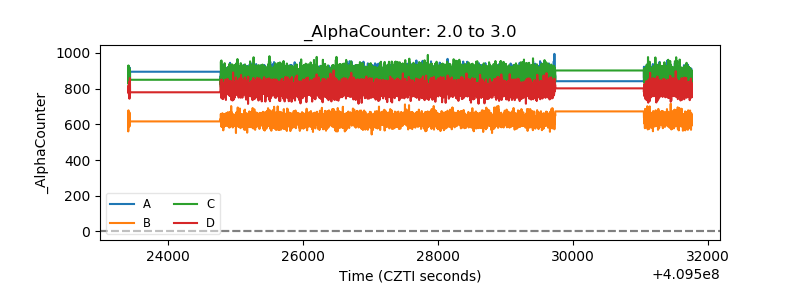 |
| _CPM_Rate | 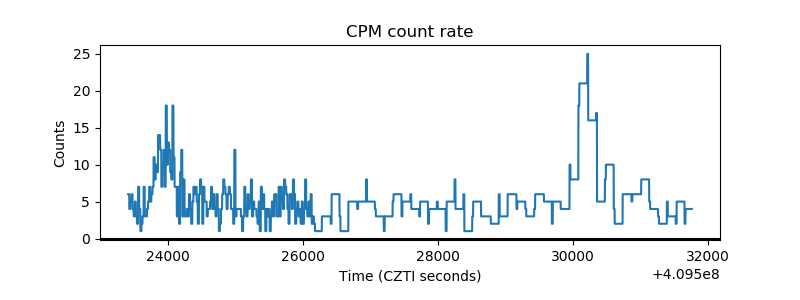 |
| CZT Counter | 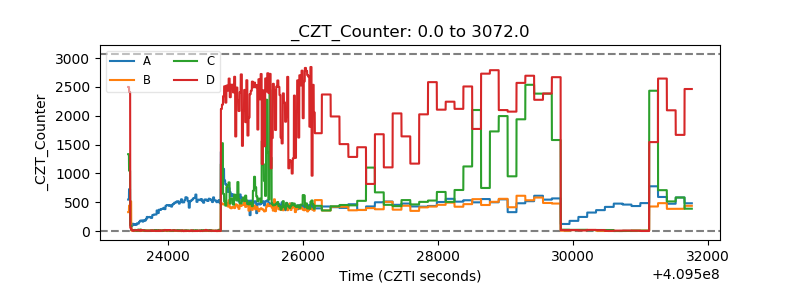 |
| +2.5 Volts monitor | 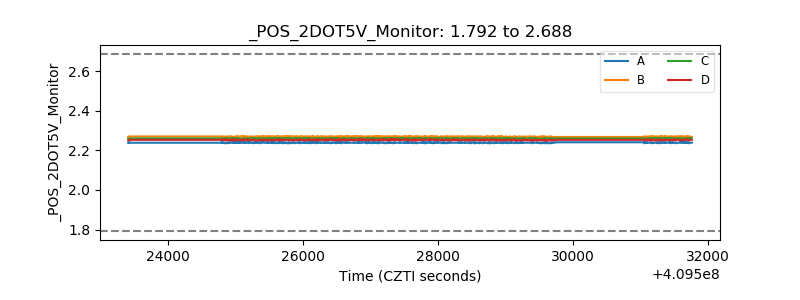 |
| +5 Volts monitor | 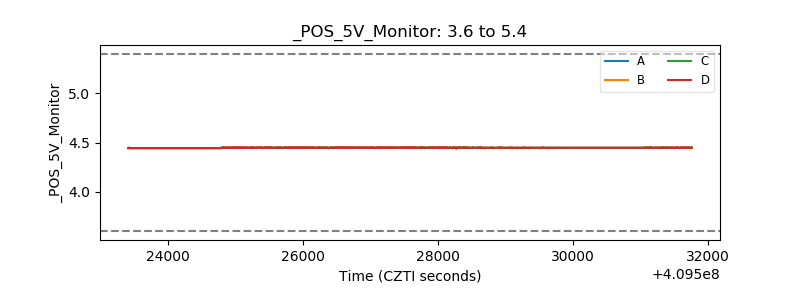 |
| _ROLL_ROT | 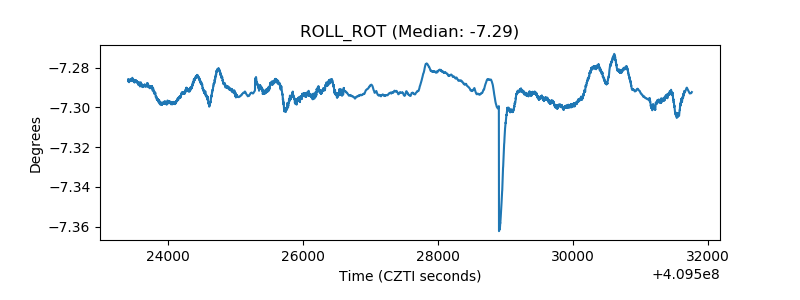 |
| _Roll_DEC | 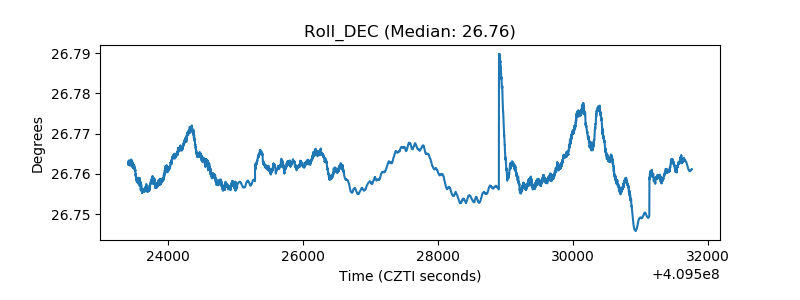 |
| _Roll_RA | 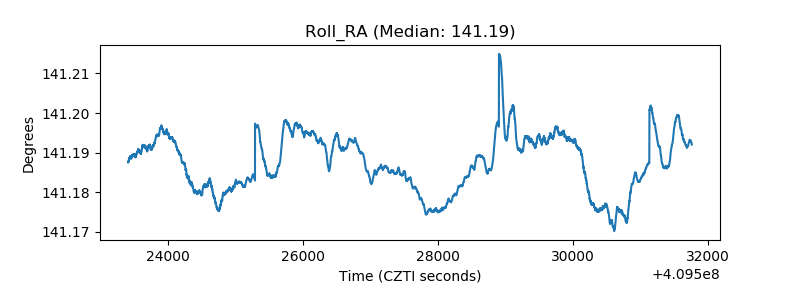 |
| Veto Counter | 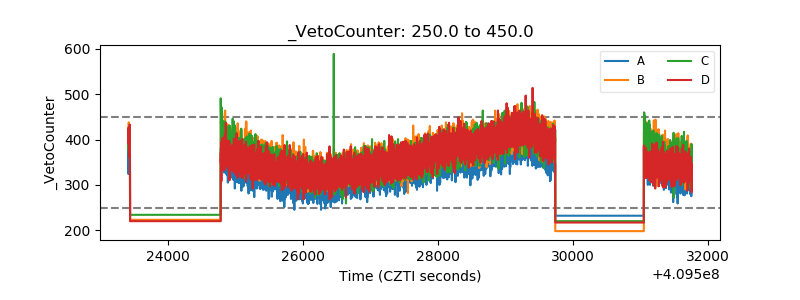 |