| Param | Original file | Final file |
|---|---|---|
| Filename | modeM0/AS1A12_083T07_9000005440_39137cztM0_level2.fits | modeM0/AS1A12_083T07_9000005440_39137cztM0_level2_quad_clean.evt |
| Size (bytes) | 1,022,685,120 | 148,075,200 |
| Size | 975.3 MB | 141.2 MB |
| Events in quadrant A | 5,648,223 | 1,112,063 |
| Events in quadrant B | 4,567,908 | 1,120,277 |
| Events in quadrant C | 9,039,218 | 920,028 |
| Events in quadrant D | 17,827,932 | 637,010 |
| Mode M0 | |||
|---|---|---|---|
| Quadrant | BADHDUFLAG | Total packets | Discarded packets |
| A | 0 | 23089 | 2 |
| B | 0 | 20769 | 2 |
| C | 0 | 33628 | 2 |
| D | 0 | 59870 | 2 |
| Mode M9 | |||
|---|---|---|---|
| Quadrant | BADHDUFLAG | Total packets | Discarded packets |
| A | 0 | 26 | 0 |
| B | 0 | 26 | 0 |
| C | 0 | 26 | 0 |
| D | 0 | 26 | 0 |
| Mode SS | |||
|---|---|---|---|
| Quadrant | BADHDUFLAG | Total packets | Discarded packets |
| A | 0 | 206 | 0 |
| B | 0 | 206 | 0 |
| C | 0 | 206 | 0 |
| D | 0 | 206 | 0 |
| Quadrant | Total seconds | Saturated seconds | Saturation percentage |
|---|---|---|---|
| A | 10003 | 46 | 0.459862% |
| B | 10003 | 51 | 0.509847% |
| C | 10003 | 1415 | 14.145756% |
| D | 10003 | 4202 | 42.007398% |
Noise dominated data is calculated using 1-second bins in cleaned event files. If a bin has >2000 counts, and if more than 50% of those come from <1% of pixels, then it is considered to be noise-dominated and hence unusable.
| Quadrant | # 1 sec bins | Bins with >0 counts | Bins with >2000 counts | High rate bins dominated by noise | Noise dominated (total time) | Noise dominated (detector-on time) | Marked lightcurve |
|---|---|---|---|---|---|---|---|
| A | 12659 | 10005 | 22 | 22 | 0.17% | 0.22% | 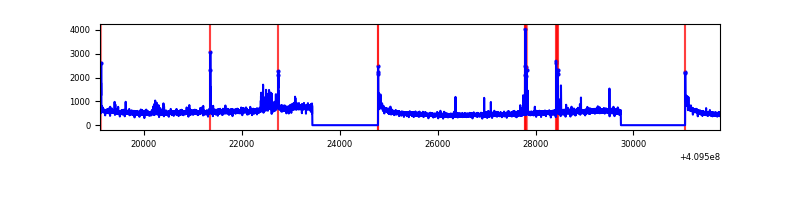 |
| B | 12659 | 10005 | 22 | 22 | 0.17% | 0.22% | 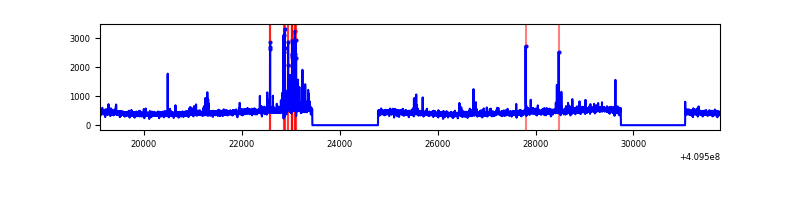 |
| C | 12659 | 10005 | 1091 | 1091 | 8.62% | 10.90% | 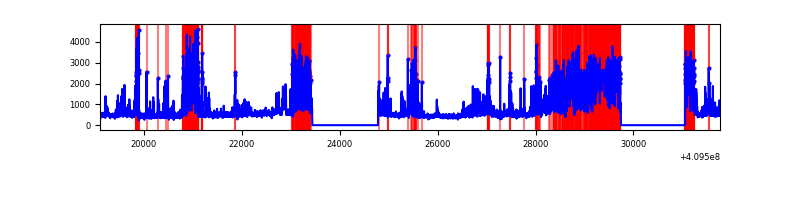 |
| D | 12659 | 10004 | 3796 | 3796 | 29.99% | 37.94% | 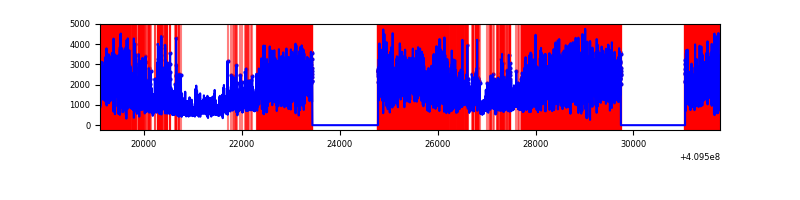 |
Top three noisy pixels from each quadrant. If the there are fewer than three noisy pixels in the level2.evt file, extra rows are filled as -1
| Pixel properties | Quadrant properties | ||||||
|---|---|---|---|---|---|---|---|
| Quadrant | DetID | PixID | Counts | Sigma | Mean | Median | Sigma |
| A | 10 | 83 | 665873 | 2976.51 | 1105 | 1084 | 223.3 |
| A | 15 | 223 | 450237 | 2011.03 | 1105 | 1084 | 223.3 |
| A | 14 | 235 | 211140 | 940.5 | 1105 | 1084 | 223.3 |
| B | 5 | 172 | 190115 | 895.75 | 1097 | 1067 | 211.0 |
| B | 12 | 111 | 26799 | 121.92 | 1097 | 1067 | 211.0 |
| B | 11 | 111 | 24358 | 110.36 | 1097 | 1067 | 211.0 |
| C | 9 | 187 | 4692424 | 20335.01 | 994 | 1000 | 230.7 |
| C | 15 | 214 | 383187 | 1656.59 | 994 | 1000 | 230.7 |
| C | 1 | 16 | 64686 | 276.05 | 994 | 1000 | 230.7 |
| D | 12 | 235 | 11740400 | 54676.37 | 879 | 855 | 214.7 |
| D | 5 | 222 | 981467 | 4567.15 | 879 | 855 | 214.7 |
| D | 12 | 33 | 968546 | 4506.97 | 879 | 855 | 214.7 |
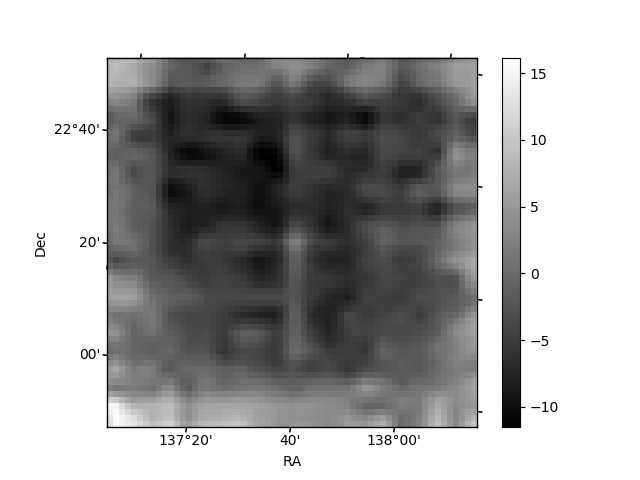
Histogram calculated using DETX and DETY for each event in the final _common_clean file
| Quadrant A | 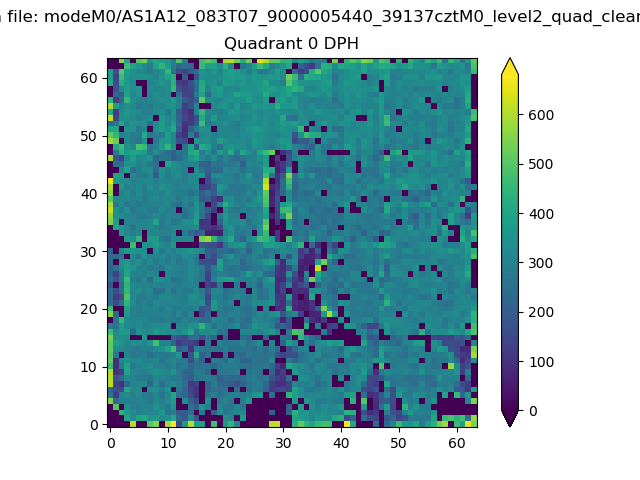 |
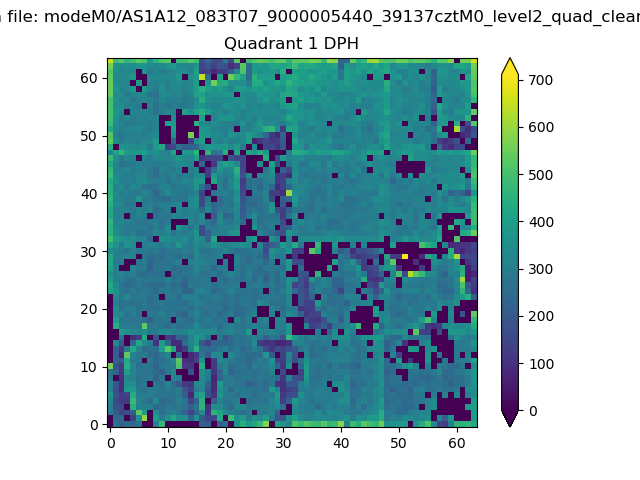 |
Quadrant B |
|---|---|---|---|
| Quadrant D | 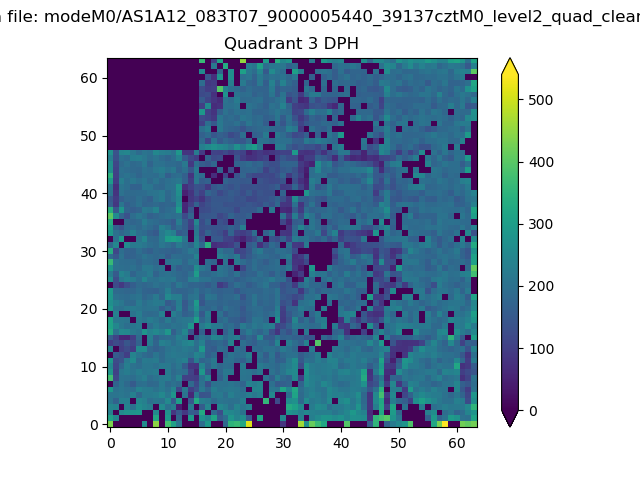 |
 |
Quadrant C |
| Plot type | Count rate plots | Images |
|---|---|---|
| Comparison with Poisson distribution Blue bars denote a histogram of data divided into 1 sec bins. Red curve is a Poisson curve with rate = median count rate of data. |
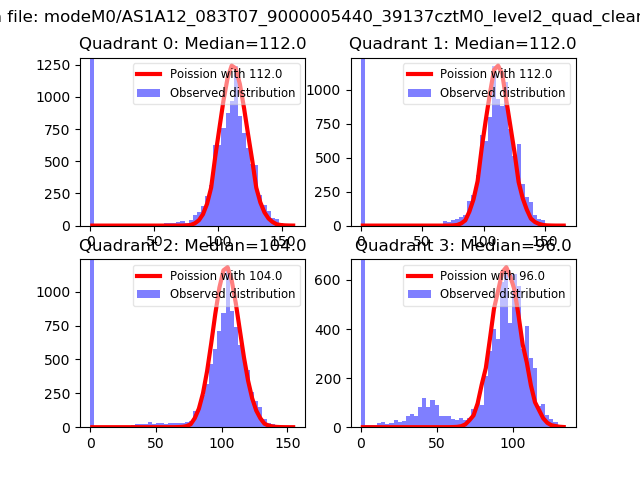 |
 |
| Quadrant-wise count rates Data is divided into 100 sec bins |
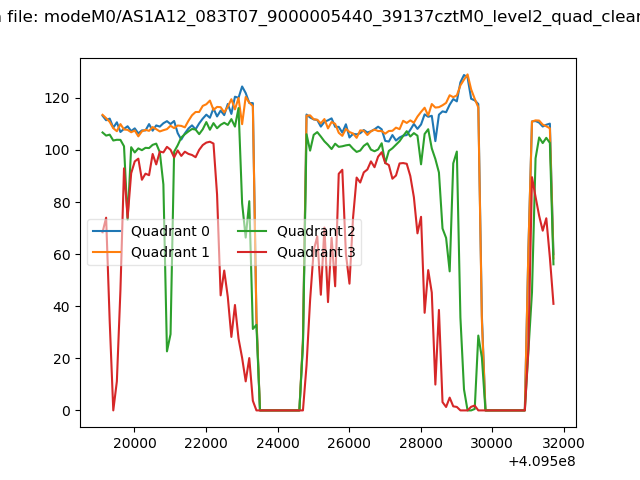 |
|
| Module-wise count rates for Quadrant A Data is divided into 100 sec bins |
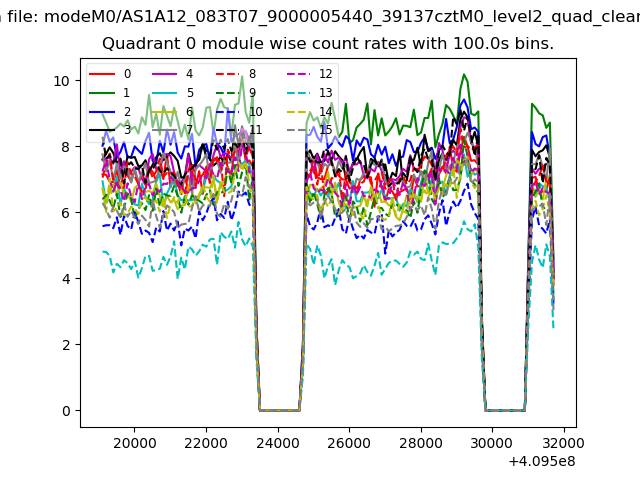 |
 |
| Module-wise count rates for Quadrant B Data is divided into 100 sec bins |
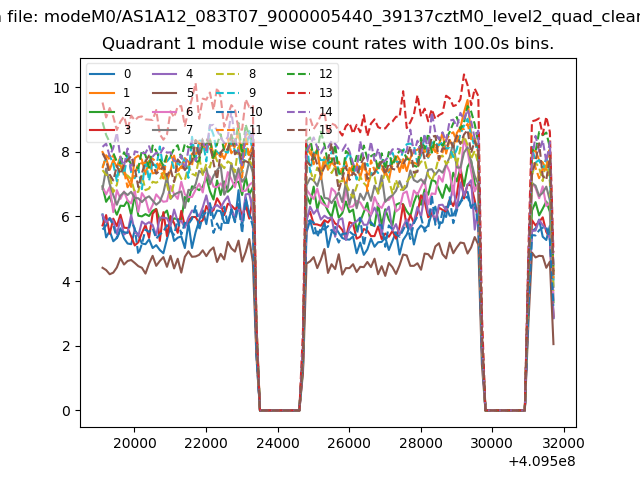 |
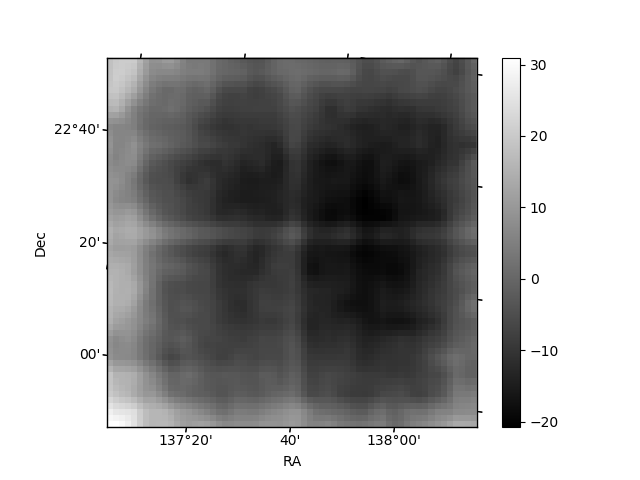 |
| Module-wise count rates for Quadrant C Data is divided into 100 sec bins |
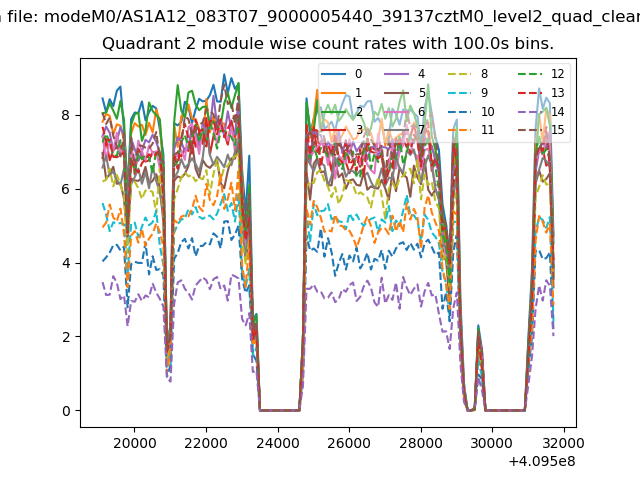 |
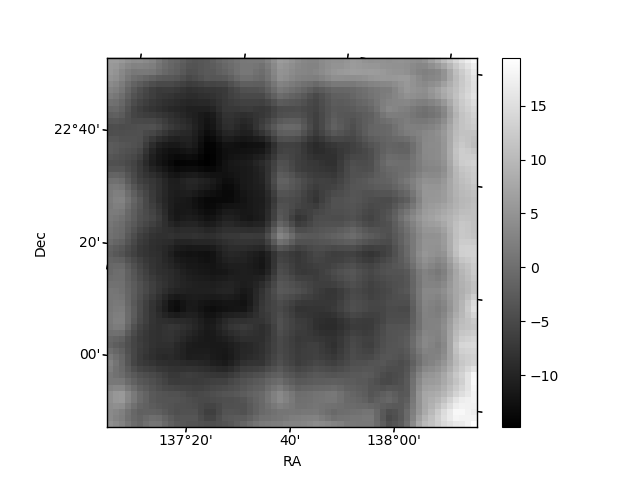 |
| Module-wise count rates for Quadrant D Data is divided into 100 sec bins |
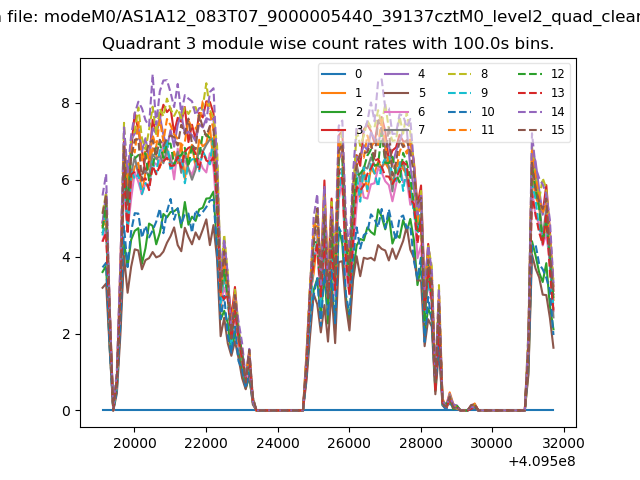 |
 |
| Parameter | Plot |
|---|---|
| CZT HV Monitor | 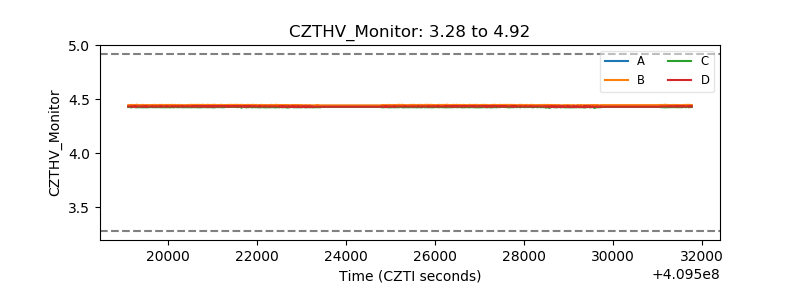 |
| D_VDD | 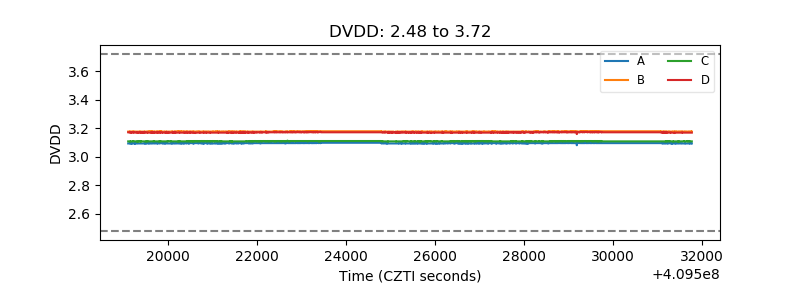 |
| Temperature 1 | 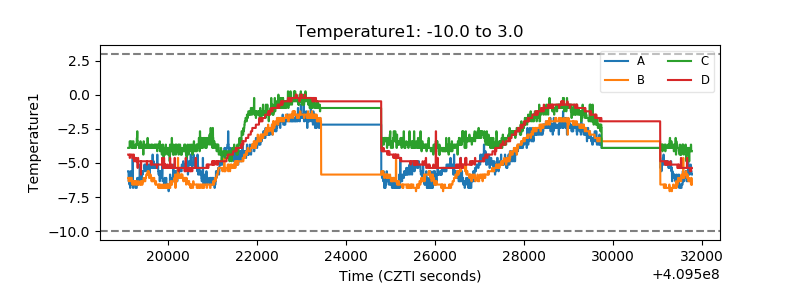 |
| Veto HV Monitor | 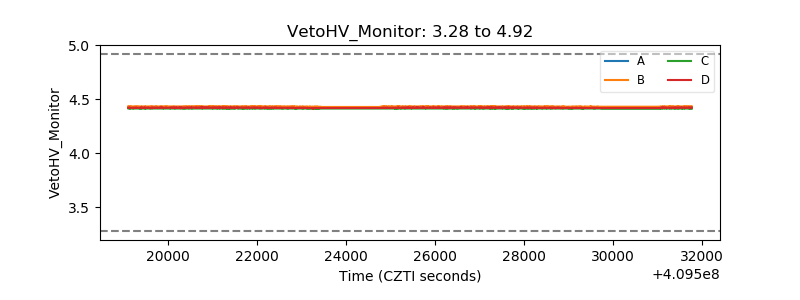 |
| Veto LLD | 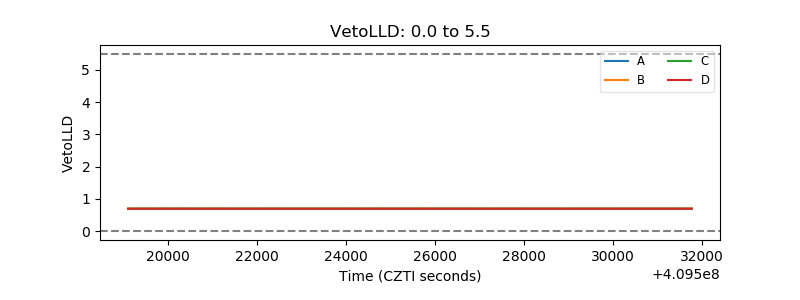 |
| Alpha Counter | 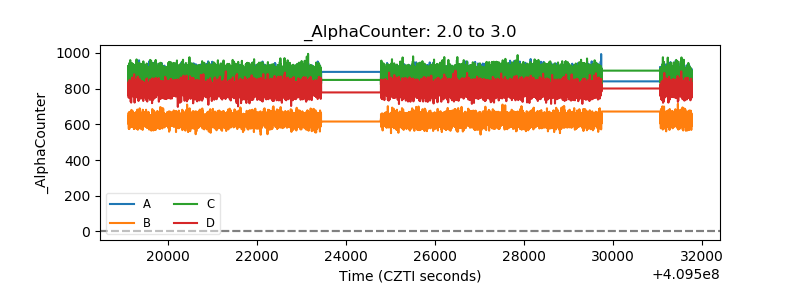 |
| _CPM_Rate | 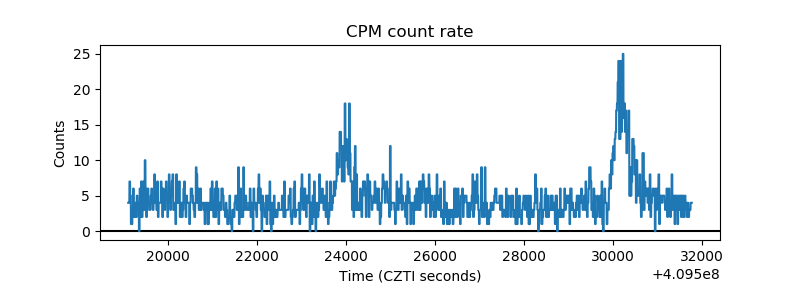 |
| CZT Counter | 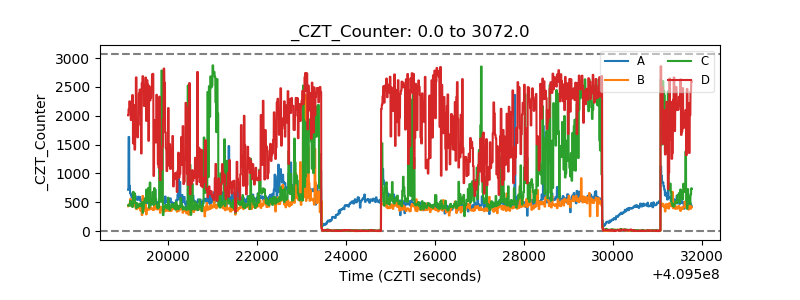 |
| +2.5 Volts monitor |  |
| +5 Volts monitor | 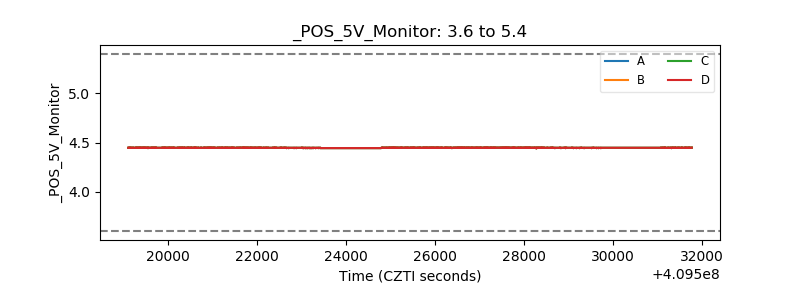 |
| _ROLL_ROT | 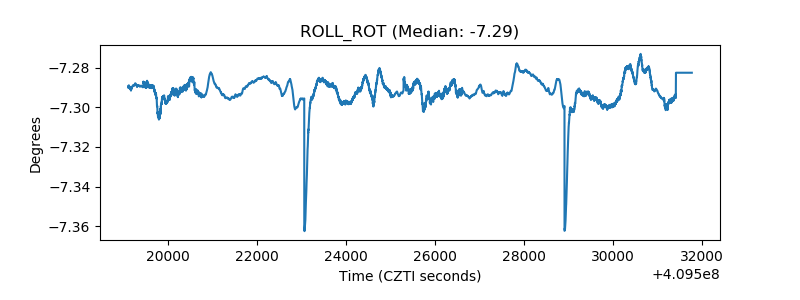 |
| _Roll_DEC | 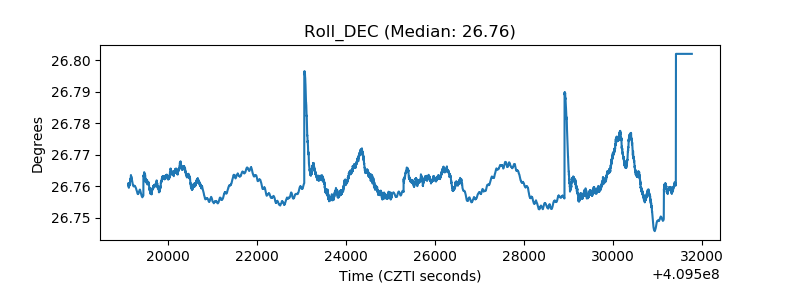 |
| _Roll_RA |  |
| Veto Counter | 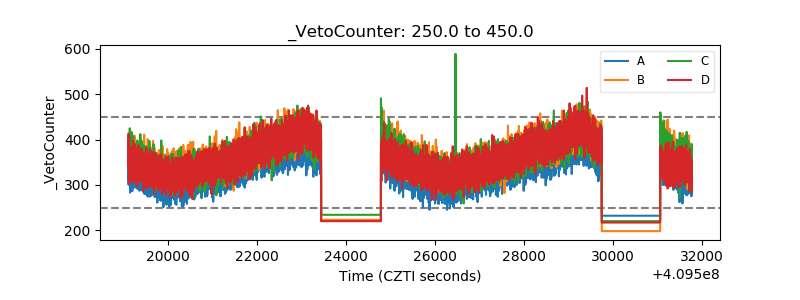 |