| Param | Original file | Final file |
|---|---|---|
| Filename | modeM0/AS1C06_010T05_9000005436_39126cztM0_level2.fits | modeM0/AS1C06_010T05_9000005436_39126cztM0_level2_quad_clean.evt |
| Size (bytes) | 54,941,760 | 16,891,200 |
| Size | 52.4 MB | 16.1 MB |
| Events in quadrant A | 545,001 | 115,601 |
| Events in quadrant B | 415,602 | 118,845 |
| Events in quadrant C | 430,569 | 109,188 |
| Events in quadrant D | 573,196 | 101,336 |
| Mode M0 | |||
|---|---|---|---|
| Quadrant | BADHDUFLAG | Total packets | Discarded packets |
| A | 0 | 2163 | 2 |
| B | 0 | 1731 | 1 |
| C | 0 | 1737 | 1 |
| D | 0 | 2289 | 1 |
| Mode M9 | |||
|---|---|---|---|
| Quadrant | BADHDUFLAG | Total packets | Discarded packets |
| A | 0 | 15 | 0 |
| B | 0 | 15 | 0 |
| C | 0 | 15 | 0 |
| D | 0 | 15 | 0 |
| Mode SS | |||
|---|---|---|---|
| Quadrant | BADHDUFLAG | Total packets | Discarded packets |
| A | 0 | 18 | 0 |
| B | 0 | 18 | 0 |
| C | 0 | 18 | 0 |
| D | 0 | 18 | 0 |
| Quadrant | Total seconds | Saturated seconds | Saturation percentage |
|---|---|---|---|
| A | 849 | 8 | 0.942285% |
| B | 849 | 1 | 0.117786% |
| C | 849 | 1 | 0.117786% |
| D | 849 | 16 | 1.884570% |
Noise dominated data is calculated using 1-second bins in cleaned event files. If a bin has >2000 counts, and if more than 50% of those come from <1% of pixels, then it is considered to be noise-dominated and hence unusable.
| Quadrant | # 1 sec bins | Bins with >0 counts | Bins with >2000 counts | High rate bins dominated by noise | Noise dominated (total time) | Noise dominated (detector-on time) | Marked lightcurve |
|---|---|---|---|---|---|---|---|
| A | 849 | 849 | 3 | 3 | 0.35% | 0.35% | 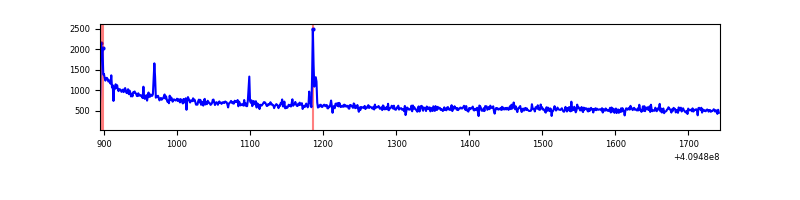 |
| B | 849 | 849 | 0 | 0 | 0.00% | 0.00% | 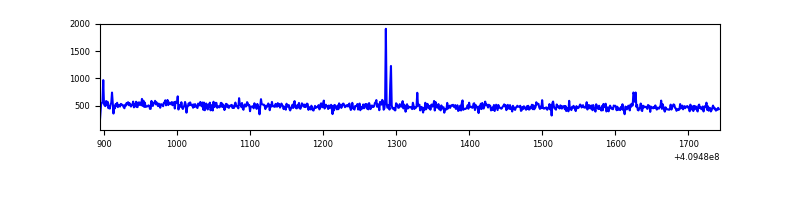 |
| C | 849 | 849 | 0 | 0 | 0.00% | 0.00% | 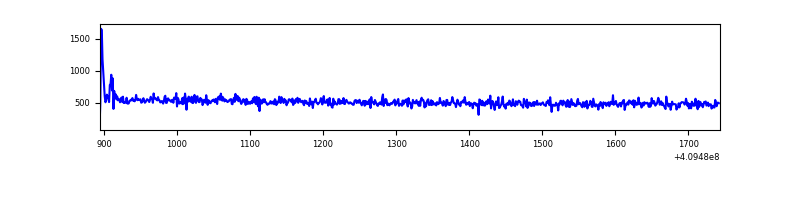 |
| D | 849 | 849 | 12 | 12 | 1.41% | 1.41% | 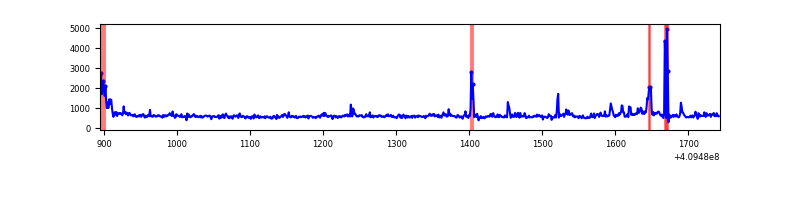 |
Top three noisy pixels from each quadrant. If the there are fewer than three noisy pixels in the level2.evt file, extra rows are filled as -1
| Pixel properties | Quadrant properties | ||||||
|---|---|---|---|---|---|---|---|
| Quadrant | DetID | PixID | Counts | Sigma | Mean | Median | Sigma |
| A | 10 | 83 | 117911 | 5086.86 | 107 | 105 | 23.2 |
| A | 9 | 143 | 8559 | 365.04 | 107 | 105 | 23.2 |
| A | 10 | 248 | 1970 | 80.53 | 107 | 105 | 23.2 |
| B | 6 | 51 | 3944 | 180.3 | 103 | 101 | 21.3 |
| B | 0 | 190 | 2734 | 123.53 | 103 | 101 | 21.3 |
| B | 12 | 111 | 2470 | 111.15 | 103 | 101 | 21.3 |
| C | 15 | 214 | 40805 | 1645.0 | 98 | 98 | 24.7 |
| C | 0 | 10 | 3713 | 146.08 | 98 | 98 | 24.7 |
| C | 9 | 187 | 2365 | 91.61 | 98 | 98 | 24.7 |
| D | 12 | 235 | 130142 | 5023.94 | 100 | 96 | 25.9 |
| D | 13 | 249 | 31390 | 1208.95 | 100 | 96 | 25.9 |
| D | 2 | 249 | 7571 | 288.77 | 100 | 96 | 25.9 |
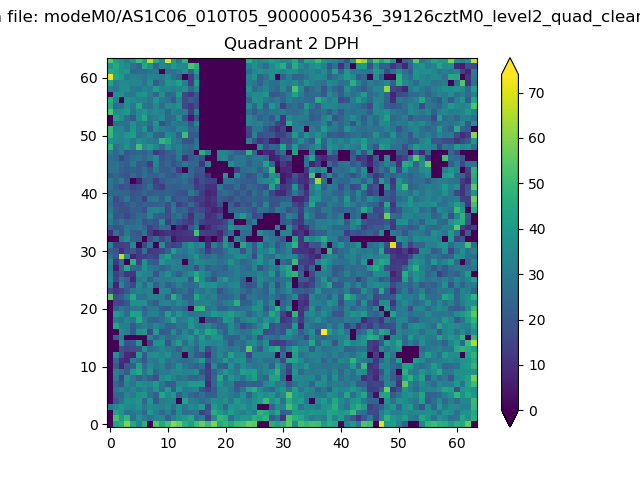
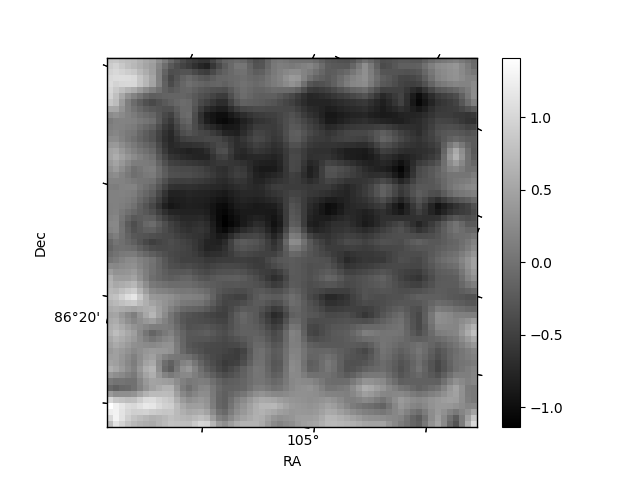
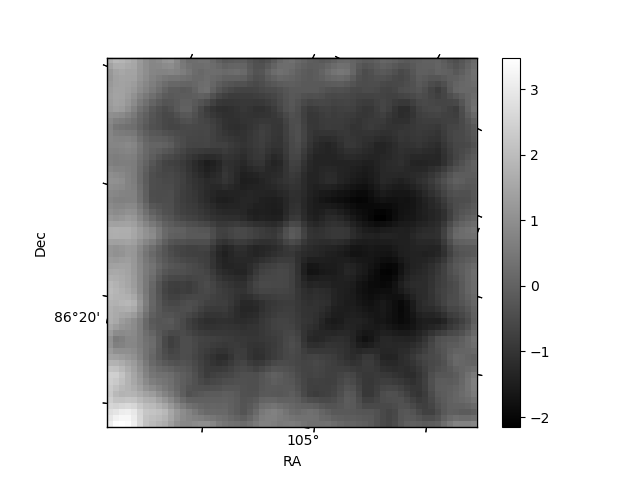
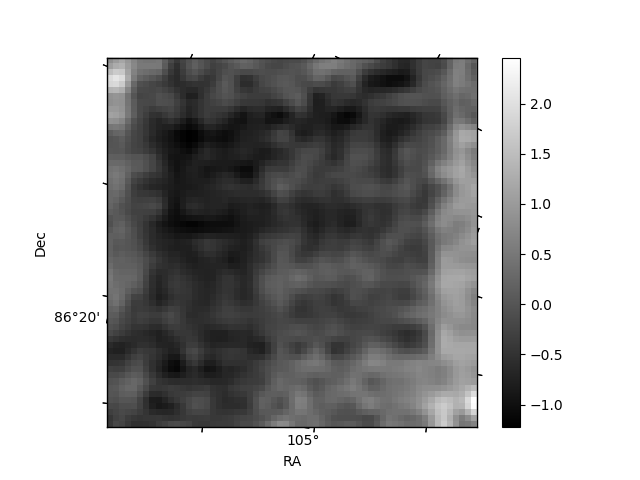
Histogram calculated using DETX and DETY for each event in the final _common_clean file
| Quadrant A | 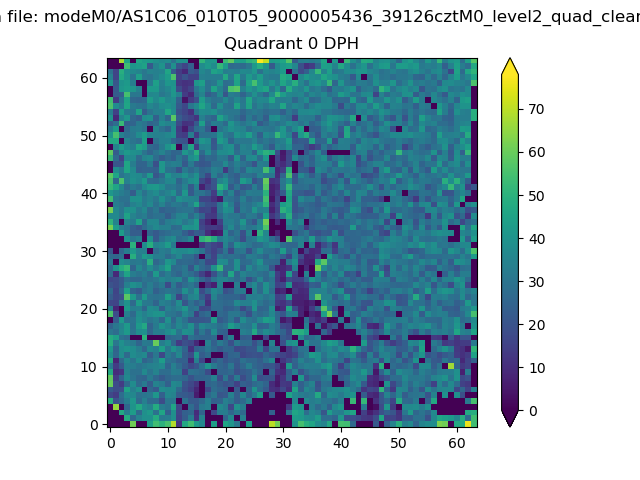 |
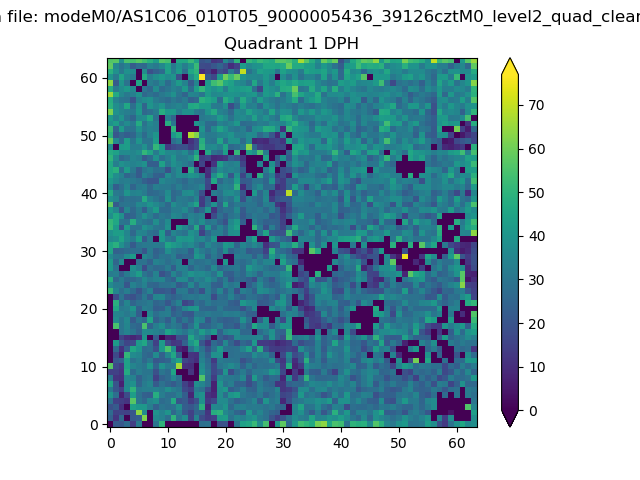 |
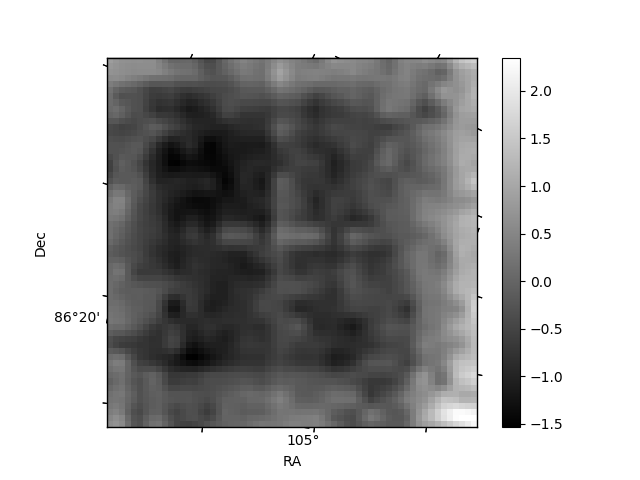
Quadrant B |
|---|---|---|---|
| Quadrant D | 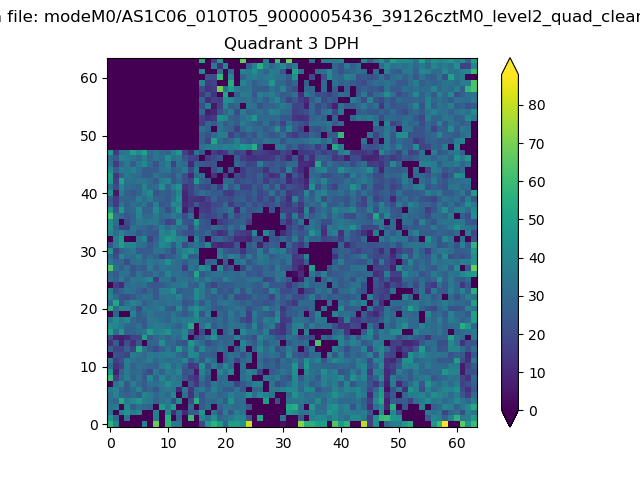 |
 |
Quadrant C |
| Plot type | Count rate plots | Images |
|---|---|---|
| Comparison with Poisson distribution Blue bars denote a histogram of data divided into 1 sec bins. Red curve is a Poisson curve with rate = median count rate of data. |
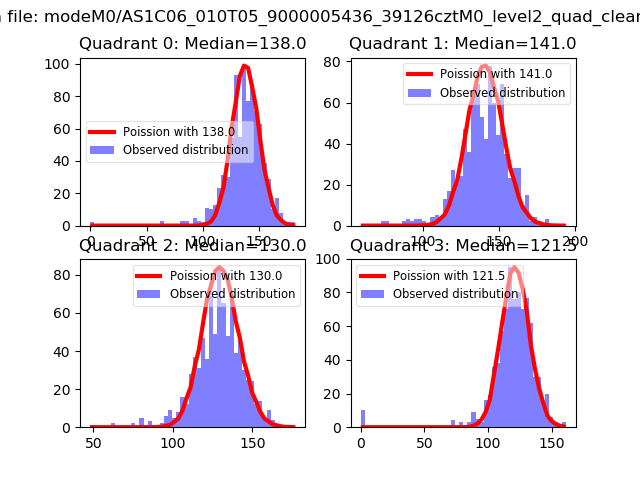 |
 |
| Quadrant-wise count rates Data is divided into 100 sec bins |
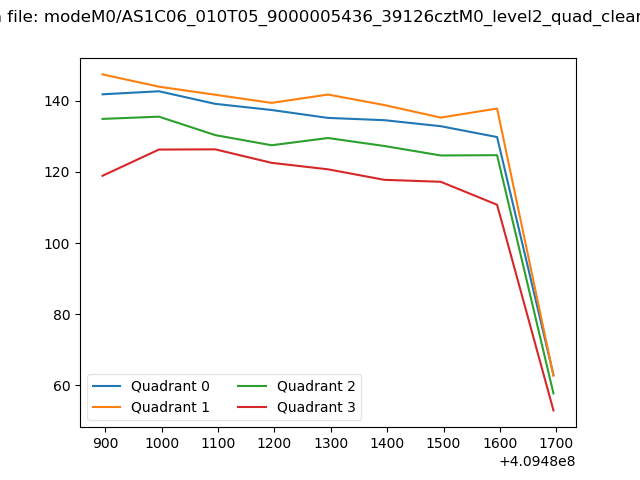 |
|
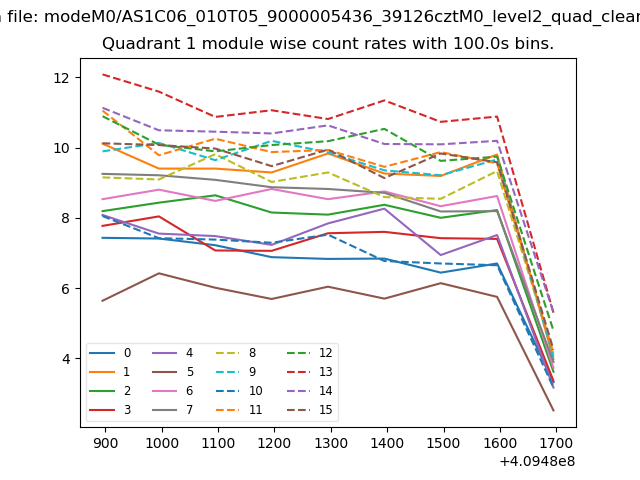
| Module-wise count rates for Quadrant A Data is divided into 100 sec bins |
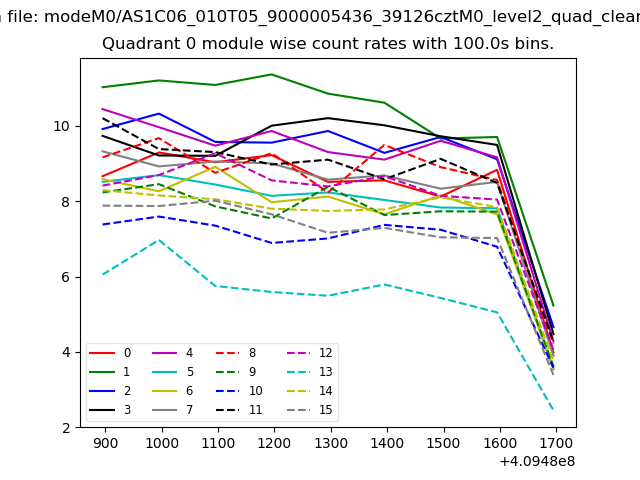 |
 |
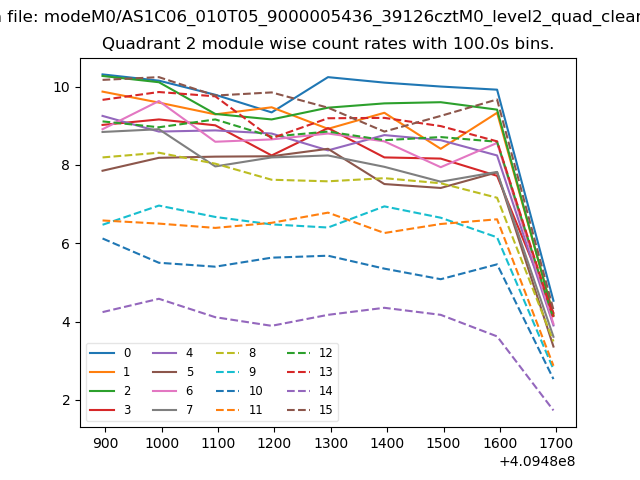
| Module-wise count rates for Quadrant B Data is divided into 100 sec bins |
 |
 |
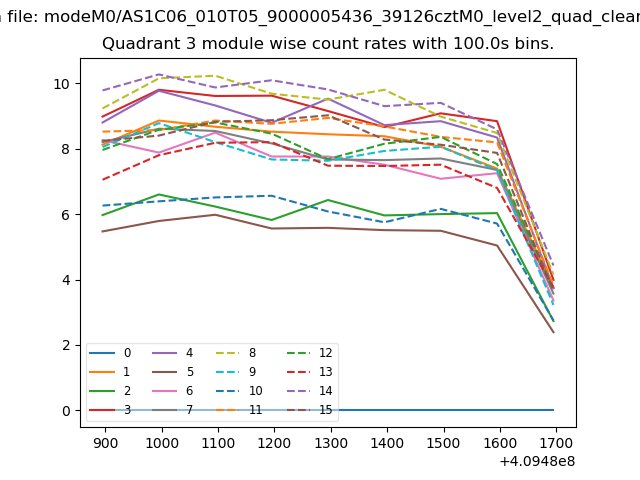
| Module-wise count rates for Quadrant C Data is divided into 100 sec bins |
 |
 |
| Module-wise count rates for Quadrant D Data is divided into 100 sec bins |
 |
 |
| Parameter | Plot |
|---|---|
| CZT HV Monitor | 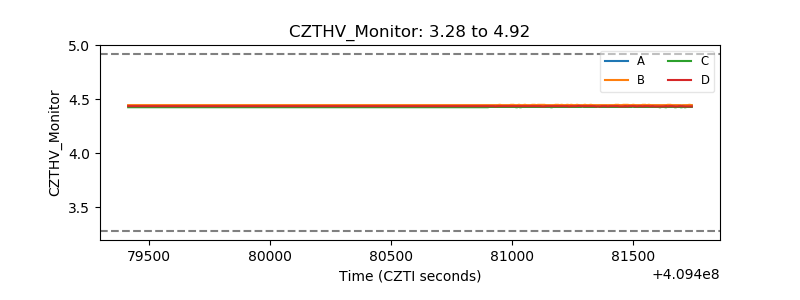 |
| D_VDD | 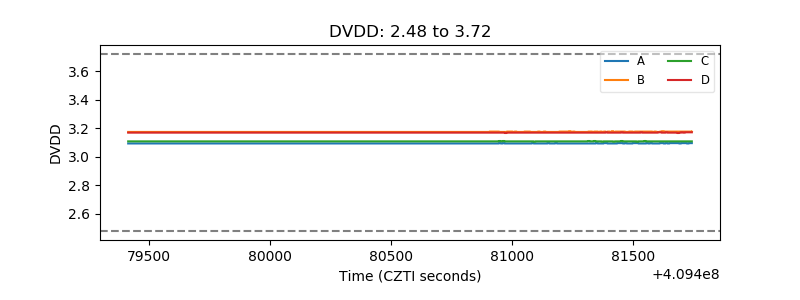 |
| Temperature 1 | 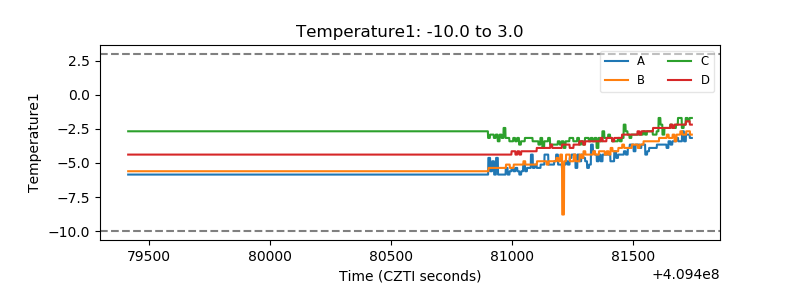 |
| Veto HV Monitor | 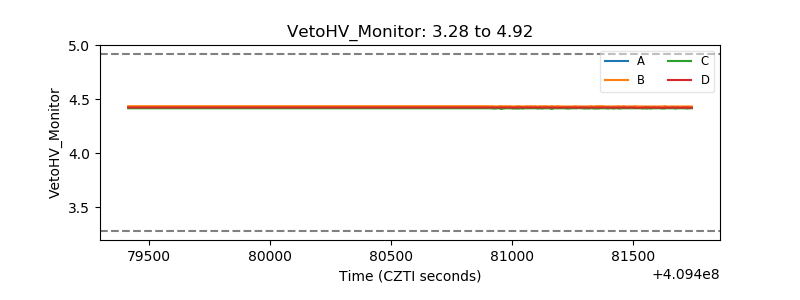 |
| Veto LLD | 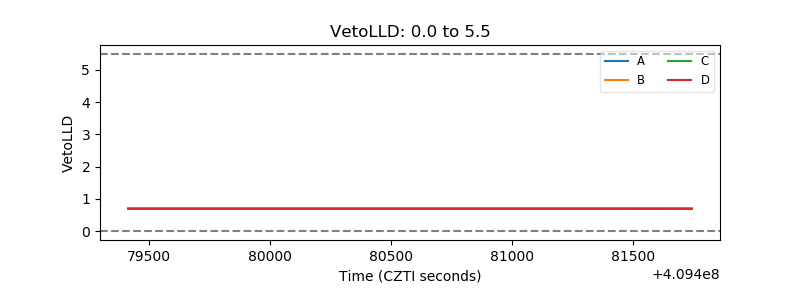 |
| Alpha Counter | 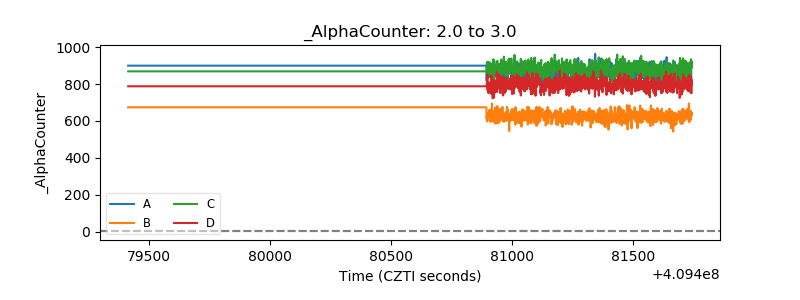 |
| _CPM_Rate | 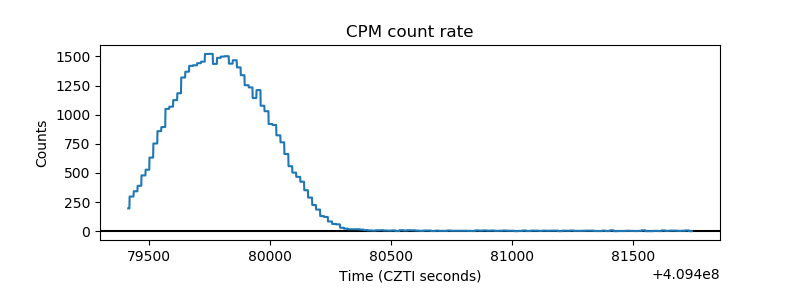 |
| CZT Counter | 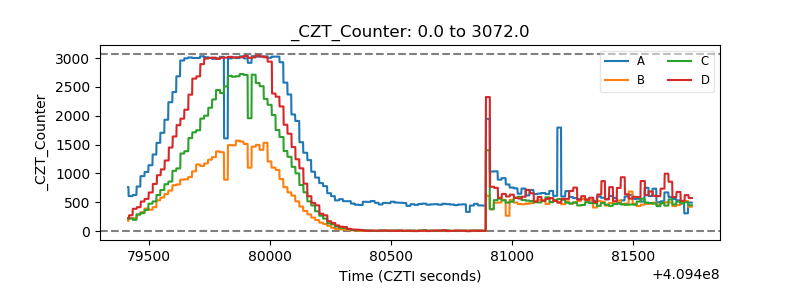 |
| +2.5 Volts monitor | 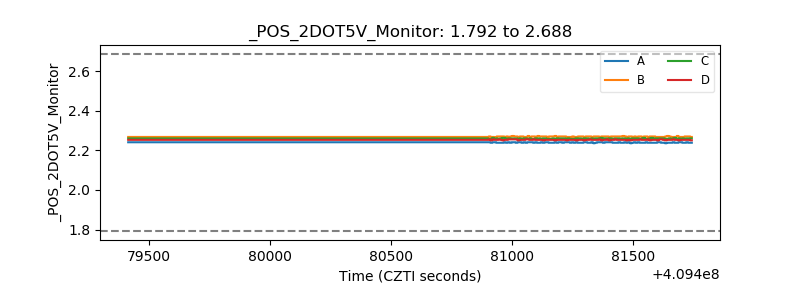 |
| +5 Volts monitor | 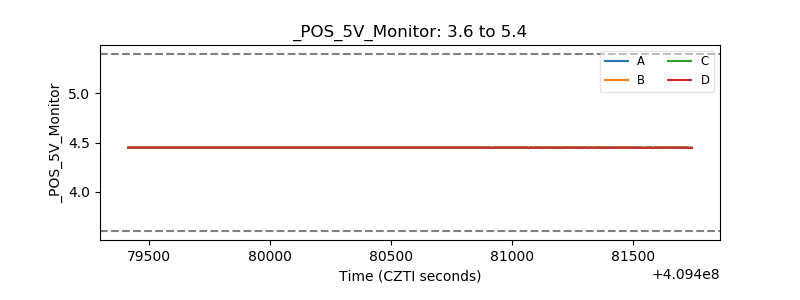 |
| _ROLL_ROT | 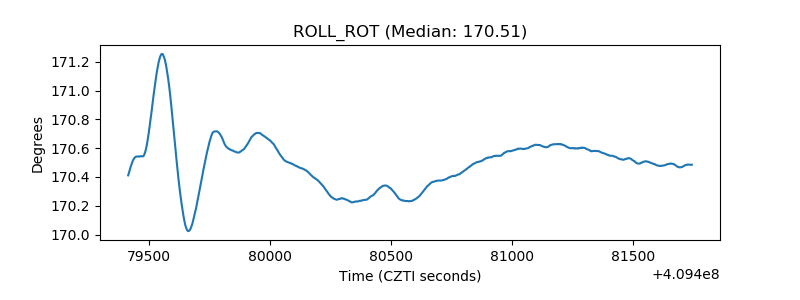 |
| _Roll_DEC | 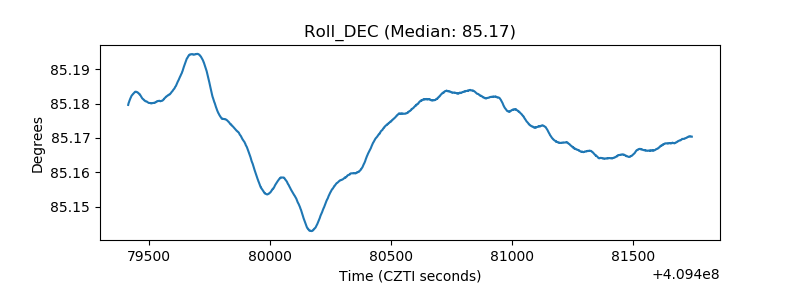 |
| _Roll_RA | 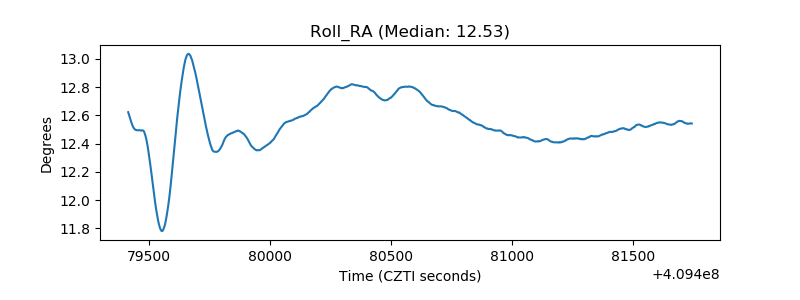 |
| Veto Counter | 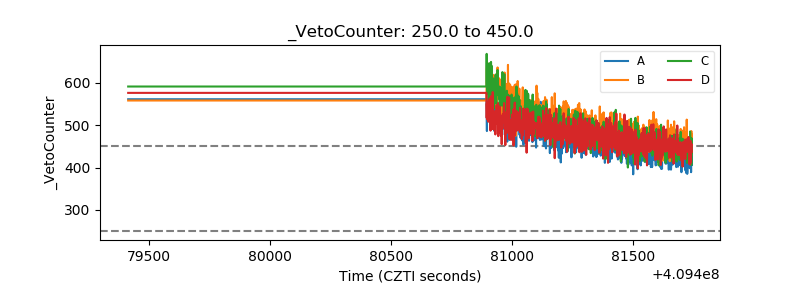 |