| Param | Original file | Final file |
|---|---|---|
| Filename | modeM0/AS1C06_010T05_9000005436_39127cztM0_level2.fits | modeM0/AS1C06_010T05_9000005436_39127cztM0_level2_quad_clean.evt |
| Size (bytes) | 374,212,800 | 94,069,440 |
| Size | 356.9 MB | 89.7 MB |
| Events in quadrant A | 2,809,421 | 659,798 |
| Events in quadrant B | 2,634,465 | 659,674 |
| Events in quadrant C | 2,518,904 | 613,083 |
| Events in quadrant D | 5,494,848 | 560,259 |
| Mode M0 | |||
|---|---|---|---|
| Quadrant | BADHDUFLAG | Total packets | Discarded packets |
| A | 0 | 11274 | 3 |
| B | 0 | 10944 | 2 |
| C | 0 | 10358 | 2 |
| D | 0 | 19964 | 2 |
| Mode M9 | |||
|---|---|---|---|
| Quadrant | BADHDUFLAG | Total packets | Discarded packets |
| A | 0 | 26 | 0 |
| B | 0 | 26 | 0 |
| C | 0 | 26 | 0 |
| D | 0 | 27 | 0 |
| Mode SS | |||
|---|---|---|---|
| Quadrant | BADHDUFLAG | Total packets | Discarded packets |
| A | 0 | 104 | 0 |
| B | 0 | 104 | 0 |
| C | 0 | 104 | 0 |
| D | 0 | 104 | 0 |
| Quadrant | Total seconds | Saturated seconds | Saturation percentage |
|---|---|---|---|
| A | 5076 | 22 | 0.433412% |
| B | 5076 | 40 | 0.788022% |
| C | 5076 | 2 | 0.039401% |
| D | 5076 | 262 | 5.161545% |
Noise dominated data is calculated using 1-second bins in cleaned event files. If a bin has >2000 counts, and if more than 50% of those come from <1% of pixels, then it is considered to be noise-dominated and hence unusable.
| Quadrant | # 1 sec bins | Bins with >0 counts | Bins with >2000 counts | High rate bins dominated by noise | Noise dominated (total time) | Noise dominated (detector-on time) | Marked lightcurve |
|---|---|---|---|---|---|---|---|
| A | 7078 | 5077 | 7 | 7 | 0.10% | 0.14% | 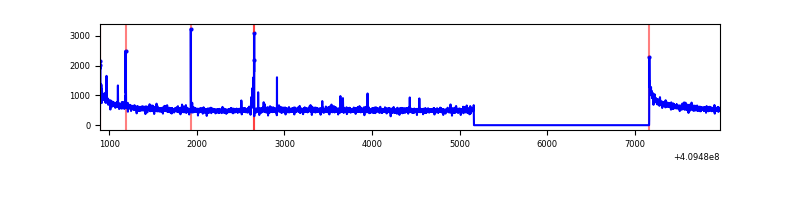 |
| B | 7078 | 5077 | 23 | 23 | 0.32% | 0.45% | 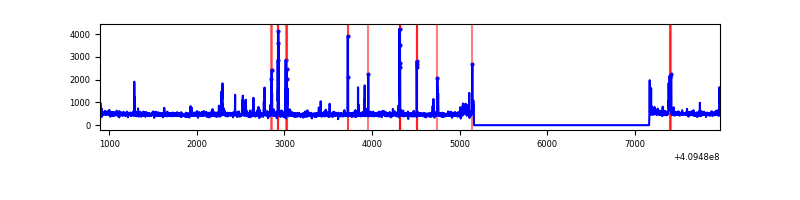 |
| C | 7078 | 5077 | 0 | 0 | 0.00% | 0.00% | 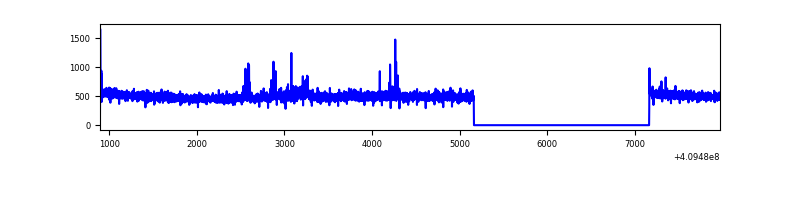 |
| D | 7078 | 5077 | 256 | 256 | 3.62% | 5.04% | 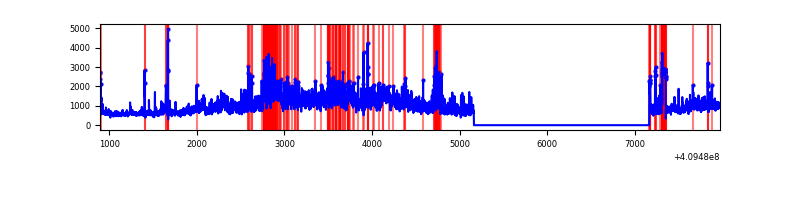 |
Top three noisy pixels from each quadrant. If the there are fewer than three noisy pixels in the level2.evt file, extra rows are filled as -1
| Pixel properties | Quadrant properties | ||||||
|---|---|---|---|---|---|---|---|
| Quadrant | DetID | PixID | Counts | Sigma | Mean | Median | Sigma |
| A | 10 | 83 | 424591 | 3520.75 | 601 | 590 | 120.4 |
| A | 9 | 143 | 37688 | 308.05 | 601 | 590 | 120.4 |
| A | 13 | 254 | 7760 | 59.54 | 601 | 590 | 120.4 |
| B | 5 | 172 | 132173 | 1195.12 | 587 | 573 | 110.1 |
| B | 0 | 230 | 62220 | 559.84 | 587 | 573 | 110.1 |
| B | 0 | 183 | 40716 | 364.56 | 587 | 573 | 110.1 |
| C | 15 | 214 | 218412 | 1659.94 | 571 | 574 | 131.2 |
| C | 3 | 233 | 34431 | 257.99 | 571 | 574 | 131.2 |
| C | 9 | 187 | 32515 | 243.39 | 571 | 574 | 131.2 |
| D | 12 | 235 | 2472529 | 17754.49 | 569 | 553 | 139.2 |
| D | 2 | 249 | 224748 | 1610.24 | 569 | 553 | 139.2 |
| D | 12 | 233 | 191454 | 1371.11 | 569 | 553 | 139.2 |
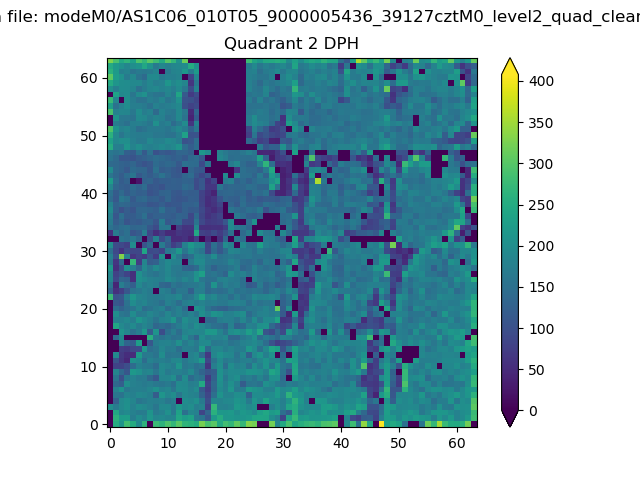
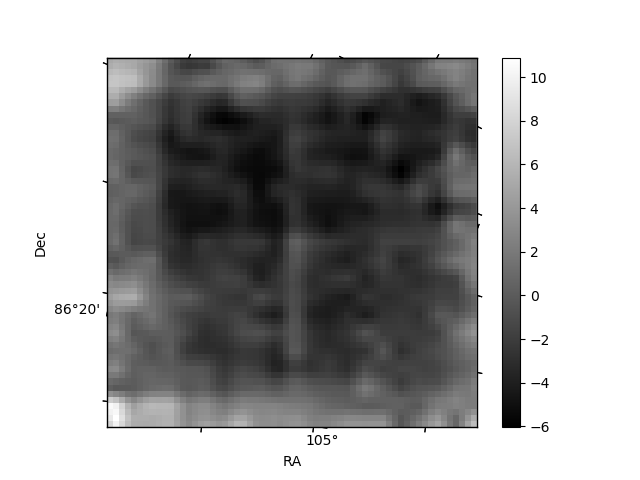
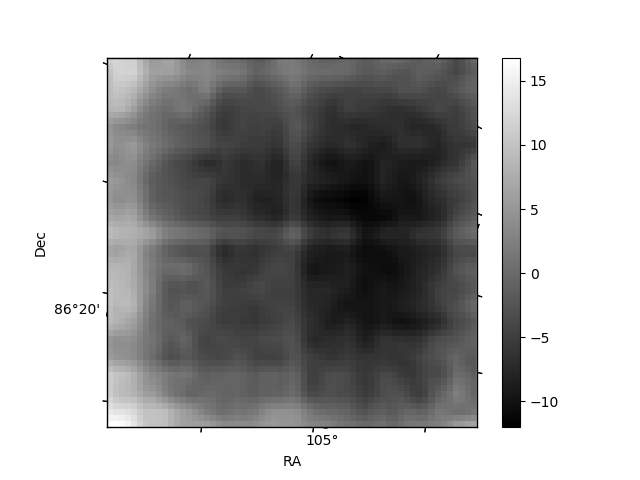
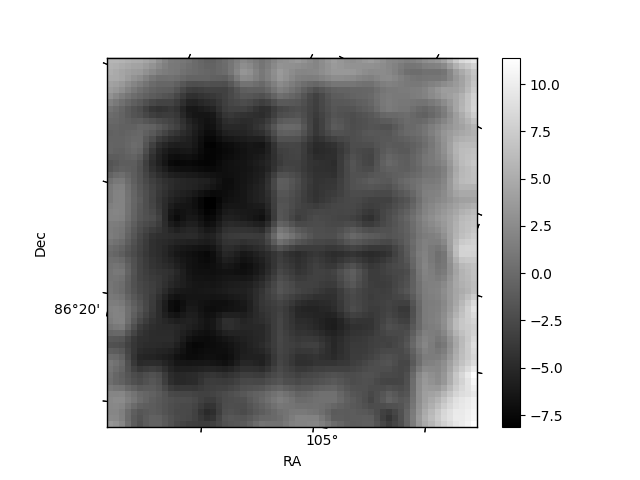
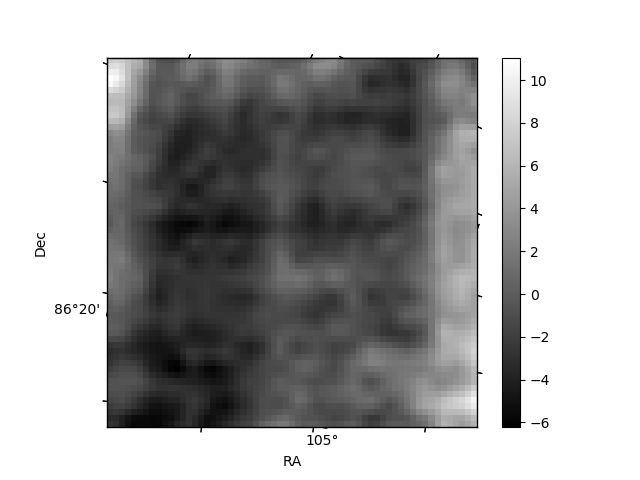
Histogram calculated using DETX and DETY for each event in the final _common_clean file
| Quadrant A | 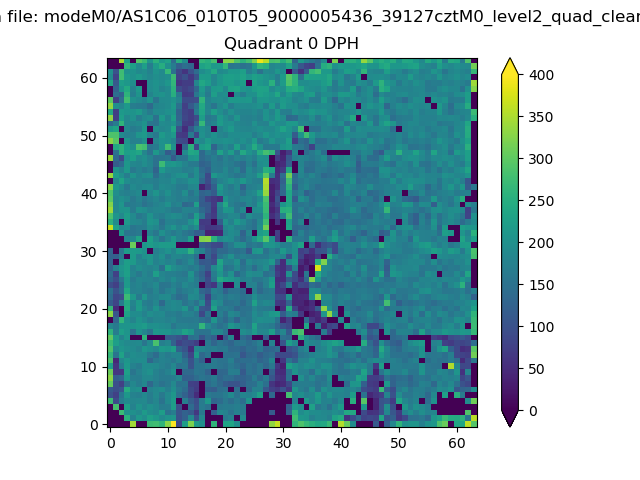 |
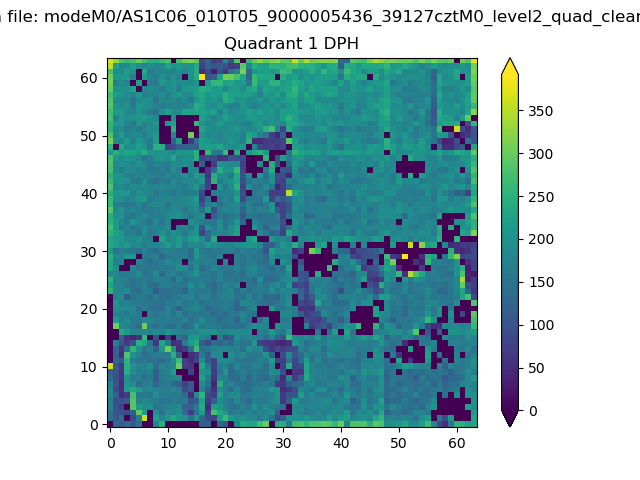 |
Quadrant B |
|---|---|---|---|
| Quadrant D | 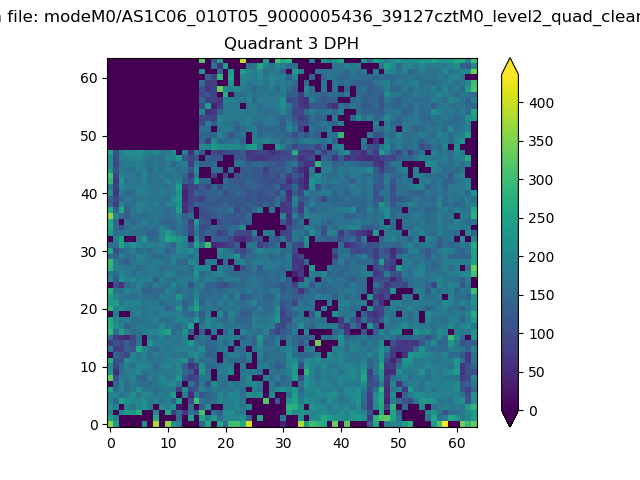 |
 |
Quadrant C |
| Plot type | Count rate plots | Images |
|---|---|---|
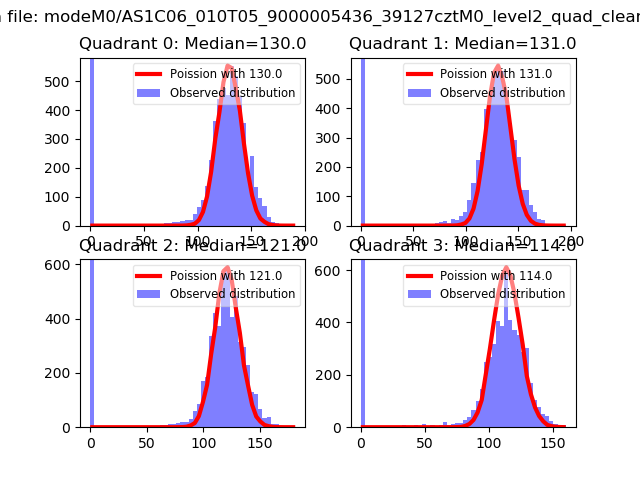
| Comparison with Poisson distribution Blue bars denote a histogram of data divided into 1 sec bins. Red curve is a Poisson curve with rate = median count rate of data. |
 |
 |
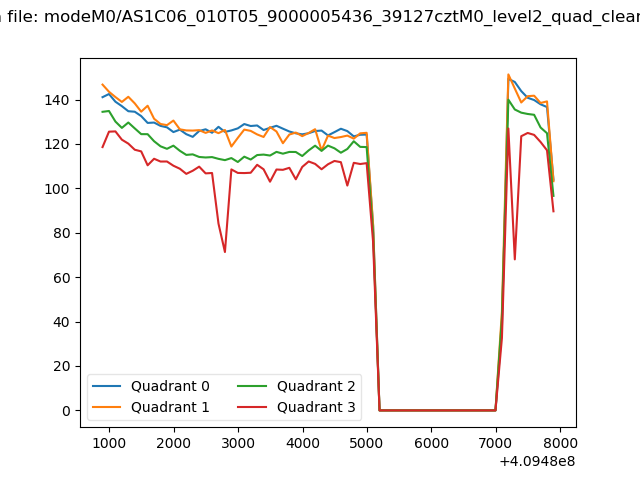
| Quadrant-wise count rates Data is divided into 100 sec bins |
 |
|
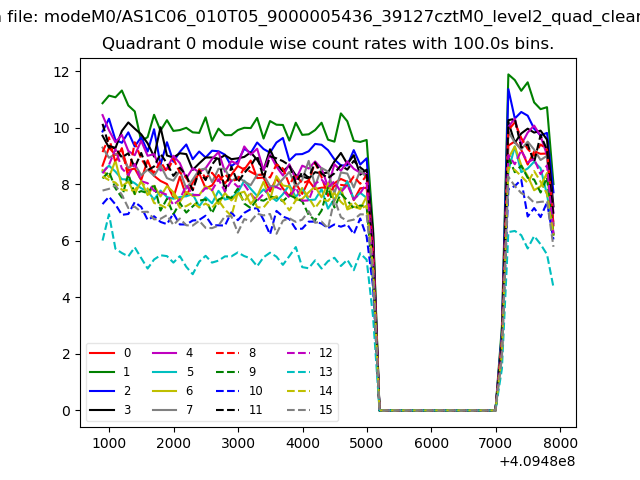
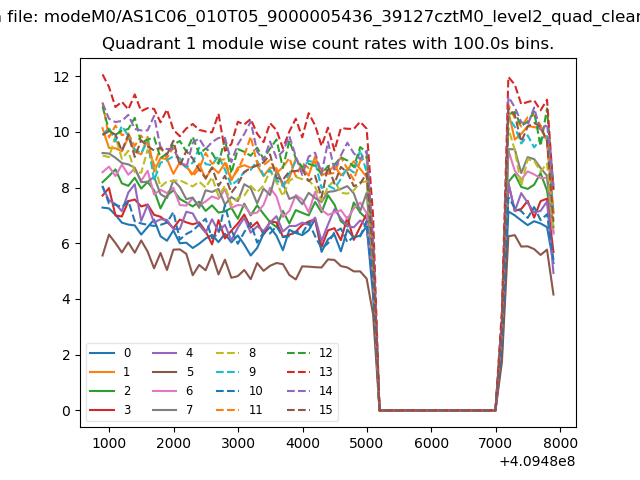
| Module-wise count rates for Quadrant A Data is divided into 100 sec bins |
 |
 |
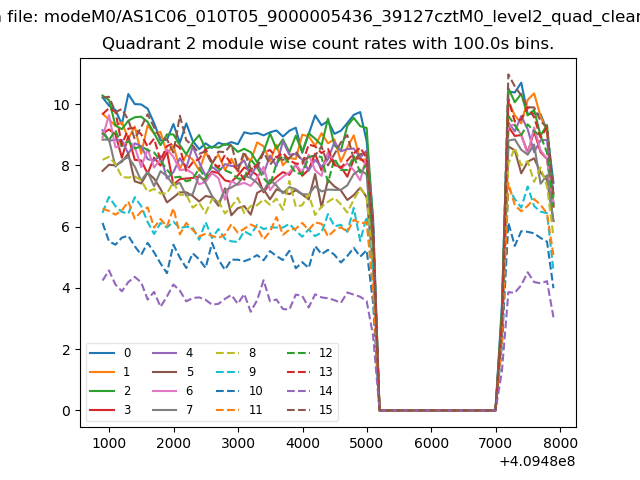
| Module-wise count rates for Quadrant B Data is divided into 100 sec bins |
 |
 |
| Module-wise count rates for Quadrant C Data is divided into 100 sec bins |
 |
 |
| Module-wise count rates for Quadrant D Data is divided into 100 sec bins |
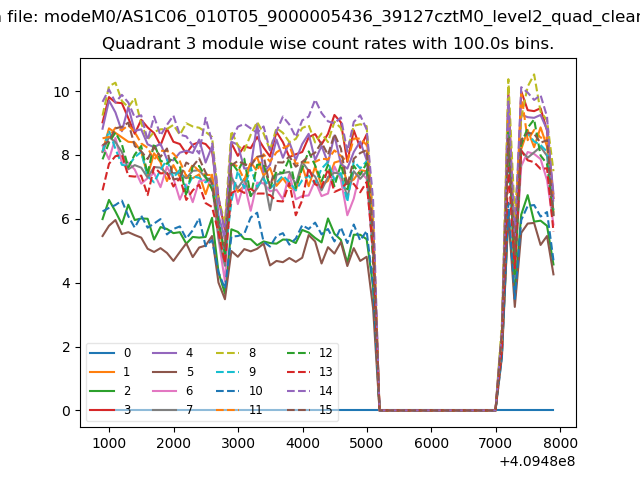 |
 |
| Parameter | Plot |
|---|---|
| CZT HV Monitor | 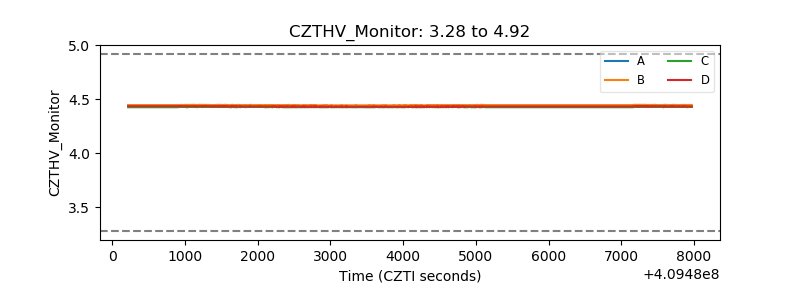 |
| D_VDD | 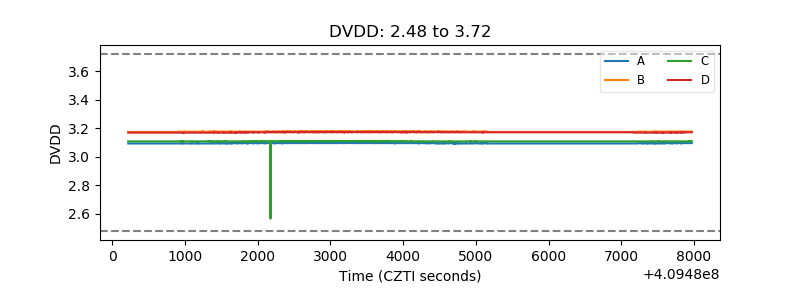 |
| Temperature 1 | 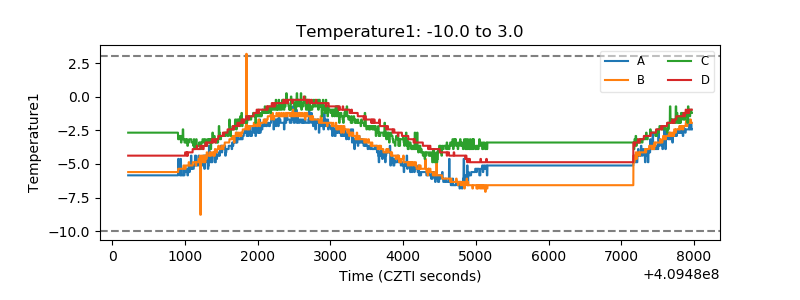 |
| Veto HV Monitor | 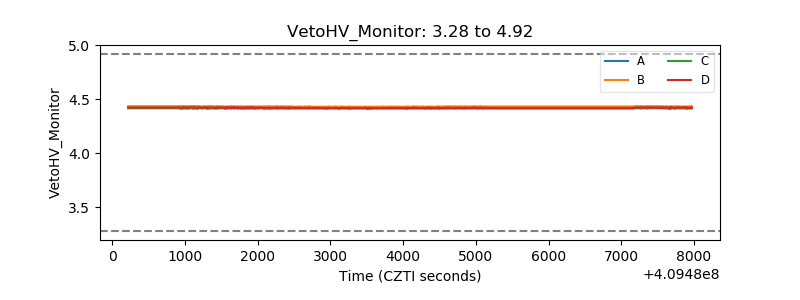 |
| Veto LLD | 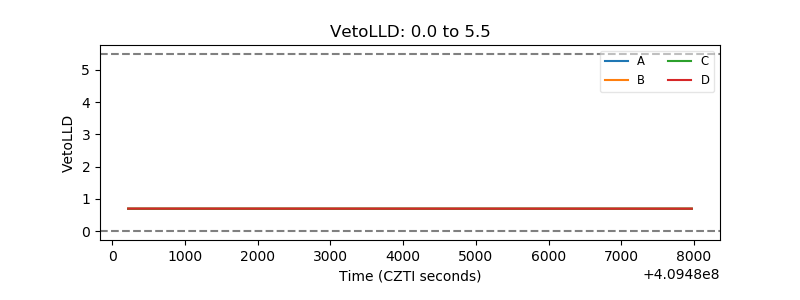 |
| Alpha Counter | 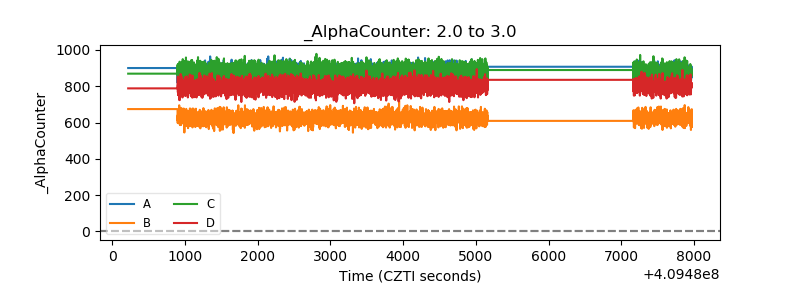 |
| _CPM_Rate | 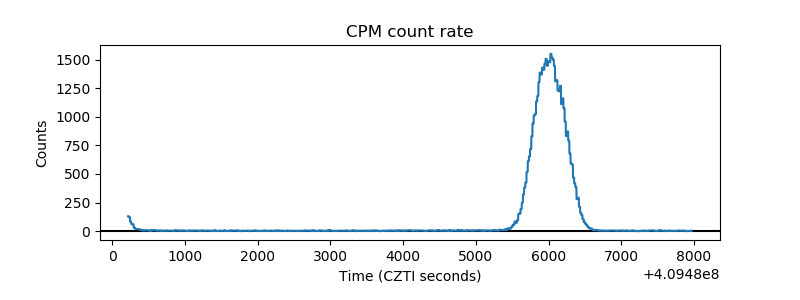 |
| CZT Counter | 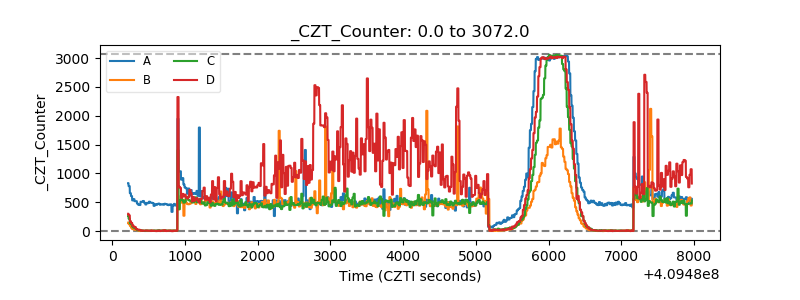 |
| +2.5 Volts monitor |  |
| +5 Volts monitor | 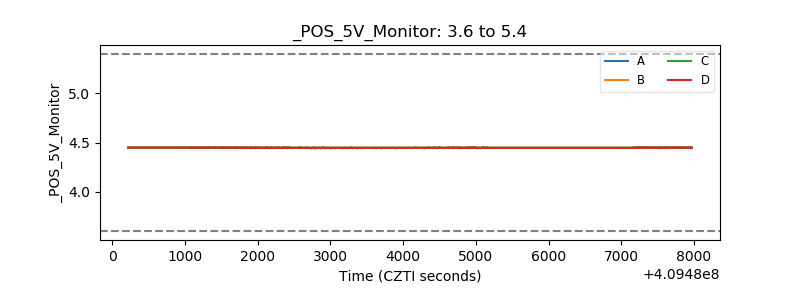 |
| _ROLL_ROT | 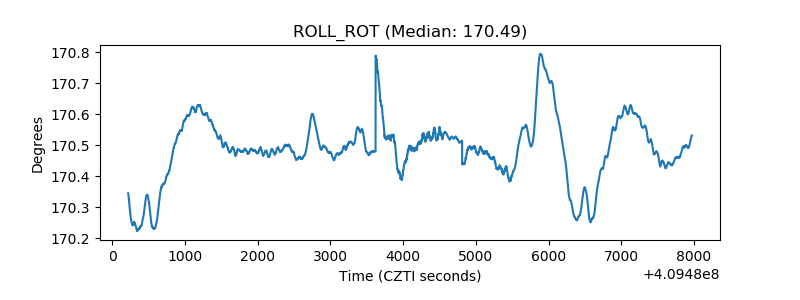 |
| _Roll_DEC | 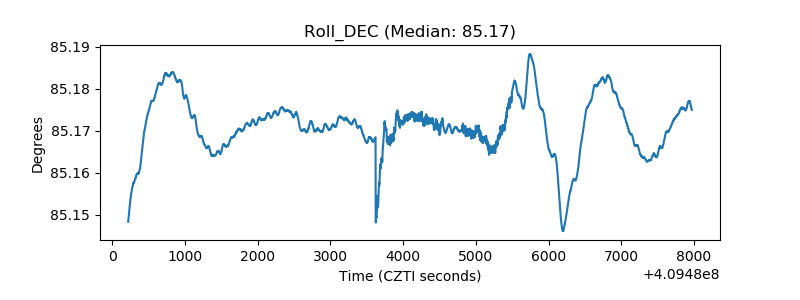 |
| _Roll_RA | 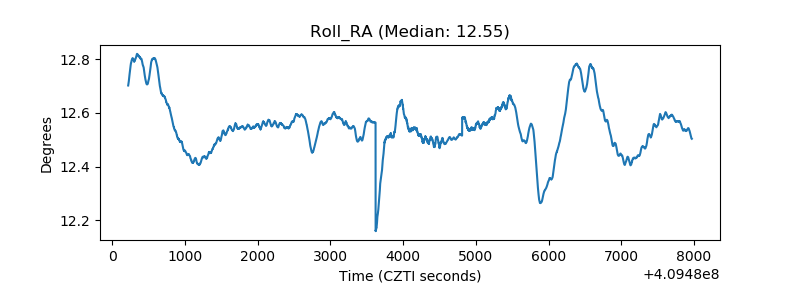 |
| Veto Counter |  |