| Param | Original file | Final file |
|---|---|---|
| Filename | modeM0/AS1C06_010T05_9000005436_39128cztM0_level2.fits | modeM0/AS1C06_010T05_9000005436_39128cztM0_level2_quad_clean.evt |
| Size (bytes) | 420,246,720 | 91,797,120 |
| Size | 400.8 MB | 87.5 MB |
| Events in quadrant A | 2,736,267 | 650,730 |
| Events in quadrant B | 2,992,799 | 633,858 |
| Events in quadrant C | 2,777,633 | 604,722 |
| Events in quadrant D | 6,665,148 | 543,234 |
| Mode M0 | |||
|---|---|---|---|
| Quadrant | BADHDUFLAG | Total packets | Discarded packets |
| A | 0 | 11018 | 3 |
| B | 0 | 11963 | 2 |
| C | 0 | 11121 | 2 |
| D | 0 | 23298 | 2 |
| Mode M9 | |||
|---|---|---|---|
| Quadrant | BADHDUFLAG | Total packets | Discarded packets |
| A | 0 | 28 | 0 |
| B | 0 | 28 | 0 |
| C | 0 | 28 | 0 |
| D | 0 | 29 | 0 |
| Mode SS | |||
|---|---|---|---|
| Quadrant | BADHDUFLAG | Total packets | Discarded packets |
| A | 0 | 100 | 0 |
| B | 0 | 100 | 0 |
| C | 0 | 100 | 0 |
| D | 0 | 100 | 0 |
| Quadrant | Total seconds | Saturated seconds | Saturation percentage |
|---|---|---|---|
| A | 4953 | 13 | 0.262467% |
| B | 4953 | 164 | 3.311125% |
| C | 4953 | 35 | 0.706642% |
| D | 4953 | 416 | 8.398950% |
Noise dominated data is calculated using 1-second bins in cleaned event files. If a bin has >2000 counts, and if more than 50% of those come from <1% of pixels, then it is considered to be noise-dominated and hence unusable.
| Quadrant | # 1 sec bins | Bins with >0 counts | Bins with >2000 counts | High rate bins dominated by noise | Noise dominated (total time) | Noise dominated (detector-on time) | Marked lightcurve |
|---|---|---|---|---|---|---|---|
| A | 7046 | 4954 | 3 | 3 | 0.04% | 0.06% | 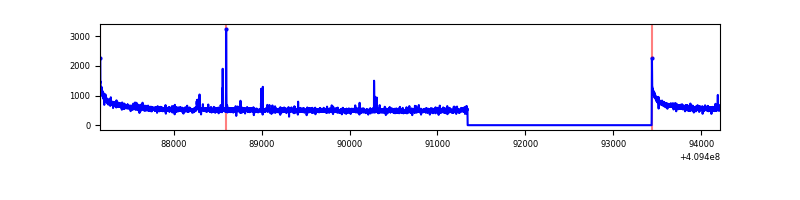 |
| B | 7045 | 4953 | 128 | 128 | 1.82% | 2.58% | 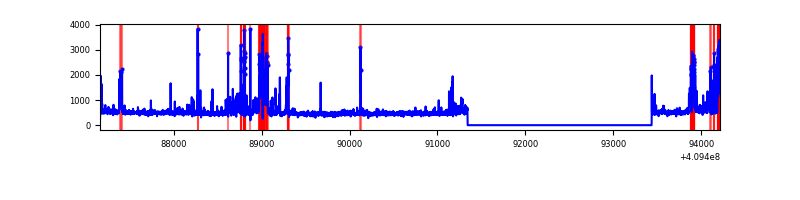 |
| C | 7046 | 4954 | 35 | 35 | 0.50% | 0.71% | 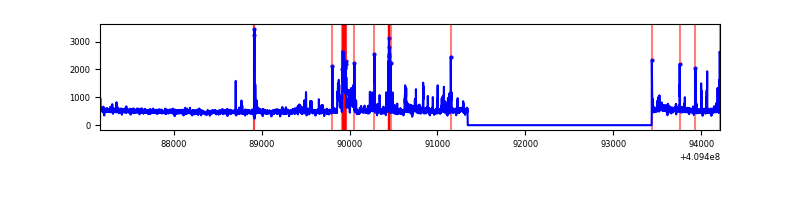 |
| D | 7046 | 4954 | 433 | 433 | 6.15% | 8.74% | 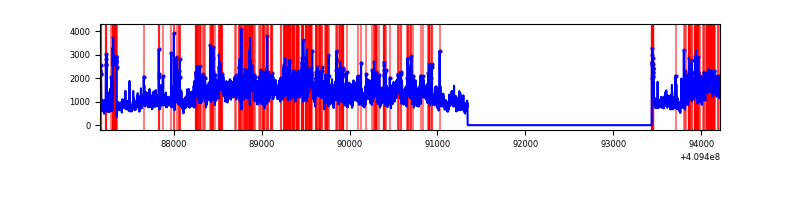 |
Top three noisy pixels from each quadrant. If the there are fewer than three noisy pixels in the level2.evt file, extra rows are filled as -1
| Pixel properties | Quadrant properties | ||||||
|---|---|---|---|---|---|---|---|
| Quadrant | DetID | PixID | Counts | Sigma | Mean | Median | Sigma |
| A | 10 | 83 | 426574 | 3588.75 | 588 | 578 | 118.7 |
| A | 13 | 248 | 22804 | 187.24 | 588 | 578 | 118.7 |
| A | 9 | 143 | 8805 | 69.31 | 588 | 578 | 118.7 |
| B | 5 | 172 | 366579 | 3465.37 | 566 | 552 | 105.6 |
| B | 5 | 184 | 241892 | 2284.89 | 566 | 552 | 105.6 |
| B | 0 | 230 | 54654 | 512.21 | 566 | 552 | 105.6 |
| C | 9 | 187 | 355706 | 2752.67 | 561 | 564 | 129.0 |
| C | 15 | 214 | 211355 | 1633.82 | 561 | 564 | 129.0 |
| C | 3 | 233 | 11394 | 83.94 | 561 | 564 | 129.0 |
| D | 12 | 235 | 3558990 | 26574.94 | 555 | 538 | 133.9 |
| D | 12 | 233 | 214123 | 1595.07 | 555 | 538 | 133.9 |
| D | 13 | 249 | 202634 | 1509.27 | 555 | 538 | 133.9 |
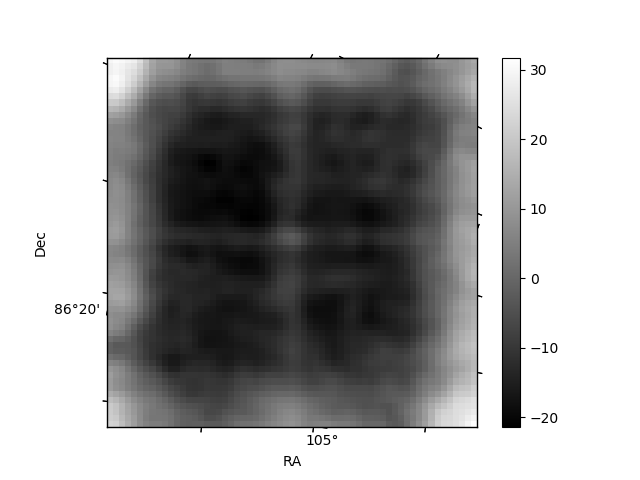
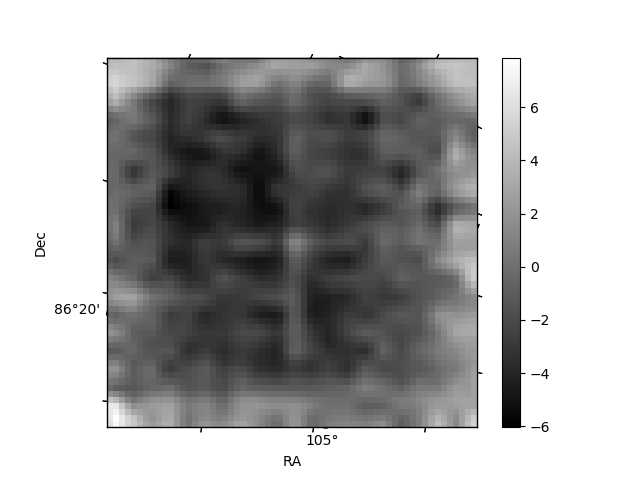
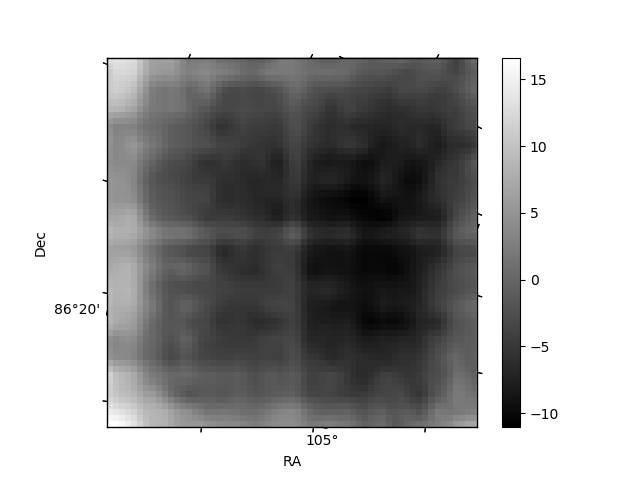
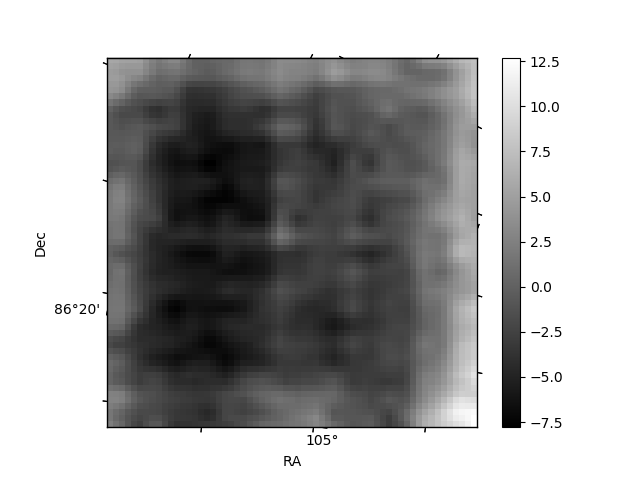
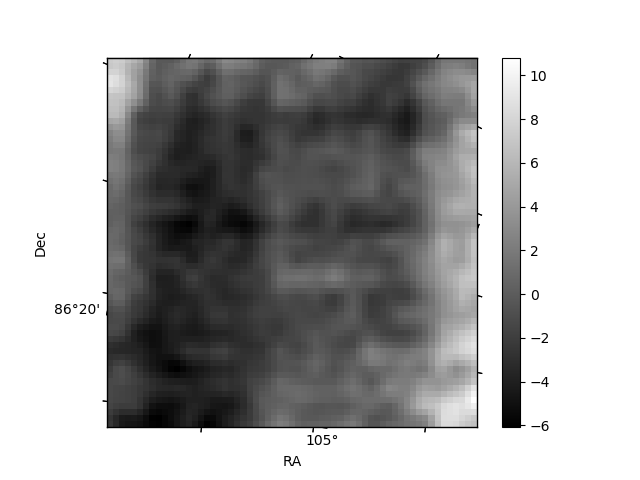
Histogram calculated using DETX and DETY for each event in the final _common_clean file
| Quadrant A | 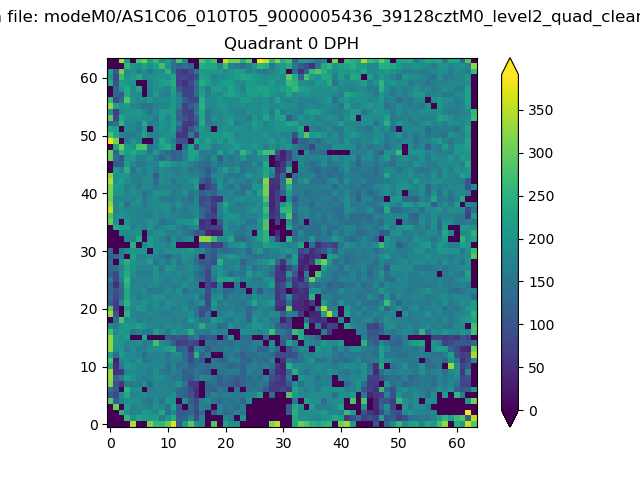 |
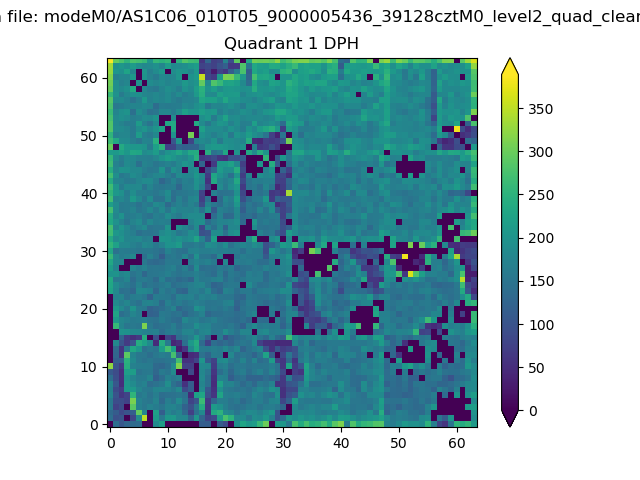 |
Quadrant B |
|---|---|---|---|
| Quadrant D | 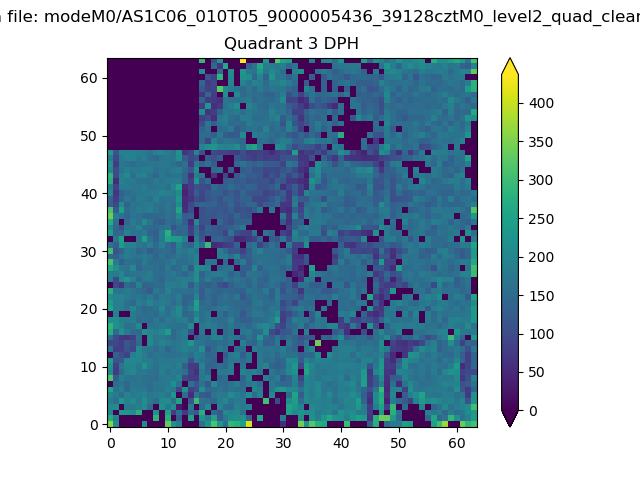 |
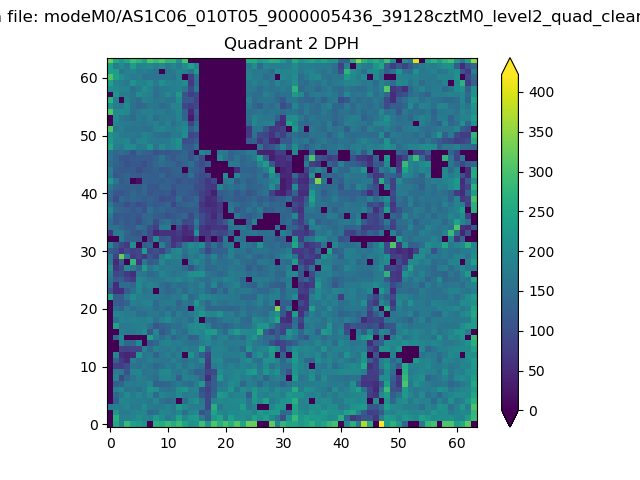 |
Quadrant C |
| Plot type | Count rate plots | Images |
|---|---|---|
| Comparison with Poisson distribution Blue bars denote a histogram of data divided into 1 sec bins. Red curve is a Poisson curve with rate = median count rate of data. |
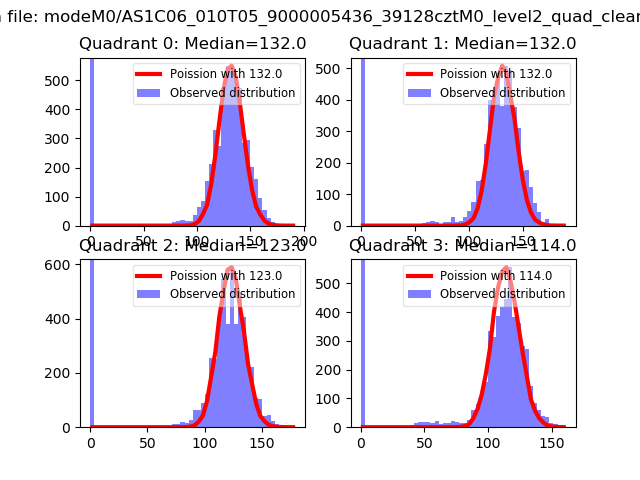 |
 |
| Quadrant-wise count rates Data is divided into 100 sec bins |
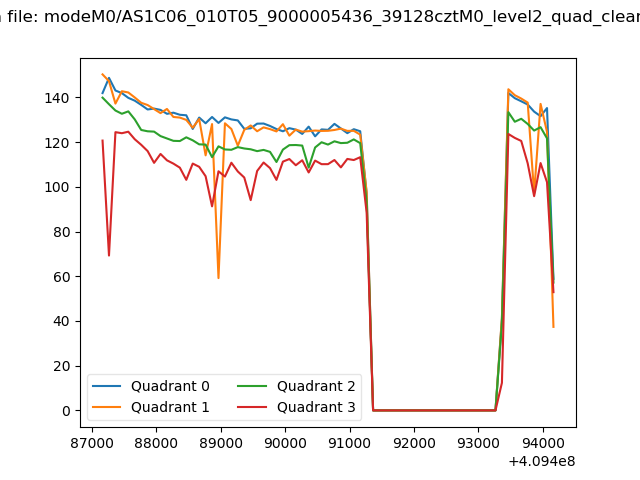 |
|
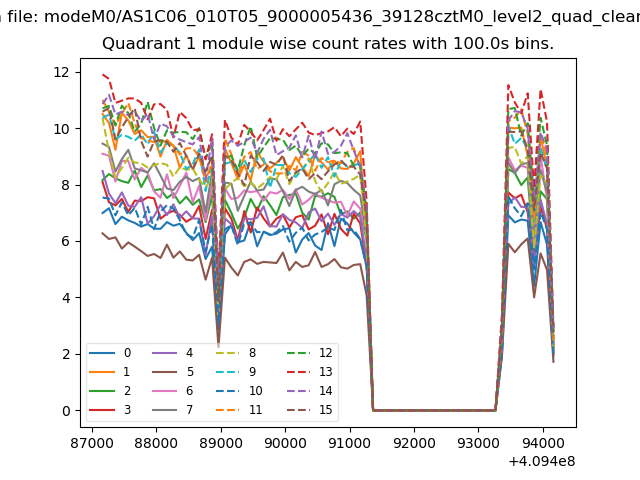
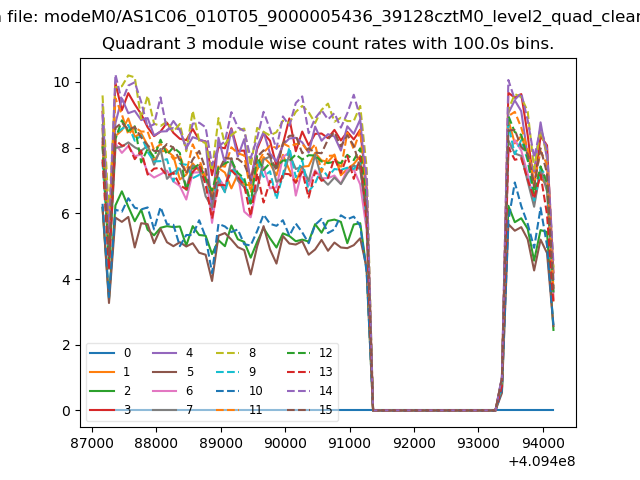
| Module-wise count rates for Quadrant A Data is divided into 100 sec bins |
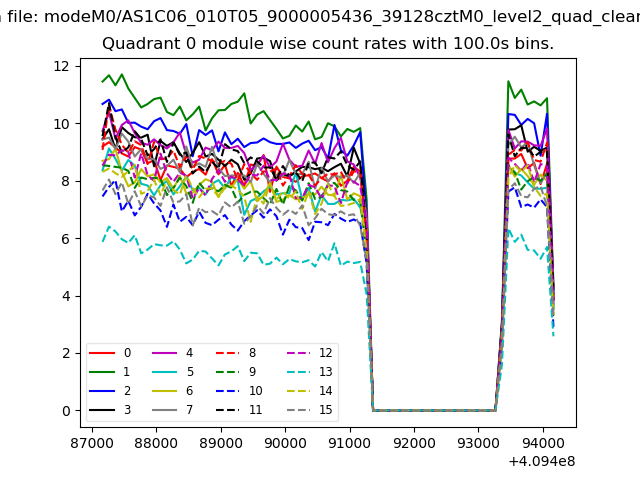 |
 |
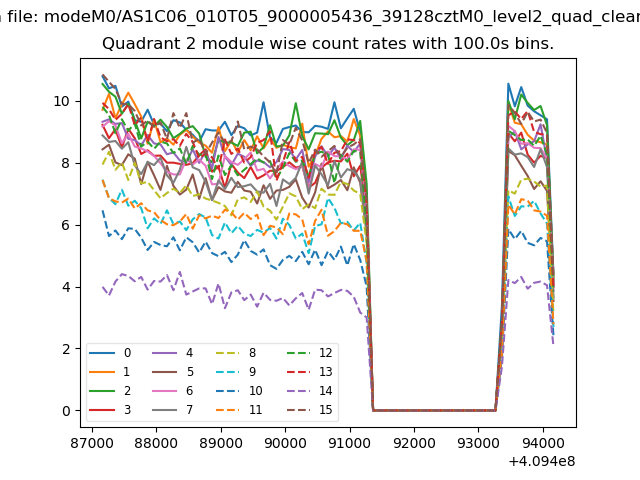
| Module-wise count rates for Quadrant B Data is divided into 100 sec bins |
 |
 |
| Module-wise count rates for Quadrant C Data is divided into 100 sec bins |
 |
 |
| Module-wise count rates for Quadrant D Data is divided into 100 sec bins |
 |
 |
| Parameter | Plot |
|---|---|
| CZT HV Monitor |  |
| D_VDD | 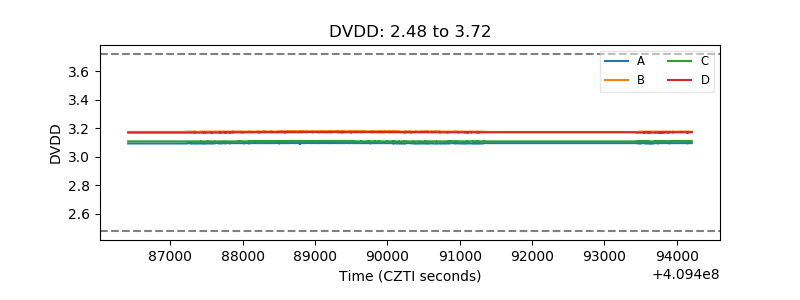 |
| Temperature 1 | 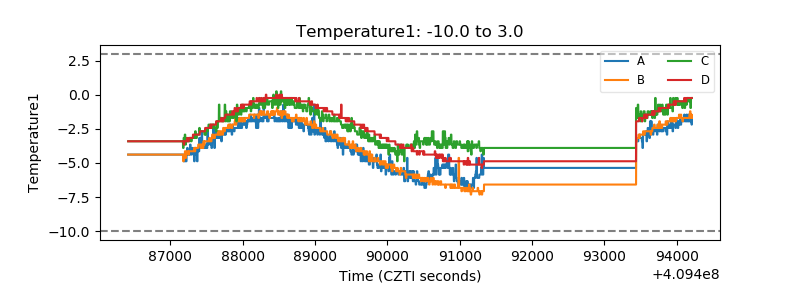 |
| Veto HV Monitor | 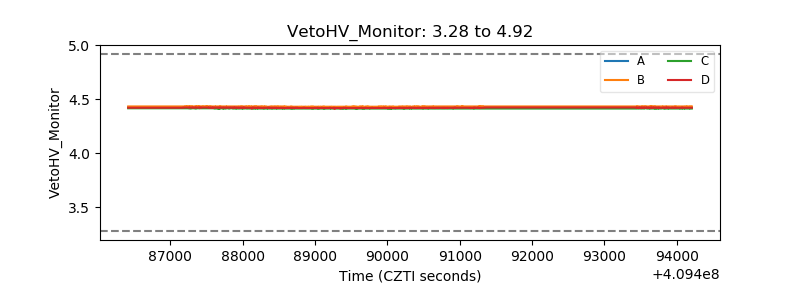 |
| Veto LLD | 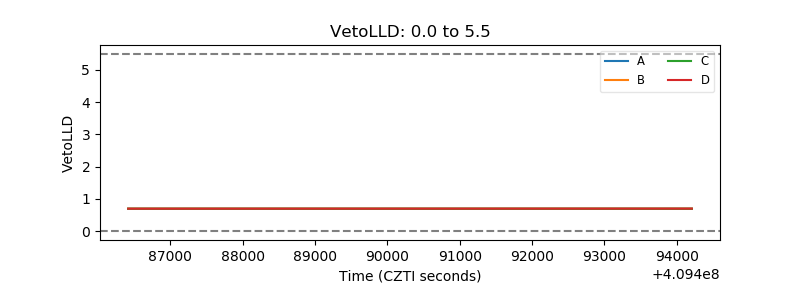 |
| Alpha Counter | 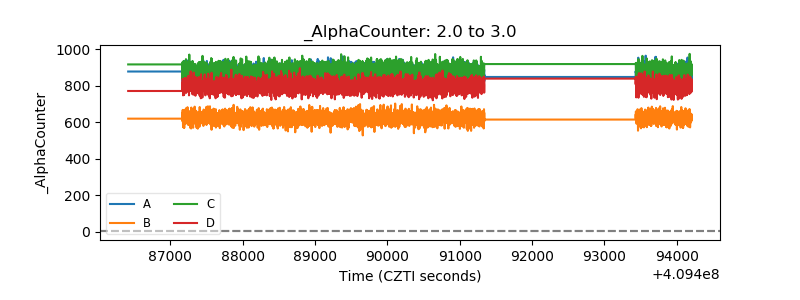 |
| _CPM_Rate | 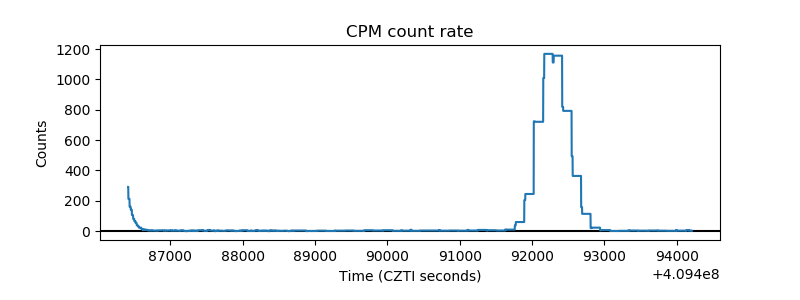 |
| CZT Counter | 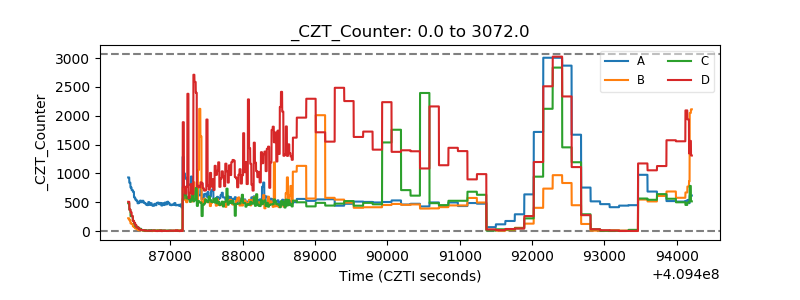 |
| +2.5 Volts monitor | 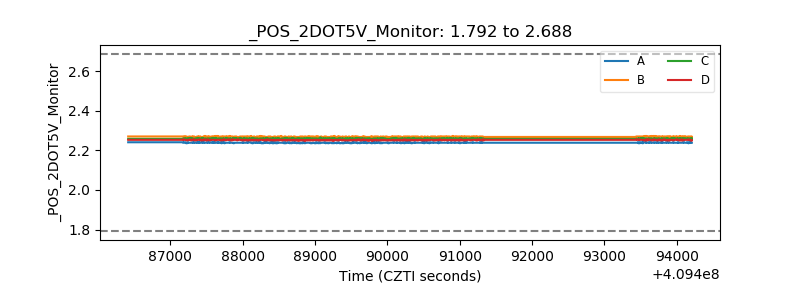 |
| +5 Volts monitor | 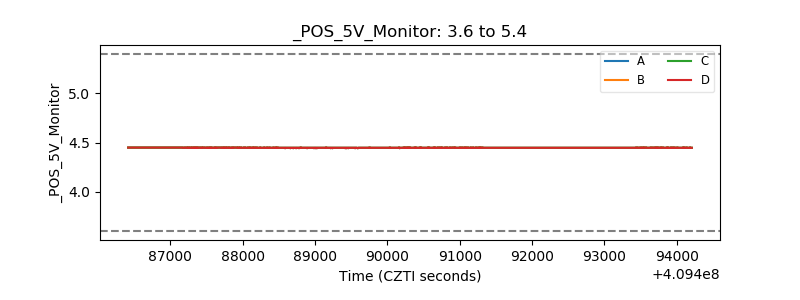 |
| _ROLL_ROT | 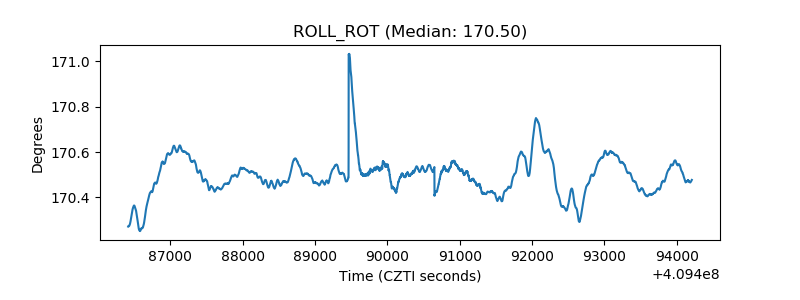 |
| _Roll_DEC | 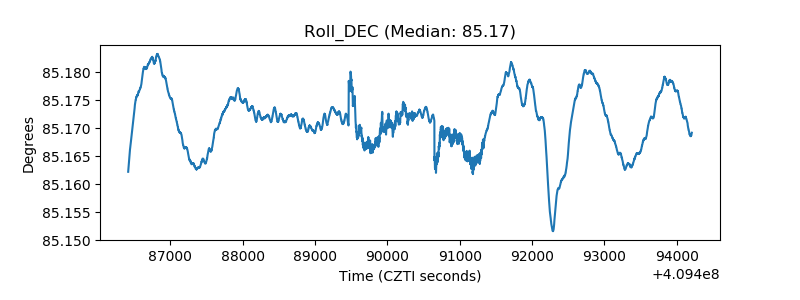 |
| _Roll_RA | 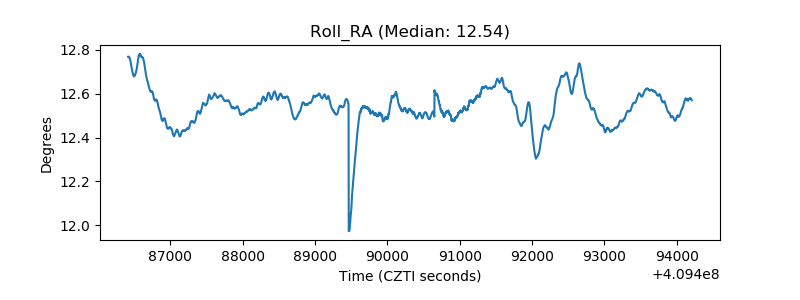 |
| Veto Counter | 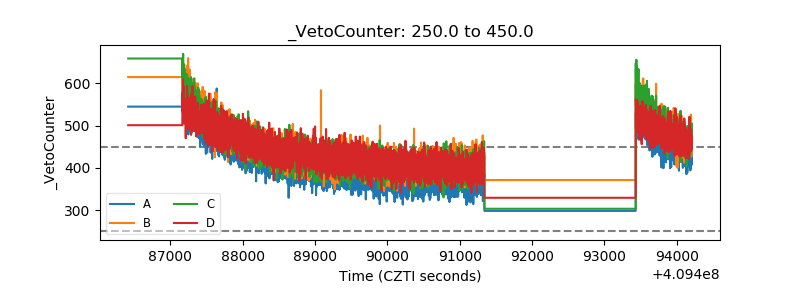 |