| Param | Original file | Final file |
|---|---|---|
| Filename | modeM0/AS1C06_010T05_9000005436_39129cztM0_level2.fits | modeM0/AS1C06_010T05_9000005436_39129cztM0_level2_quad_clean.evt |
| Size (bytes) | 198,538,560 | 31,904,640 |
| Size | 189.3 MB | 30.4 MB |
| Events in quadrant A | 1,062,983 | 248,250 |
| Events in quadrant B | 1,365,392 | 234,467 |
| Events in quadrant C | 1,193,678 | 227,092 |
| Events in quadrant D | 3,578,981 | 119,358 |
| Mode M0 | |||
|---|---|---|---|
| Quadrant | BADHDUFLAG | Total packets | Discarded packets |
| A | 0 | 4248 | 1 |
| B | 0 | 5205 | 1 |
| C | 0 | 4675 | 1 |
| D | 0 | 11907 | 1 |
| Mode SS | |||
|---|---|---|---|
| Quadrant | BADHDUFLAG | Total packets | Discarded packets |
| A | 0 | 38 | 0 |
| B | 0 | 38 | 0 |
| C | 0 | 38 | 0 |
| D | 0 | 38 | 0 |
| Quadrant | Total seconds | Saturated seconds | Saturation percentage |
|---|---|---|---|
| A | 1877 | 6 | 0.319659% |
| B | 1877 | 122 | 6.499734% |
| C | 1877 | 34 | 1.811401% |
| D | 1877 | 983 | 52.370804% |
Noise dominated data is calculated using 1-second bins in cleaned event files. If a bin has >2000 counts, and if more than 50% of those come from <1% of pixels, then it is considered to be noise-dominated and hence unusable.
| Quadrant | # 1 sec bins | Bins with >0 counts | Bins with >2000 counts | High rate bins dominated by noise | Noise dominated (total time) | Noise dominated (detector-on time) | Marked lightcurve |
|---|---|---|---|---|---|---|---|
| A | 1877 | 1877 | 6 | 6 | 0.32% | 0.32% |  |
| B | 1877 | 1877 | 93 | 93 | 4.95% | 4.95% |  |
| C | 1877 | 1877 | 32 | 32 | 1.70% | 1.70% |  |
| D | 1877 | 1877 | 896 | 896 | 47.74% | 47.74% |  |
Top three noisy pixels from each quadrant. If the there are fewer than three noisy pixels in the level2.evt file, extra rows are filled as -1
| Pixel properties | Quadrant properties | ||||||
|---|---|---|---|---|---|---|---|
| Quadrant | DetID | PixID | Counts | Sigma | Mean | Median | Sigma |
| A | 10 | 83 | 156634 | 3326.07 | 224 | 219 | 47.0 |
| A | 13 | 248 | 38842 | 821.3 | 224 | 219 | 47.0 |
| A | 13 | 254 | 2752 | 53.86 | 224 | 219 | 47.0 |
| B | 5 | 172 | 262485 | 6312.72 | 212 | 206 | 41.5 |
| B | 5 | 184 | 196808 | 4731.96 | 212 | 206 | 41.5 |
| B | 0 | 213 | 33823 | 809.12 | 212 | 206 | 41.5 |
| C | 9 | 187 | 278648 | 5579.83 | 212 | 212 | 49.9 |
| C | 15 | 214 | 80801 | 1615.0 | 212 | 212 | 49.9 |
| C | 15 | 208 | 2325 | 42.34 | 212 | 212 | 49.9 |
| D | 12 | 235 | 2446688 | 51713.02 | 190 | 184 | 47.3 |
| D | 5 | 222 | 72247 | 1523.23 | 190 | 184 | 47.3 |
| D | 2 | 153 | 69875 | 1473.09 | 190 | 184 | 47.3 |
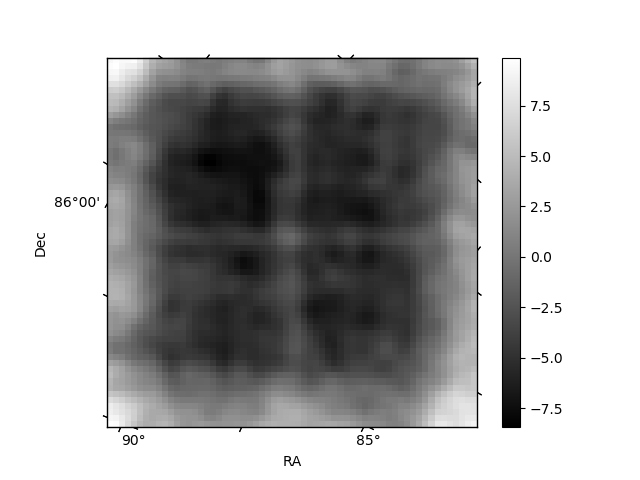
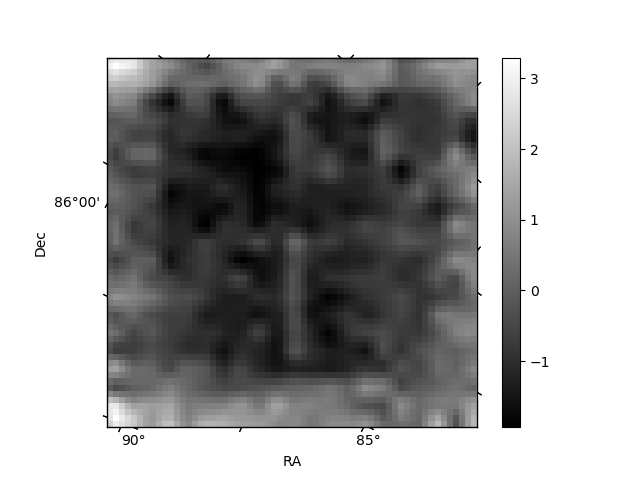
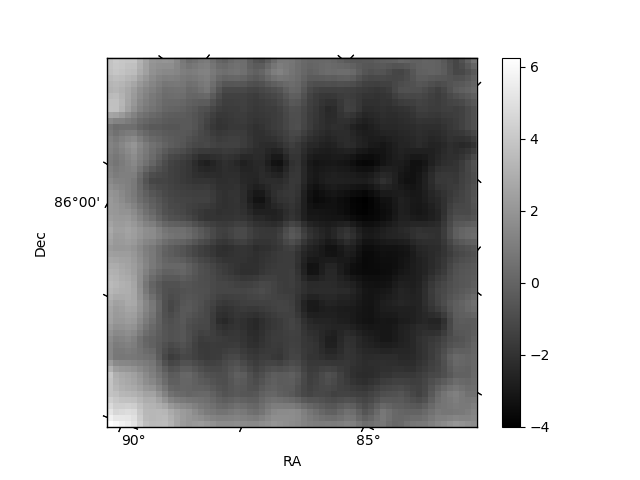
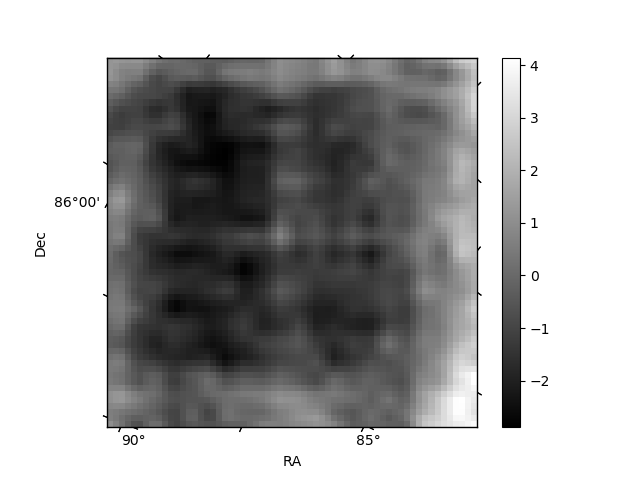
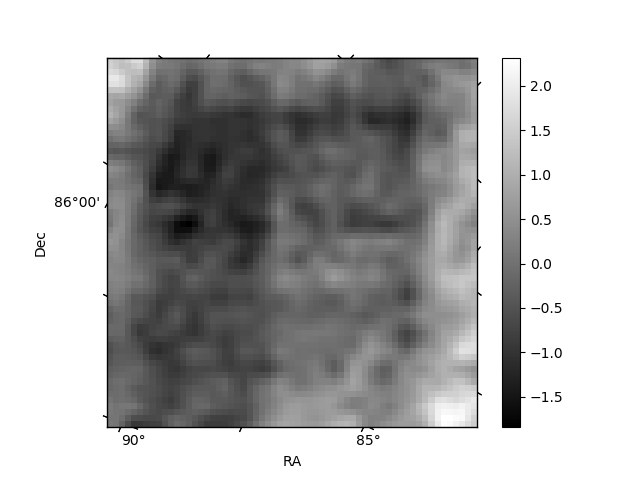
Histogram calculated using DETX and DETY for each event in the final _common_clean file
| Quadrant A | 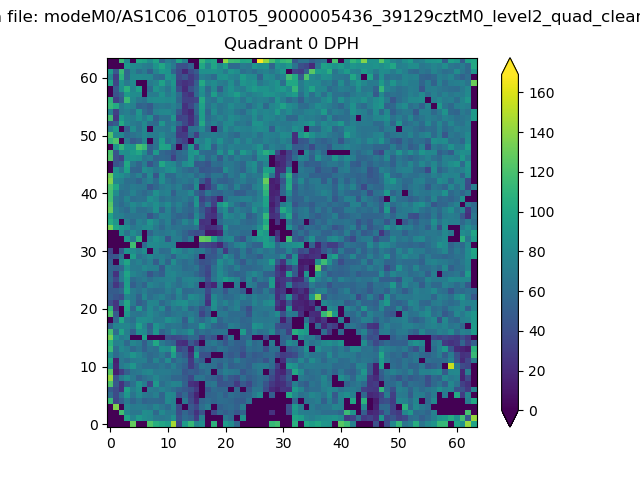 |
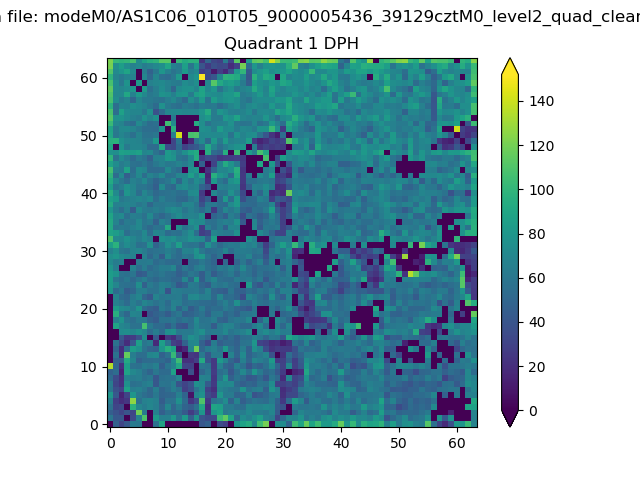 |
Quadrant B |
|---|---|---|---|
| Quadrant D | 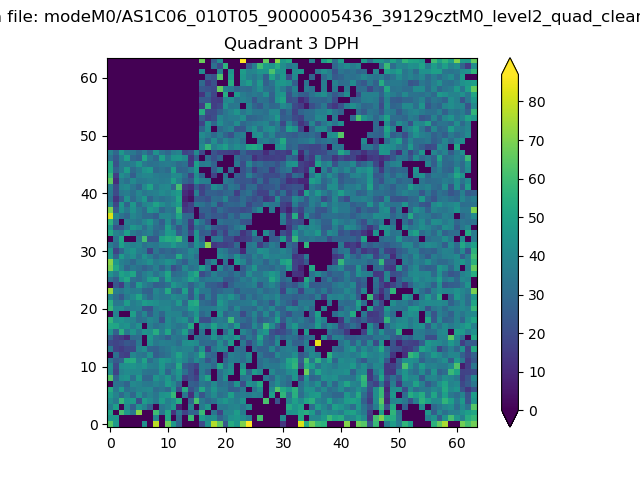 |
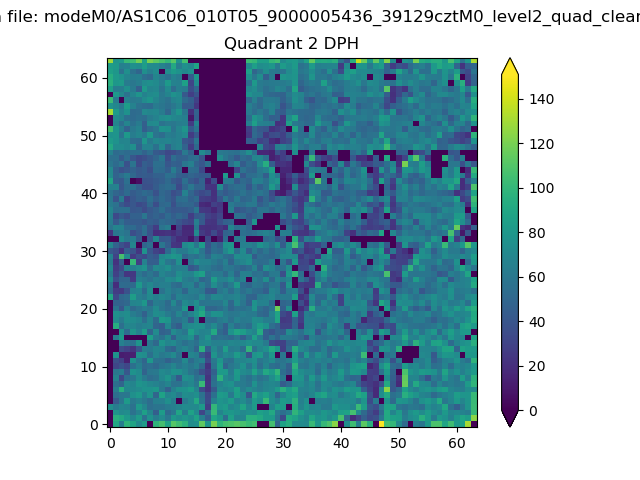 |
Quadrant C |
| Plot type | Count rate plots | Images |
|---|---|---|
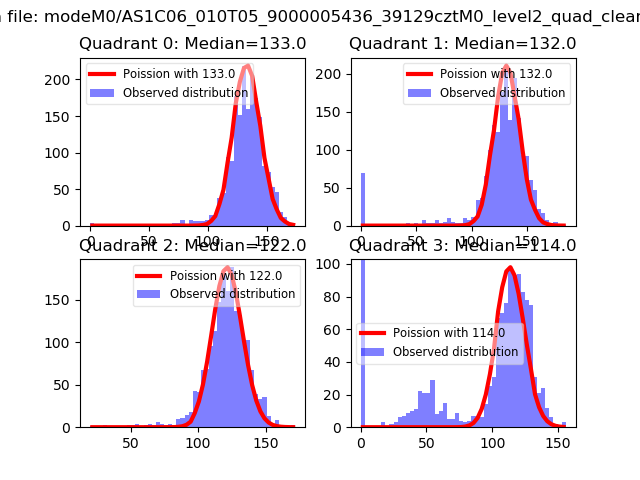
| Comparison with Poisson distribution Blue bars denote a histogram of data divided into 1 sec bins. Red curve is a Poisson curve with rate = median count rate of data. |
 |
 |
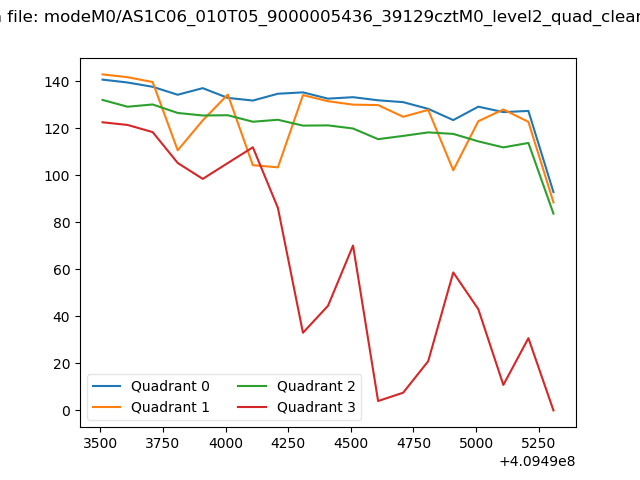
| Quadrant-wise count rates Data is divided into 100 sec bins |
 |
|
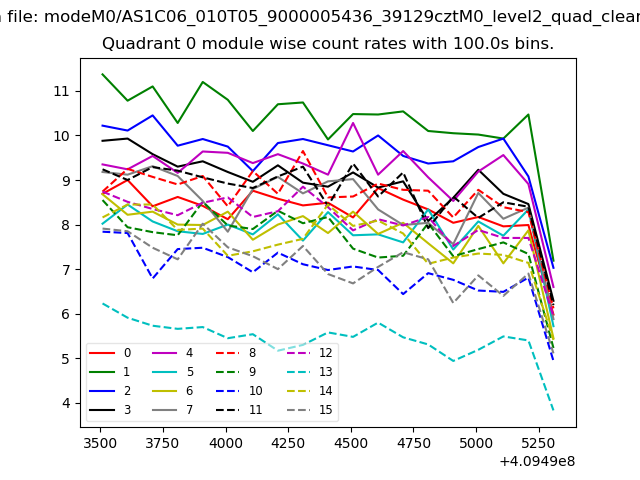
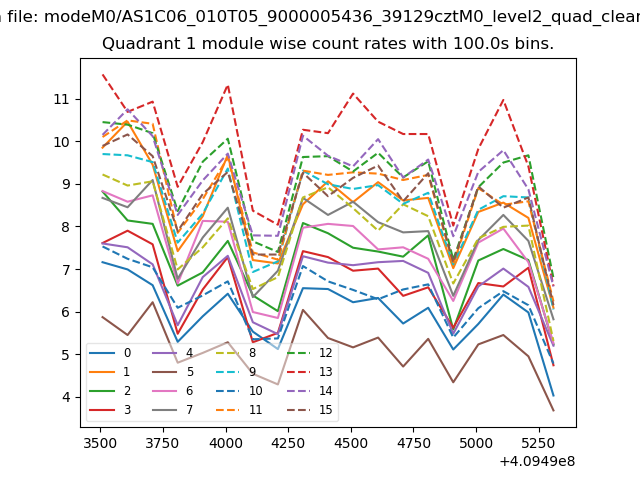
| Module-wise count rates for Quadrant A Data is divided into 100 sec bins |
 |
 |
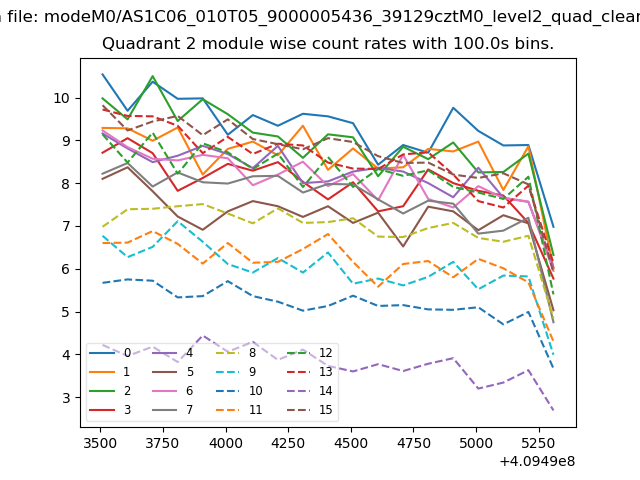
| Module-wise count rates for Quadrant B Data is divided into 100 sec bins |
 |
 |
| Module-wise count rates for Quadrant C Data is divided into 100 sec bins |
 |
 |
| Module-wise count rates for Quadrant D Data is divided into 100 sec bins |
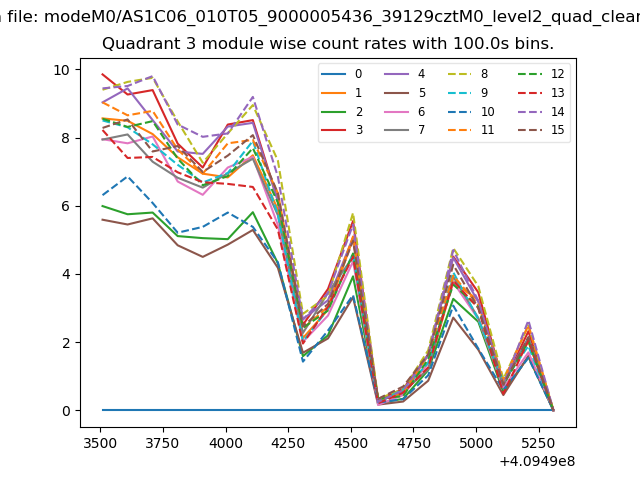 |
 |
| Parameter | Plot |
|---|---|
| CZT HV Monitor | 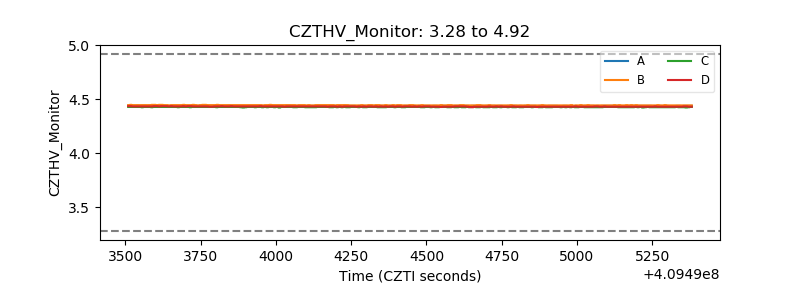 |
| D_VDD | 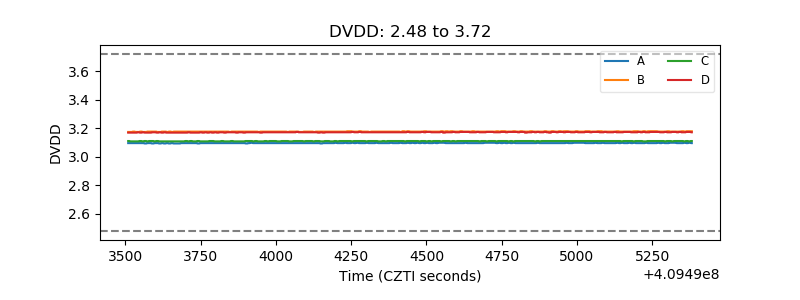 |
| Temperature 1 | 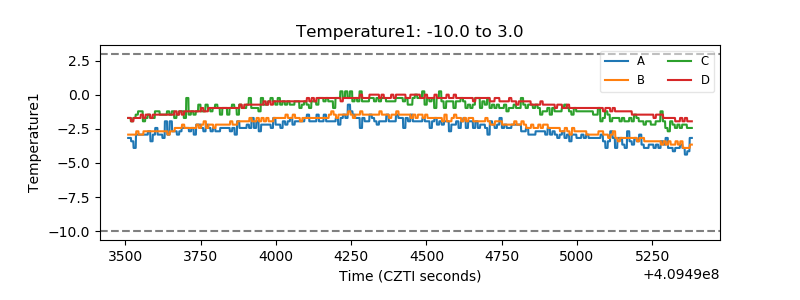 |
| Veto HV Monitor | 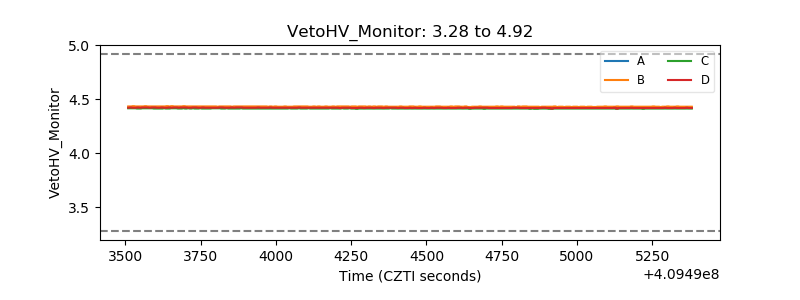 |
| Veto LLD | 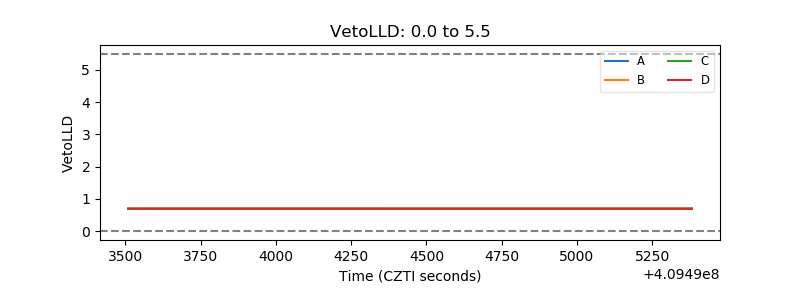 |
| Alpha Counter | 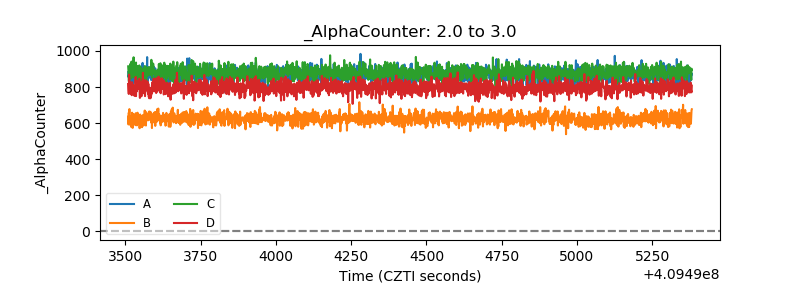 |
| _CPM_Rate | 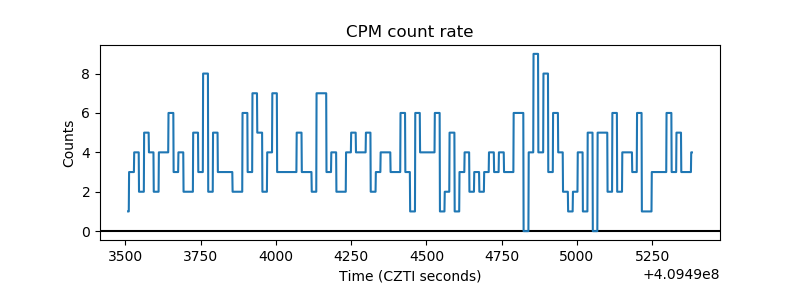 |
| CZT Counter | 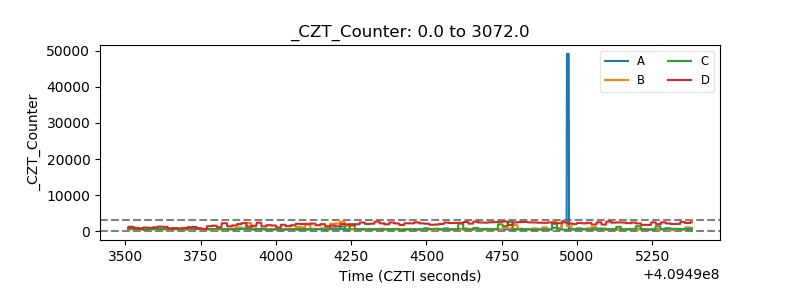 |
| +2.5 Volts monitor |  |
| +5 Volts monitor | 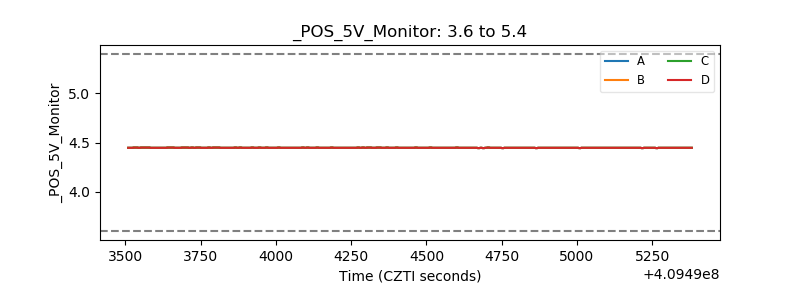 |
| _ROLL_ROT | 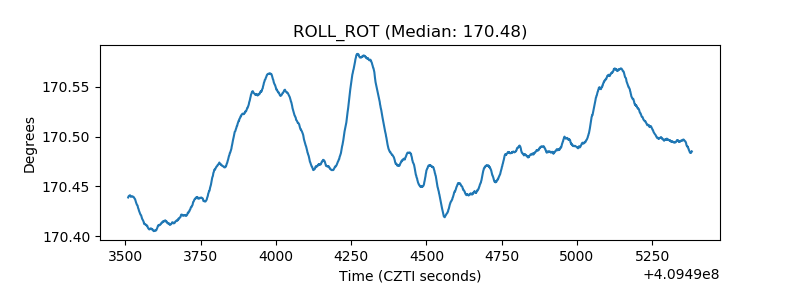 |
| _Roll_DEC | 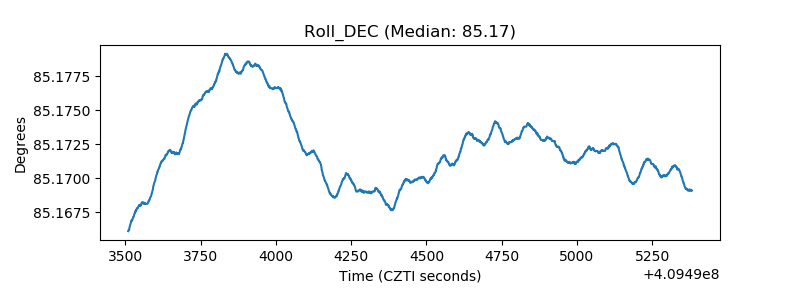 |
| _Roll_RA | 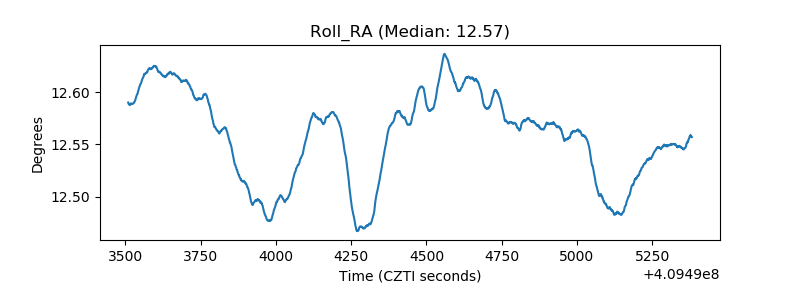 |
| Veto Counter | 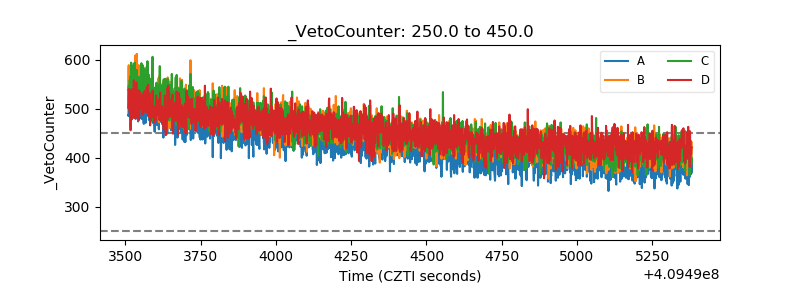 |