| Param | Original file | Final file |
|---|---|---|
| Filename | modeM0/AS1A12_054T02_9000005444_39144cztM0_level2.fits | modeM0/AS1A12_054T02_9000005444_39144cztM0_level2_quad_clean.evt |
| Size (bytes) | 73,788,480 | 14,653,440 |
| Size | 70.4 MB | 14.0 MB |
| Events in quadrant A | 541,088 | 103,710 |
| Events in quadrant B | 485,310 | 104,212 |
| Events in quadrant C | 439,160 | 95,566 |
| Events in quadrant D | 1,199,222 | 76,226 |
| Mode M9 | |||
|---|---|---|---|
| Quadrant | BADHDUFLAG | Total packets | Discarded packets |
| A | 0 | 17 | 0 |
| B | 0 | 17 | 0 |
| C | 0 | 17 | 0 |
| D | 0 | 17 | 0 |
| Mode M0 | |||
|---|---|---|---|
| Quadrant | BADHDUFLAG | Total packets | Discarded packets |
| A | 0 | 2167 | 2 |
| B | 0 | 1928 | 1 |
| C | 0 | 1734 | 1 |
| D | 0 | 4120 | 1 |
| Mode SS | |||
|---|---|---|---|
| Quadrant | BADHDUFLAG | Total packets | Discarded packets |
| A | 0 | 16 | 0 |
| B | 0 | 16 | 0 |
| C | 0 | 16 | 0 |
| D | 0 | 16 | 0 |
| Quadrant | Total seconds | Saturated seconds | Saturation percentage |
|---|---|---|---|
| A | 816 | 7 | 0.857843% |
| B | 816 | 2 | 0.245098% |
| C | 816 | 2 | 0.245098% |
| D | 816 | 182 | 22.303922% |
Noise dominated data is calculated using 1-second bins in cleaned event files. If a bin has >2000 counts, and if more than 50% of those come from <1% of pixels, then it is considered to be noise-dominated and hence unusable.
| Quadrant | # 1 sec bins | Bins with >0 counts | Bins with >2000 counts | High rate bins dominated by noise | Noise dominated (total time) | Noise dominated (detector-on time) | Marked lightcurve |
|---|---|---|---|---|---|---|---|
| A | 816 | 816 | 2 | 2 | 0.25% | 0.25% | 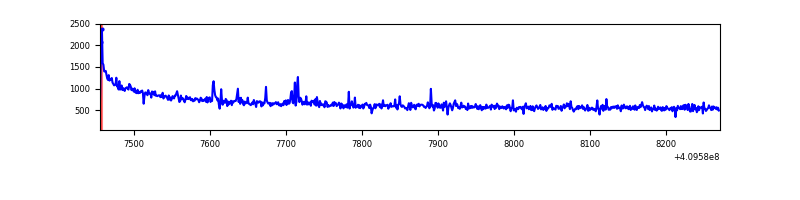 |
| B | 816 | 816 | 0 | 0 | 0.00% | 0.00% | 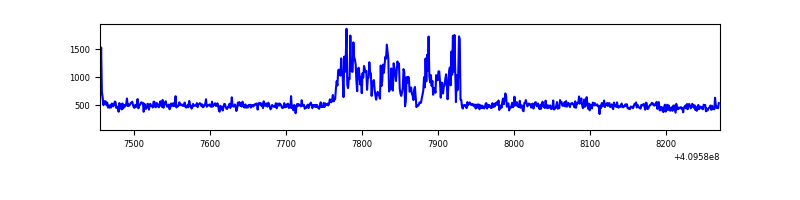 |
| C | 816 | 816 | 1 | 1 | 0.12% | 0.12% | 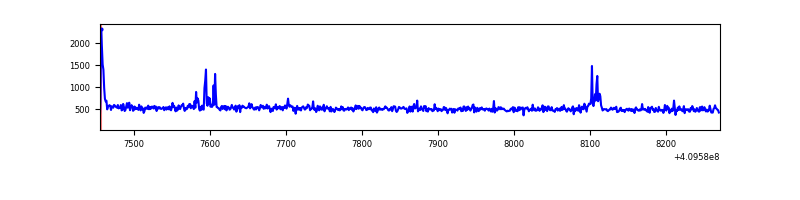 |
| D | 816 | 816 | 161 | 161 | 19.73% | 19.73% | 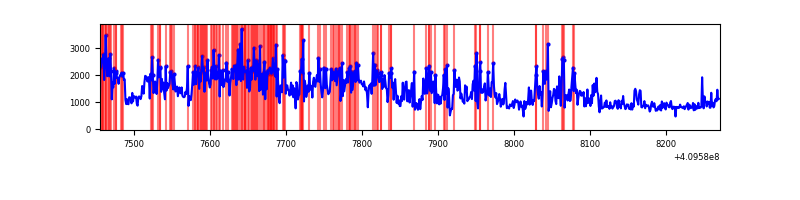 |
Top three noisy pixels from each quadrant. If the there are fewer than three noisy pixels in the level2.evt file, extra rows are filled as -1
| Pixel properties | Quadrant properties | ||||||
|---|---|---|---|---|---|---|---|
| Quadrant | DetID | PixID | Counts | Sigma | Mean | Median | Sigma |
| A | 10 | 83 | 126879 | 5674.53 | 102 | 100 | 22.3 |
| A | 13 | 248 | 5911 | 260.1 | 102 | 100 | 22.3 |
| A | 15 | 223 | 4988 | 218.78 | 102 | 100 | 22.3 |
| B | 5 | 172 | 87388 | 4098.0 | 99 | 97 | 21.3 |
| B | 4 | 80 | 2451 | 110.51 | 99 | 97 | 21.3 |
| B | 12 | 111 | 2197 | 98.59 | 99 | 97 | 21.3 |
| C | 15 | 214 | 38697 | 1577.55 | 97 | 97 | 24.5 |
| C | 9 | 187 | 14700 | 596.81 | 97 | 97 | 24.5 |
| C | 0 | 10 | 6963 | 280.61 | 97 | 97 | 24.5 |
| D | 12 | 235 | 763210 | 30228.48 | 94 | 90 | 25.2 |
| D | 5 | 222 | 48209 | 1906.08 | 94 | 90 | 25.2 |
| D | 14 | 52 | 7997 | 313.21 | 94 | 90 | 25.2 |
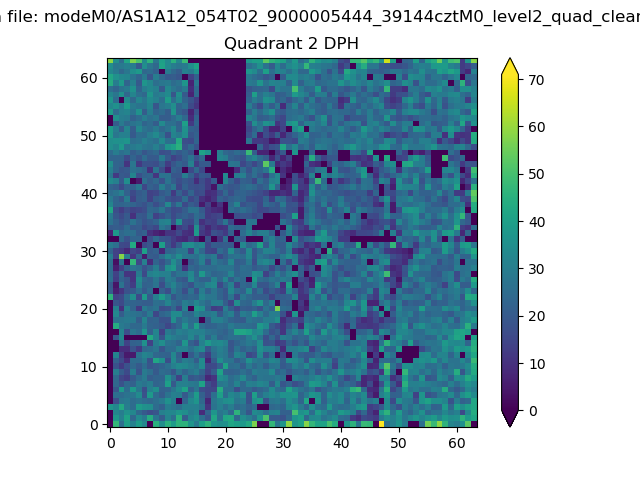
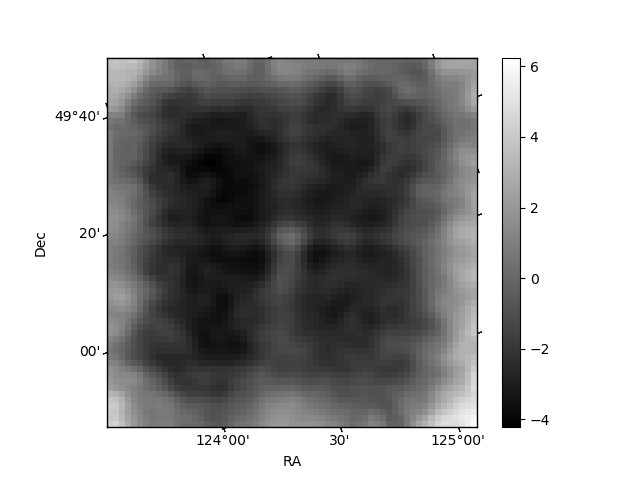
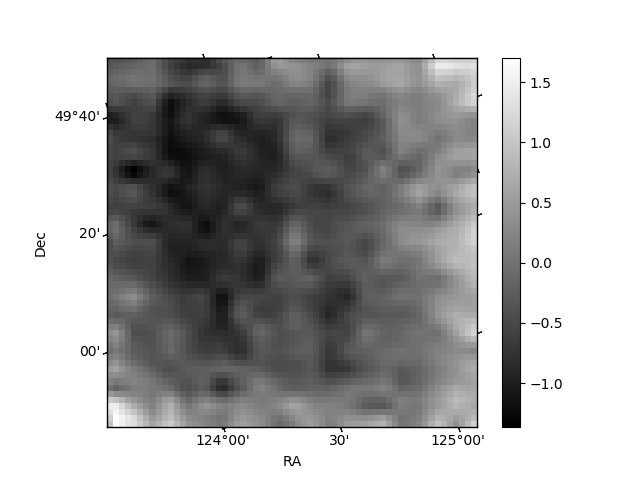
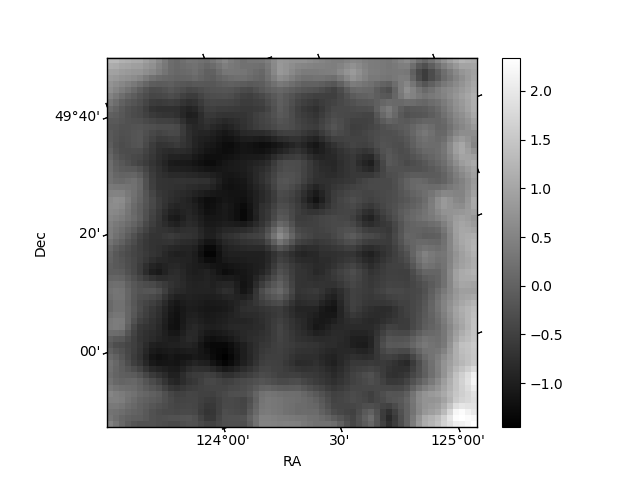
Histogram calculated using DETX and DETY for each event in the final _common_clean file
| Quadrant A | 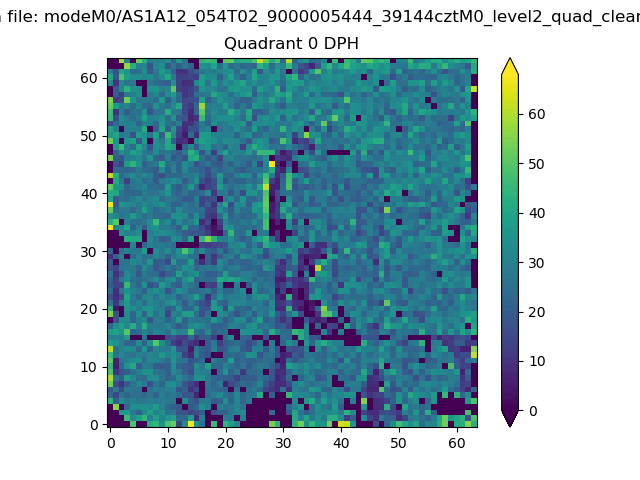 |
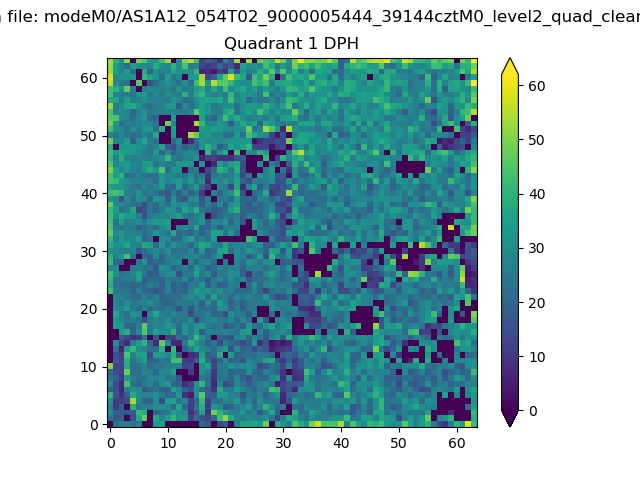 |
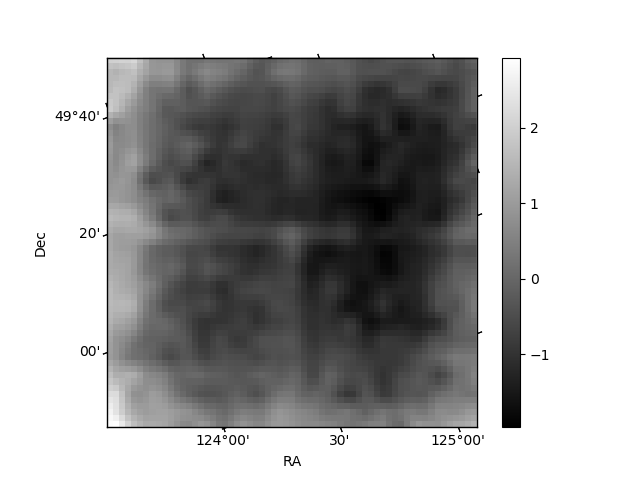
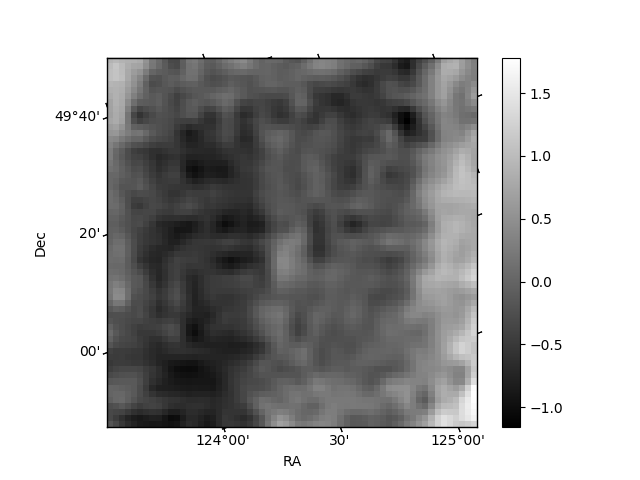
Quadrant B |
|---|---|---|---|
| Quadrant D | 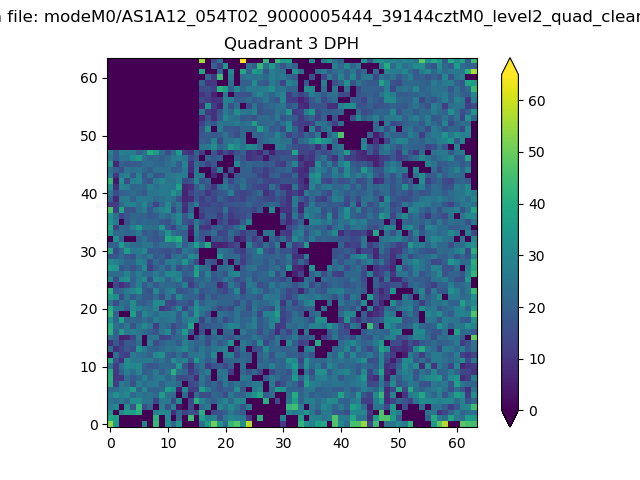 |
 |
Quadrant C |
| Plot type | Count rate plots | Images |
|---|---|---|
| Comparison with Poisson distribution Blue bars denote a histogram of data divided into 1 sec bins. Red curve is a Poisson curve with rate = median count rate of data. |
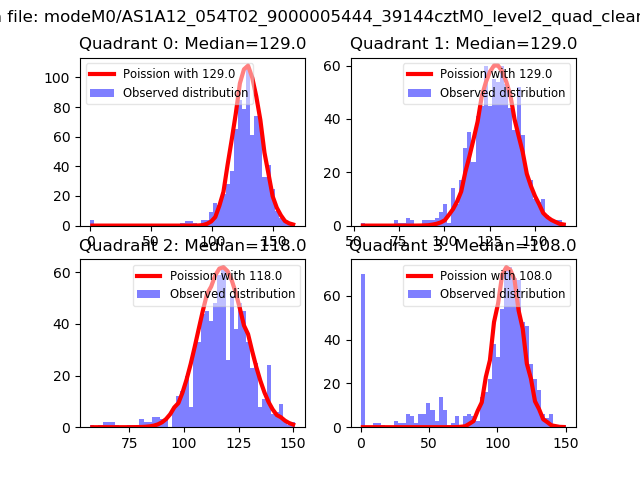 |
 |
| Quadrant-wise count rates Data is divided into 100 sec bins |
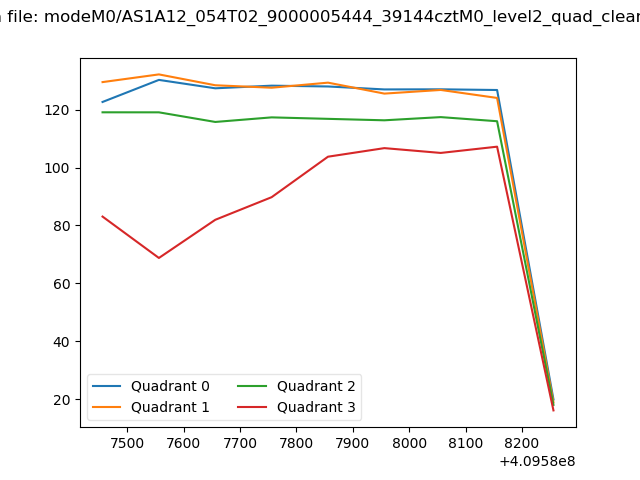 |
|
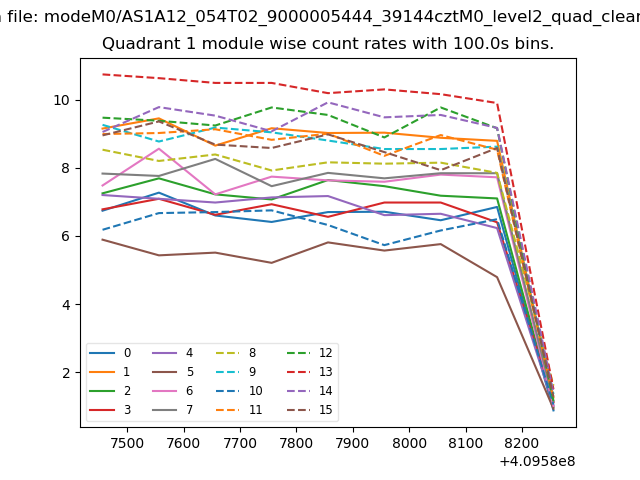
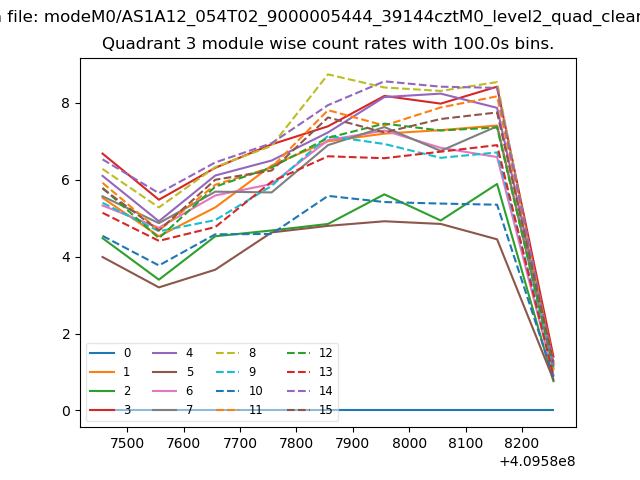
| Module-wise count rates for Quadrant A Data is divided into 100 sec bins |
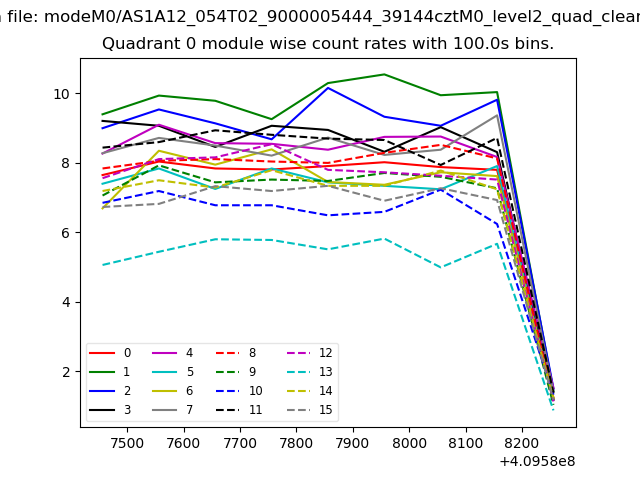 |
 |
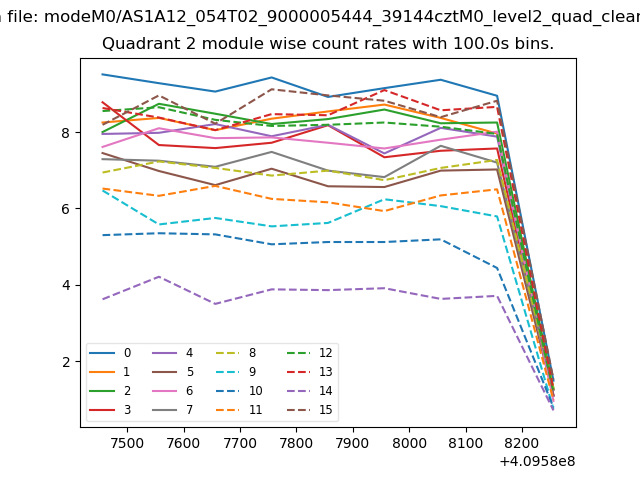
| Module-wise count rates for Quadrant B Data is divided into 100 sec bins |
 |
 |
| Module-wise count rates for Quadrant C Data is divided into 100 sec bins |
 |
 |
| Module-wise count rates for Quadrant D Data is divided into 100 sec bins |
 |
 |
| Parameter | Plot |
|---|---|
| CZT HV Monitor | 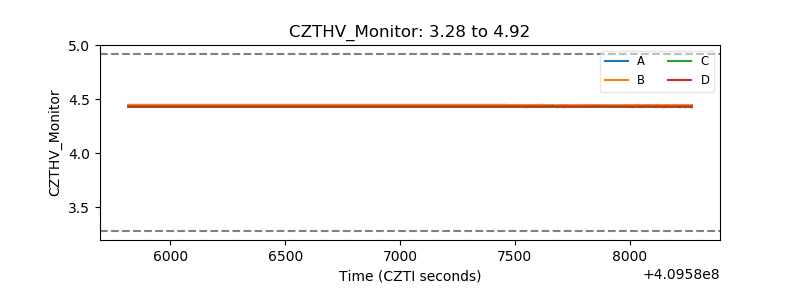 |
| D_VDD | 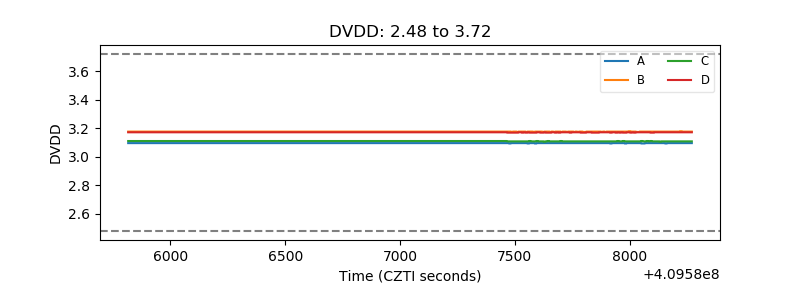 |
| Temperature 1 | 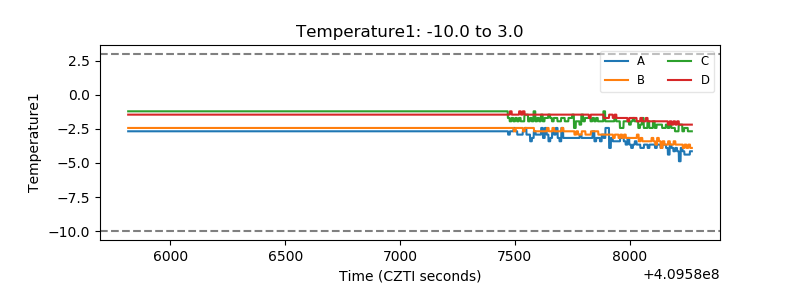 |
| Veto HV Monitor | 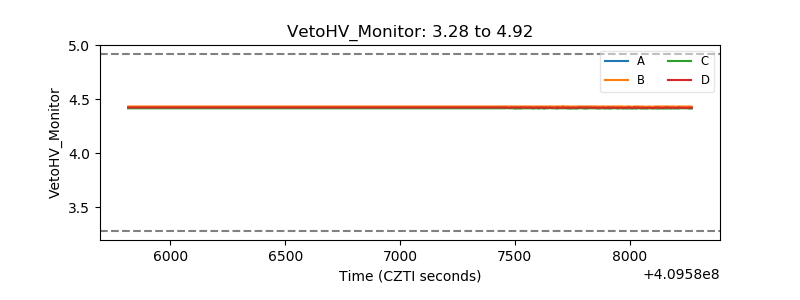 |
| Veto LLD | 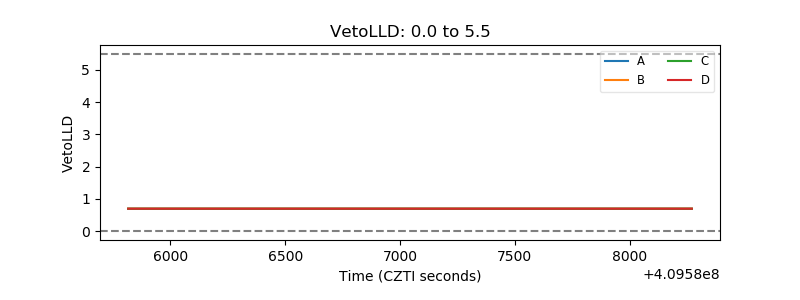 |
| Alpha Counter | 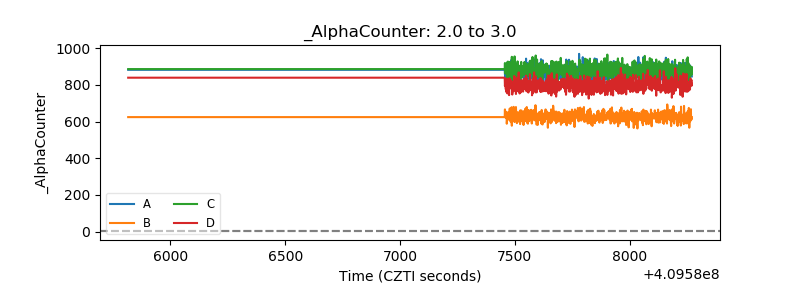 |
| _CPM_Rate | 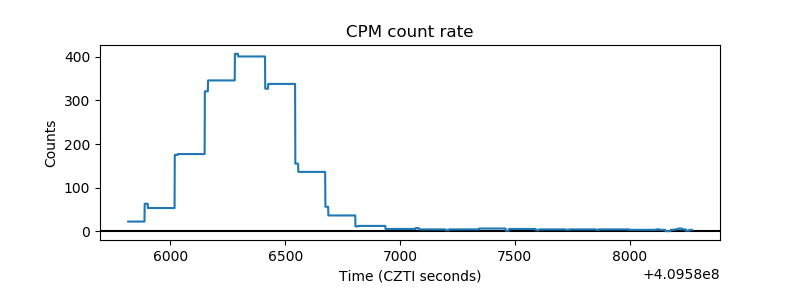 |
| CZT Counter | 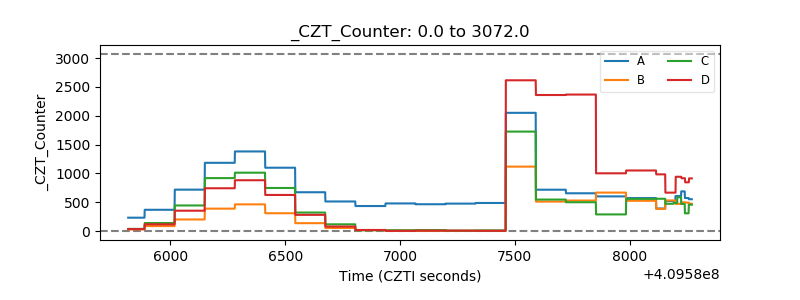 |
| +2.5 Volts monitor | 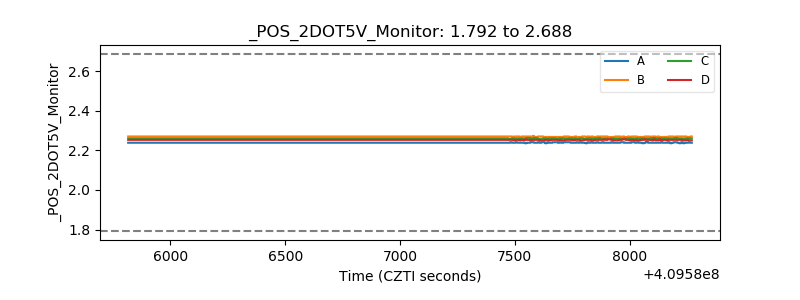 |
| +5 Volts monitor | 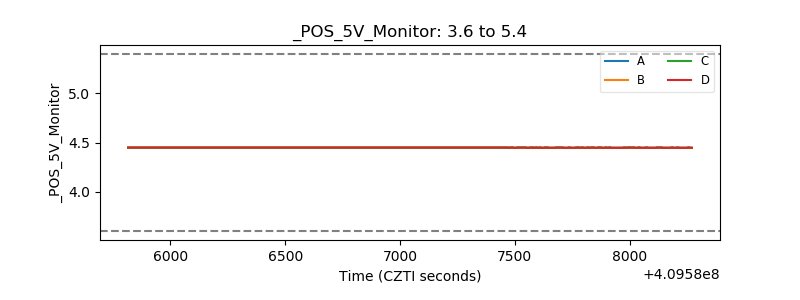 |
| _ROLL_ROT | 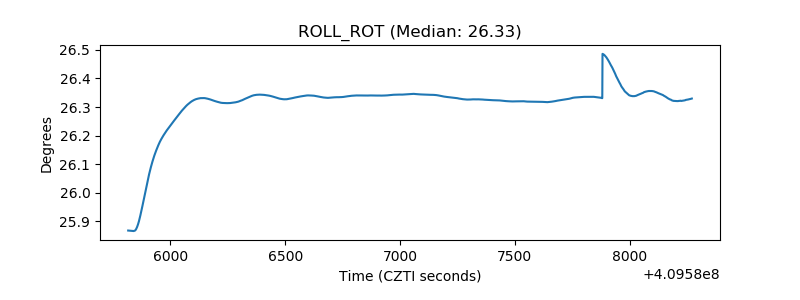 |
| _Roll_DEC | 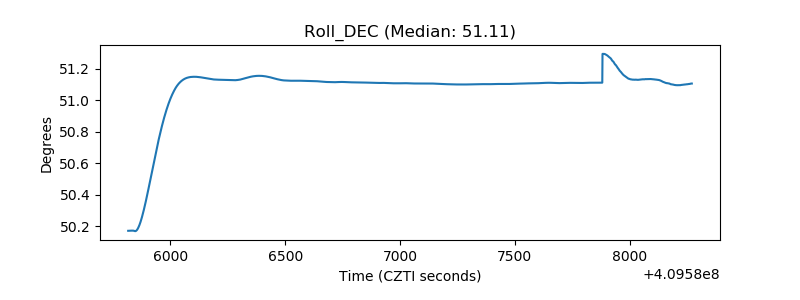 |
| _Roll_RA | 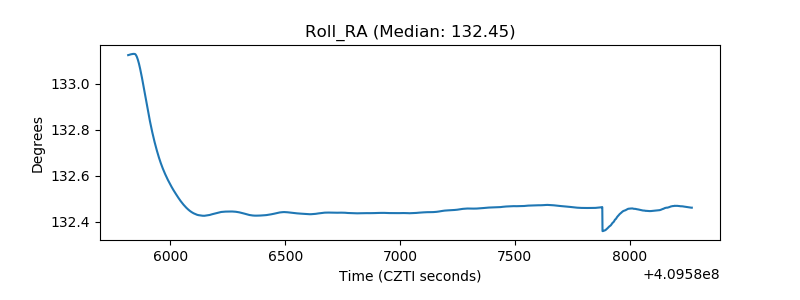 |
| Veto Counter | 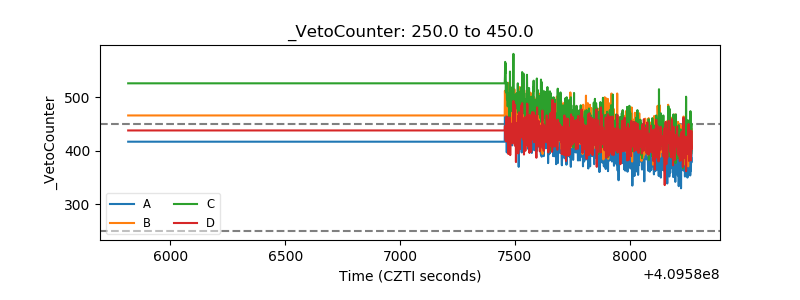 |