| Param | Original file | Final file |
|---|---|---|
| Filename | modeM0/AS1A12_054T02_9000005444_39145cztM0_level2.fits | modeM0/AS1A12_054T02_9000005444_39145cztM0_level2_quad_clean.evt |
| Size (bytes) | 395,487,360 | 85,916,160 |
| Size | 377.2 MB | 81.9 MB |
| Events in quadrant A | 2,738,904 | 601,043 |
| Events in quadrant B | 2,333,494 | 606,213 |
| Events in quadrant C | 2,473,210 | 569,894 |
| Events in quadrant D | 6,704,593 | 473,146 |
| Mode M9 | |||
|---|---|---|---|
| Quadrant | BADHDUFLAG | Total packets | Discarded packets |
| A | 0 | 34 | 0 |
| B | 0 | 34 | 0 |
| C | 0 | 34 | 0 |
| D | 0 | 35 | 0 |
| Mode M0 | |||
|---|---|---|---|
| Quadrant | BADHDUFLAG | Total packets | Discarded packets |
| A | 0 | 11316 | 3 |
| B | 0 | 10430 | 2 |
| C | 0 | 10453 | 2 |
| D | 0 | 23447 | 2 |
| Mode SS | |||
|---|---|---|---|
| Quadrant | BADHDUFLAG | Total packets | Discarded packets |
| A | 0 | 102 | 0 |
| B | 0 | 102 | 0 |
| C | 0 | 102 | 0 |
| D | 0 | 102 | 0 |
| Quadrant | Total seconds | Saturated seconds | Saturation percentage |
|---|---|---|---|
| A | 5010 | 31 | 0.618762% |
| B | 5010 | 7 | 0.139721% |
| C | 5010 | 9 | 0.179641% |
| D | 5010 | 786 | 15.688623% |
Noise dominated data is calculated using 1-second bins in cleaned event files. If a bin has >2000 counts, and if more than 50% of those come from <1% of pixels, then it is considered to be noise-dominated and hence unusable.
| Quadrant | # 1 sec bins | Bins with >0 counts | Bins with >2000 counts | High rate bins dominated by noise | Noise dominated (total time) | Noise dominated (detector-on time) | Marked lightcurve |
|---|---|---|---|---|---|---|---|
| A | 7013 | 5011 | 14 | 14 | 0.20% | 0.28% | 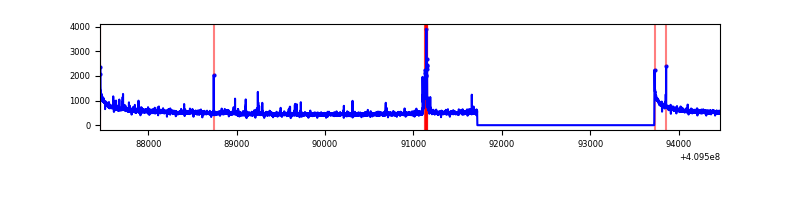 |
| B | 7013 | 5011 | 4 | 4 | 0.06% | 0.08% | 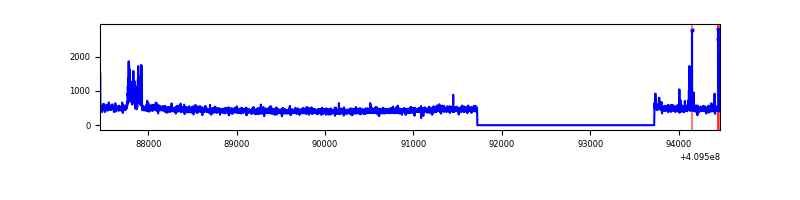 |
| C | 7013 | 5011 | 3 | 3 | 0.04% | 0.06% | 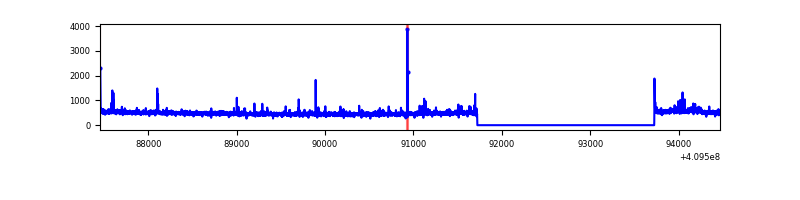 |
| D | 7013 | 5011 | 701 | 701 | 10.00% | 13.99% | 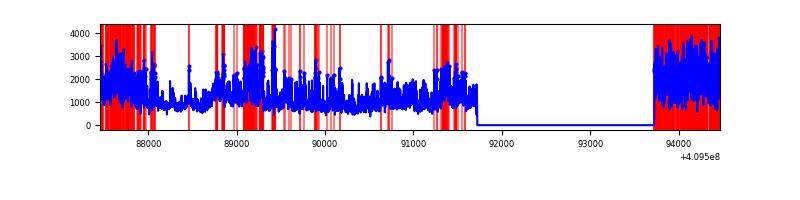 |
Top three noisy pixels from each quadrant. If the there are fewer than three noisy pixels in the level2.evt file, extra rows are filled as -1
| Pixel properties | Quadrant properties | ||||||
|---|---|---|---|---|---|---|---|
| Quadrant | DetID | PixID | Counts | Sigma | Mean | Median | Sigma |
| A | 10 | 83 | 409566 | 3578.8 | 563 | 552 | 114.3 |
| A | 14 | 235 | 81017 | 704.05 | 563 | 552 | 114.3 |
| A | 9 | 143 | 29850 | 256.35 | 563 | 552 | 114.3 |
| B | 5 | 172 | 101026 | 931.31 | 560 | 545 | 107.9 |
| B | 15 | 85 | 20850 | 188.2 | 560 | 545 | 107.9 |
| B | 12 | 111 | 12914 | 114.64 | 560 | 545 | 107.9 |
| C | 15 | 214 | 209867 | 1629.01 | 549 | 551 | 128.5 |
| C | 9 | 187 | 72713 | 561.6 | 549 | 551 | 128.5 |
| C | 2 | 16 | 33284 | 254.74 | 549 | 551 | 128.5 |
| D | 12 | 235 | 4099605 | 31941.4 | 525 | 509 | 128.3 |
| D | 5 | 222 | 331478 | 2579.01 | 525 | 509 | 128.3 |
| D | 2 | 249 | 129069 | 1001.78 | 525 | 509 | 128.3 |
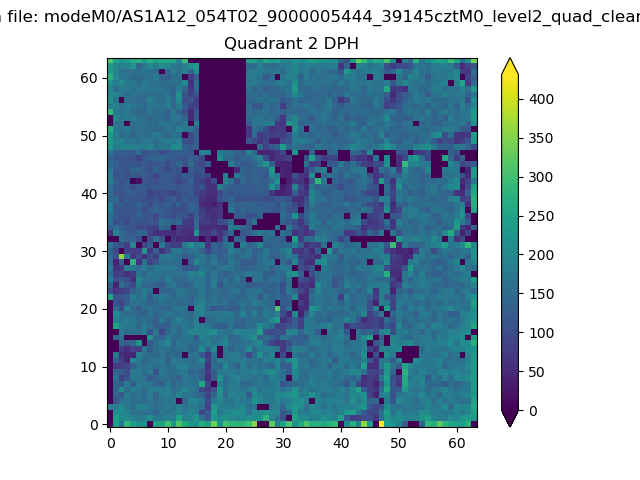
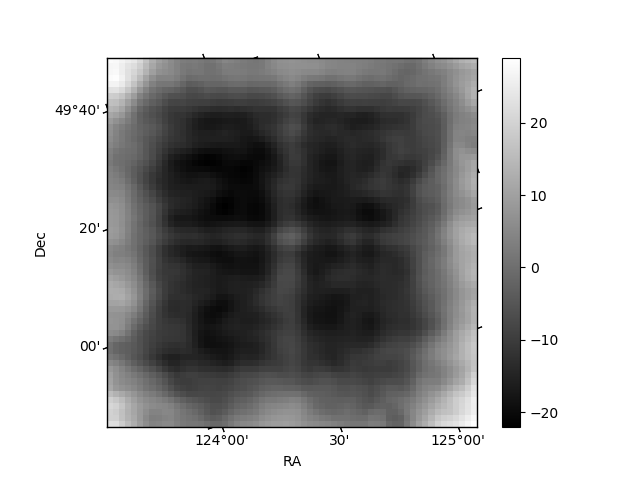
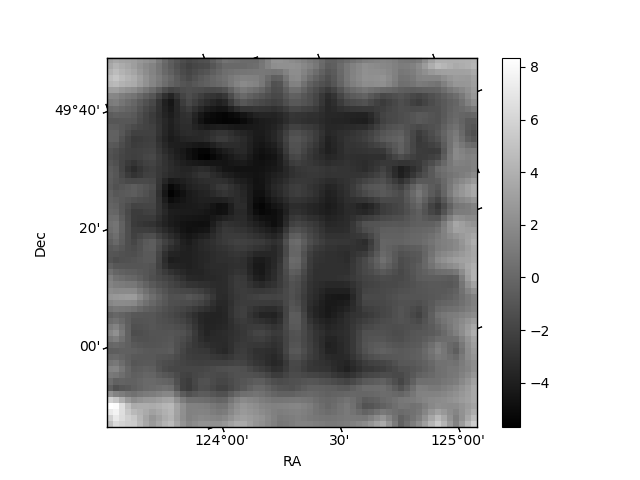
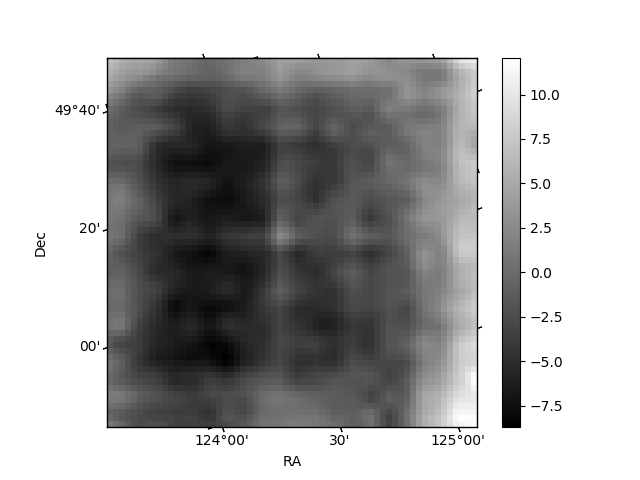
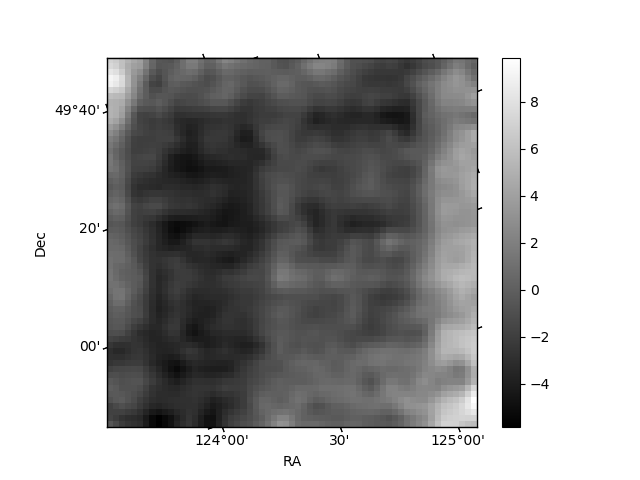
Histogram calculated using DETX and DETY for each event in the final _common_clean file
| Quadrant A | 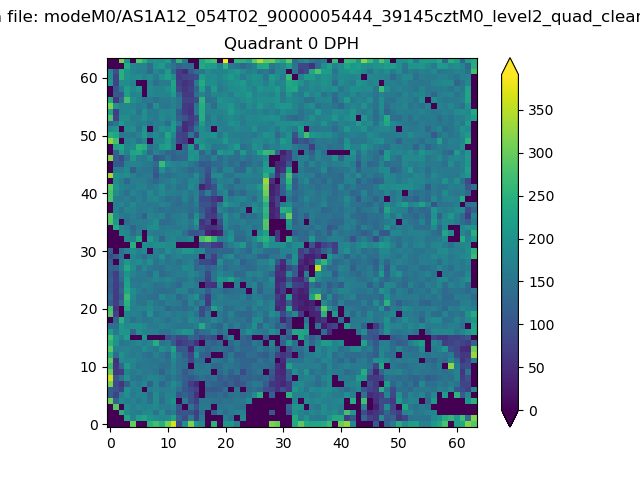 |
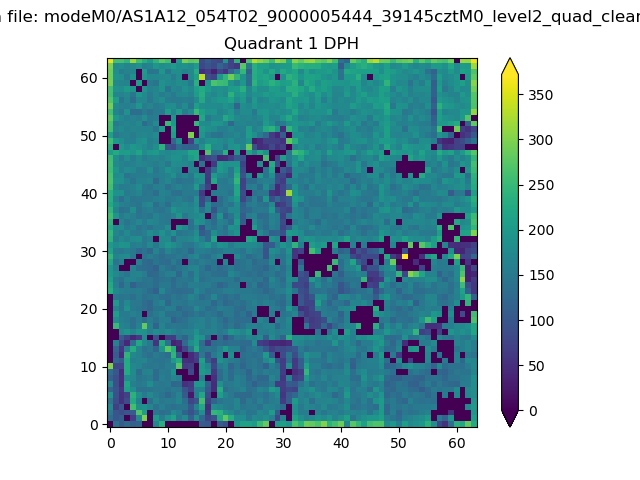 |
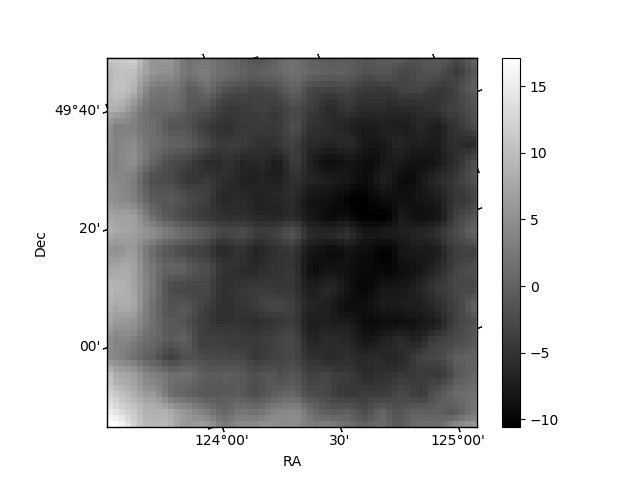
Quadrant B |
|---|---|---|---|
| Quadrant D | 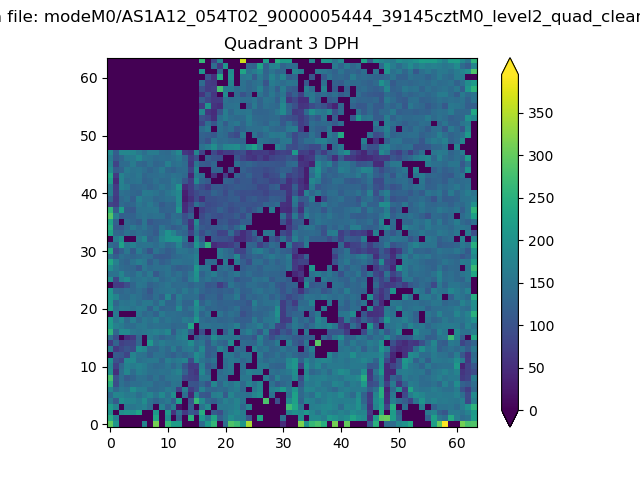 |
 |
Quadrant C |
| Plot type | Count rate plots | Images |
|---|---|---|
| Comparison with Poisson distribution Blue bars denote a histogram of data divided into 1 sec bins. Red curve is a Poisson curve with rate = median count rate of data. |
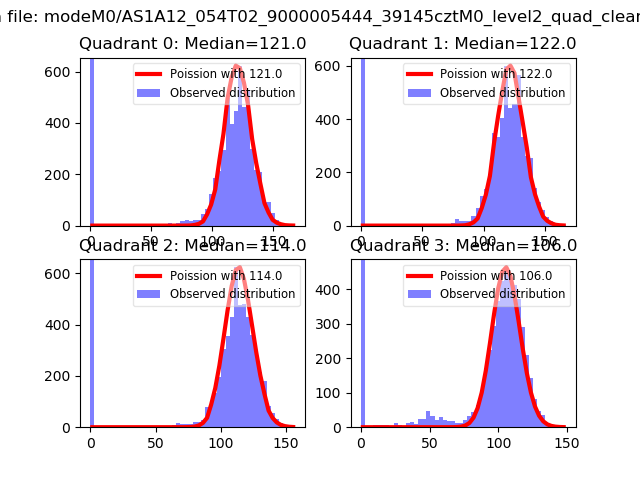 |
 |
| Quadrant-wise count rates Data is divided into 100 sec bins |
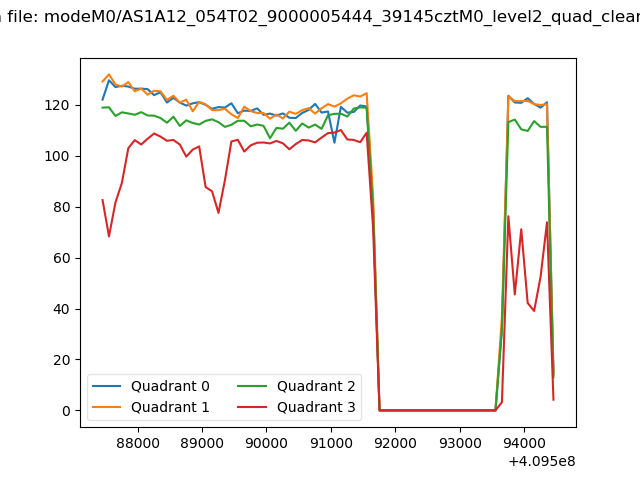 |
|
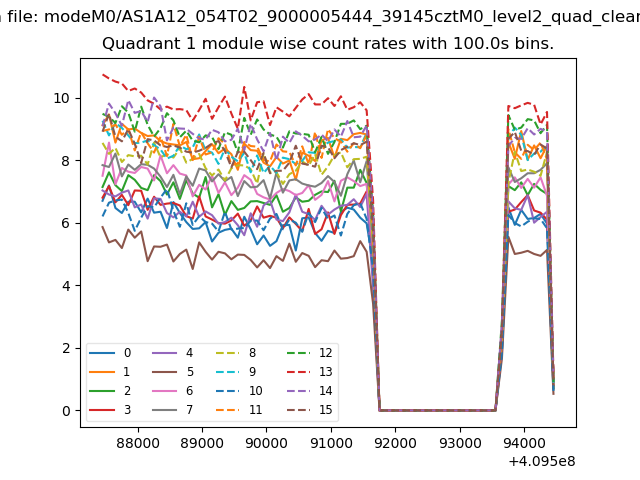
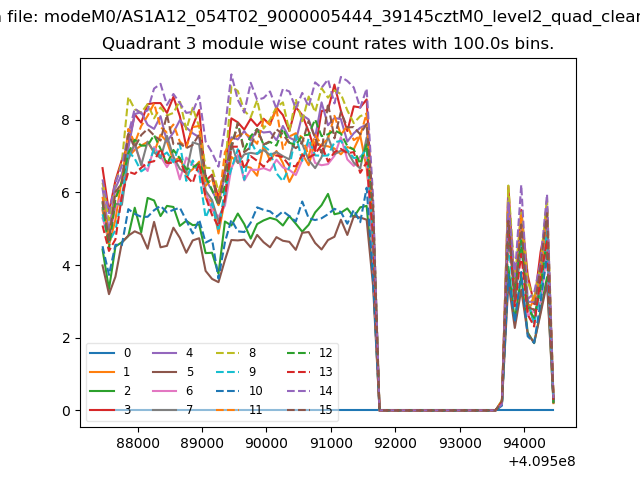
| Module-wise count rates for Quadrant A Data is divided into 100 sec bins |
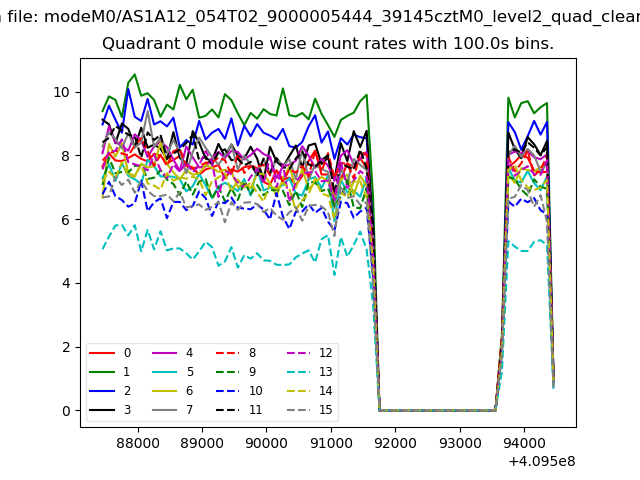 |
 |
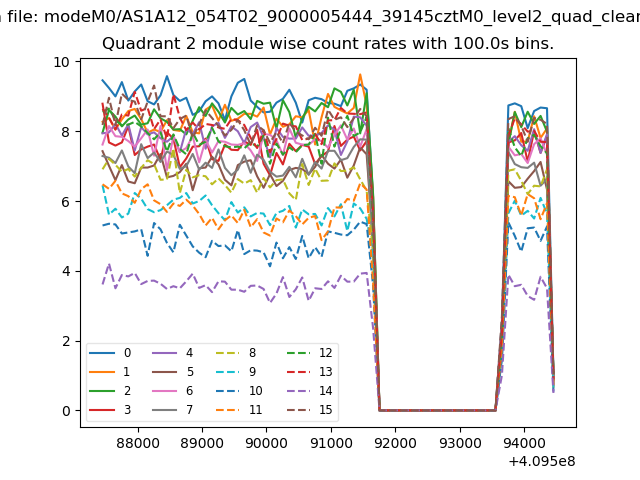
| Module-wise count rates for Quadrant B Data is divided into 100 sec bins |
 |
 |
| Module-wise count rates for Quadrant C Data is divided into 100 sec bins |
 |
 |
| Module-wise count rates for Quadrant D Data is divided into 100 sec bins |
 |
 |
| Parameter | Plot |
|---|---|
| CZT HV Monitor | 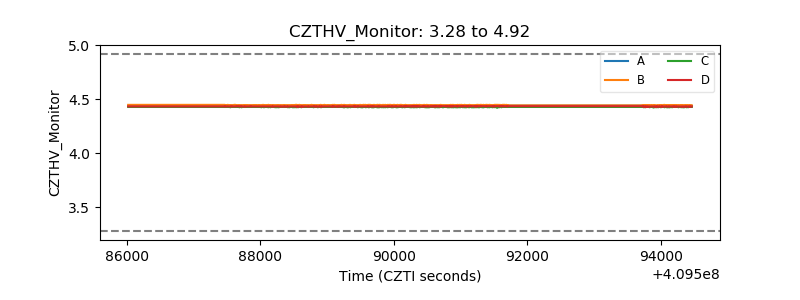 |
| D_VDD | 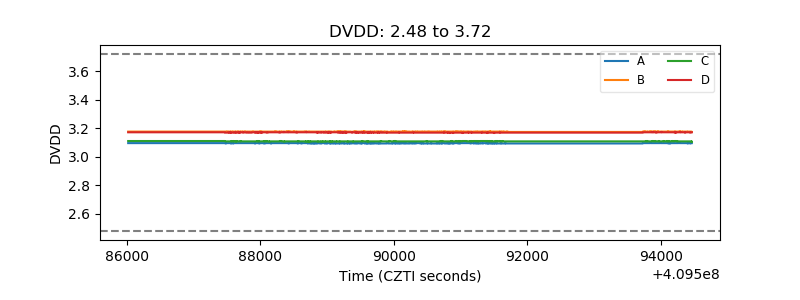 |
| Temperature 1 | 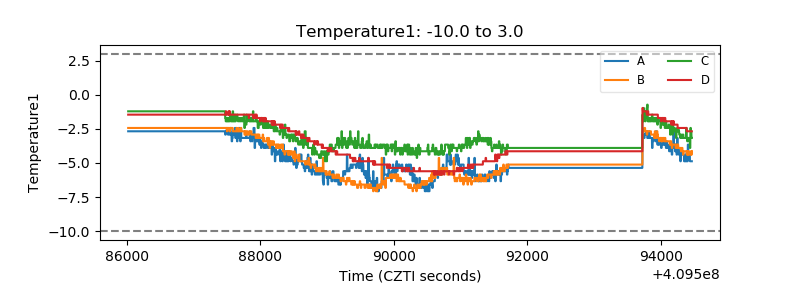 |
| Veto HV Monitor | 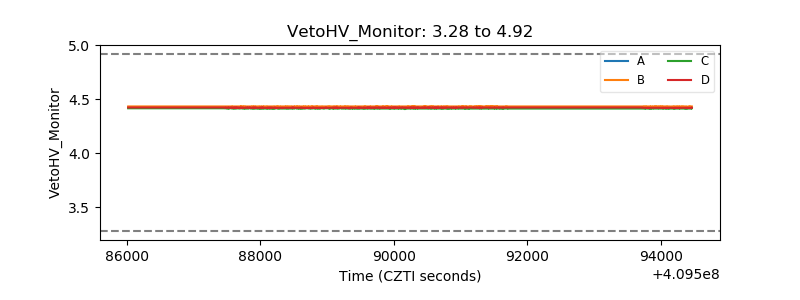 |
| Veto LLD | 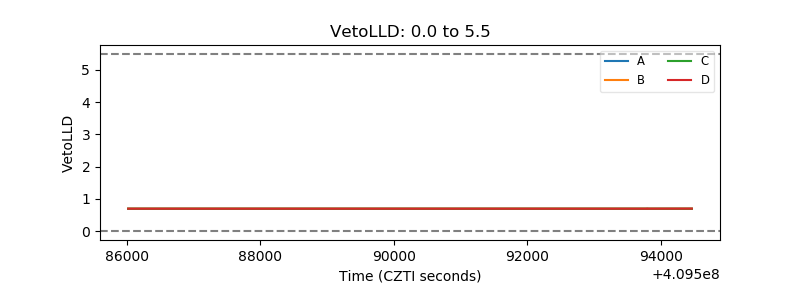 |
| Alpha Counter | 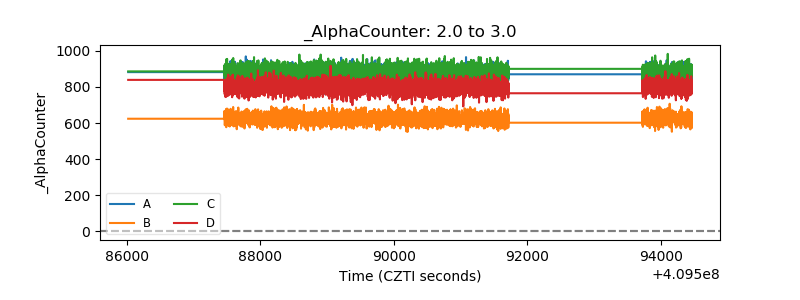 |
| _CPM_Rate | 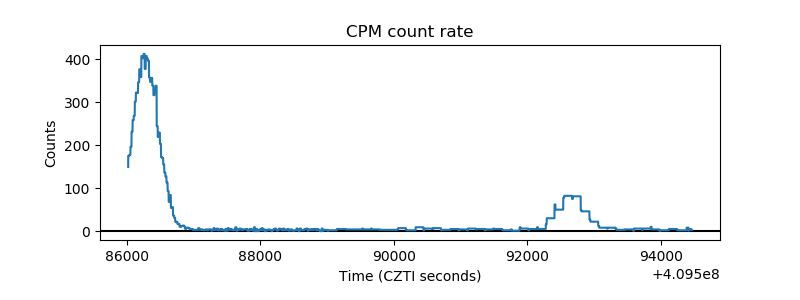 |
| CZT Counter | 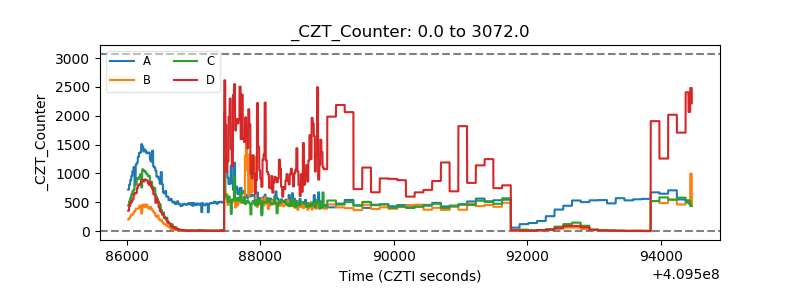 |
| +2.5 Volts monitor | 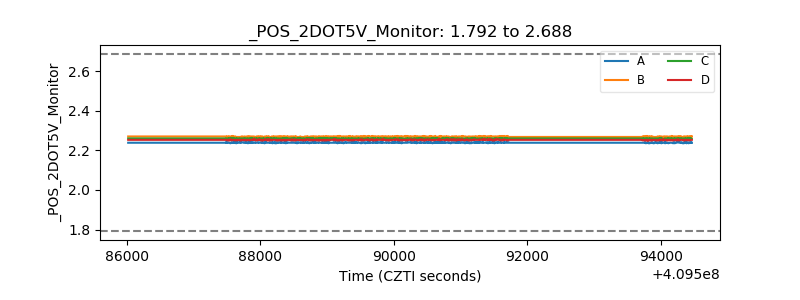 |
| +5 Volts monitor | 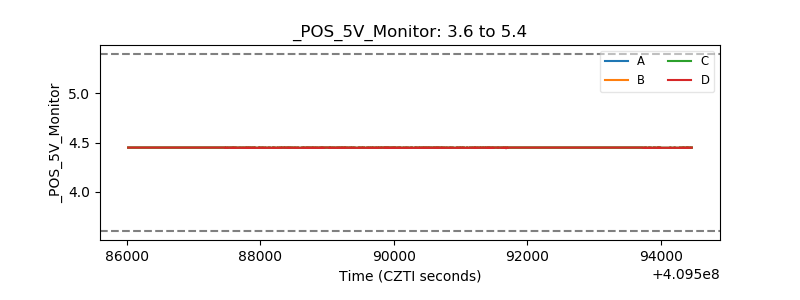 |
| _ROLL_ROT | 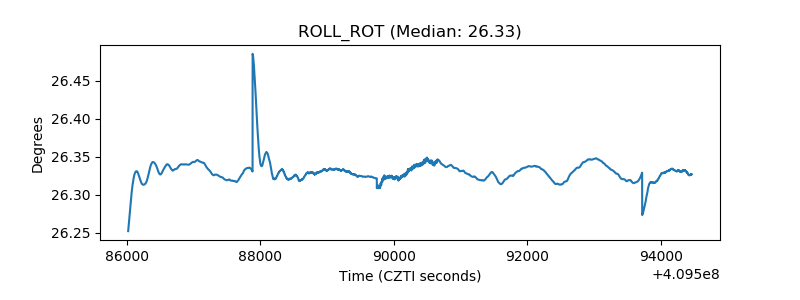 |
| _Roll_DEC | 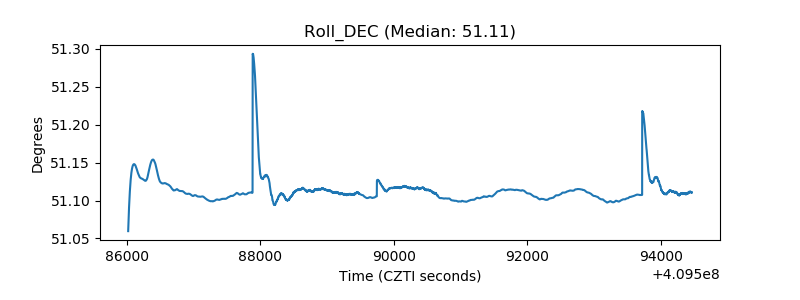 |
| _Roll_RA |  |
| Veto Counter | 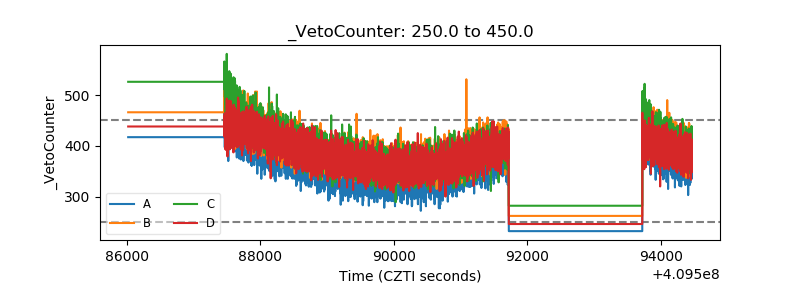 |