| Param | Original file | Final file |
|---|---|---|
| Filename | modeM0/AS1A12_054T02_9000005444_39146cztM0_level2.fits | modeM0/AS1A12_054T02_9000005444_39146cztM0_level2_quad_clean.evt |
| Size (bytes) | 428,241,600 | 89,847,360 |
| Size | 408.4 MB | 85.7 MB |
| Events in quadrant A | 2,906,033 | 630,600 |
| Events in quadrant B | 2,416,096 | 634,401 |
| Events in quadrant C | 2,701,826 | 602,622 |
| Events in quadrant D | 7,405,733 | 472,010 |
| Mode M9 | |||
|---|---|---|---|
| Quadrant | BADHDUFLAG | Total packets | Discarded packets |
| A | 0 | 28 | 0 |
| B | 0 | 28 | 0 |
| C | 0 | 28 | 0 |
| D | 0 | 29 | 0 |
| Mode M0 | |||
|---|---|---|---|
| Quadrant | BADHDUFLAG | Total packets | Discarded packets |
| A | 0 | 12028 | 3 |
| B | 0 | 11023 | 2 |
| C | 0 | 11495 | 2 |
| D | 0 | 25768 | 2 |
| Mode SS | |||
|---|---|---|---|
| Quadrant | BADHDUFLAG | Total packets | Discarded packets |
| A | 0 | 112 | 0 |
| B | 0 | 112 | 0 |
| C | 0 | 112 | 0 |
| D | 0 | 112 | 0 |
| Quadrant | Total seconds | Saturated seconds | Saturation percentage |
|---|---|---|---|
| A | 5434 | 32 | 0.588885% |
| B | 5434 | 8 | 0.147221% |
| C | 5434 | 13 | 0.239234% |
| D | 5434 | 1180 | 21.715127% |
Noise dominated data is calculated using 1-second bins in cleaned event files. If a bin has >2000 counts, and if more than 50% of those come from <1% of pixels, then it is considered to be noise-dominated and hence unusable.
| Quadrant | # 1 sec bins | Bins with >0 counts | Bins with >2000 counts | High rate bins dominated by noise | Noise dominated (total time) | Noise dominated (detector-on time) | Marked lightcurve |
|---|---|---|---|---|---|---|---|
| A | 7108 | 5435 | 18 | 18 | 0.25% | 0.33% | 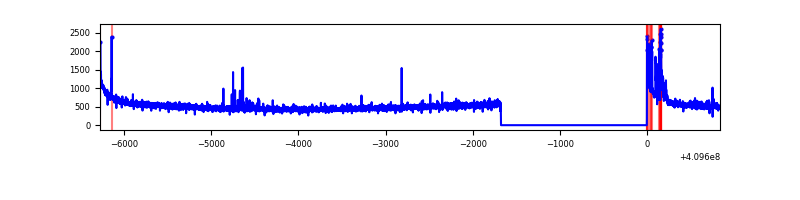 |
| B | 7108 | 5435 | 4 | 4 | 0.06% | 0.07% | 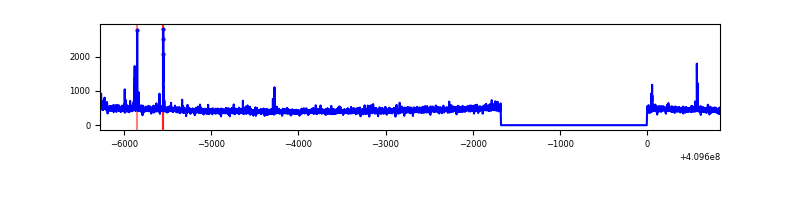 |
| C | 7108 | 5435 | 7 | 7 | 0.10% | 0.13% | 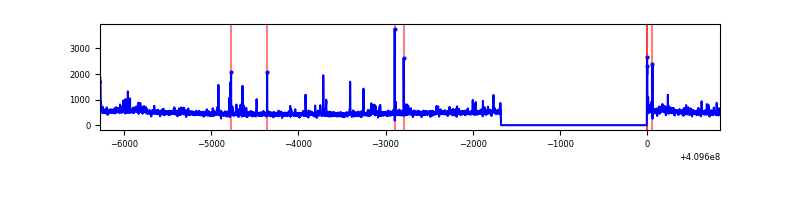 |
| D | 7108 | 5435 | 1104 | 1104 | 15.53% | 20.31% | 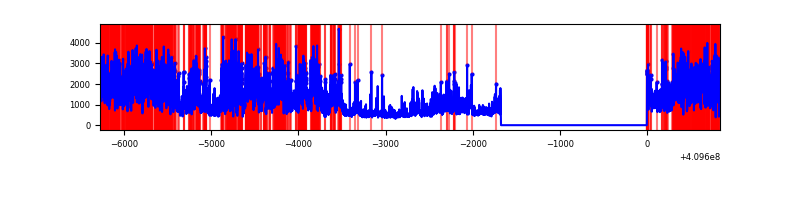 |
Top three noisy pixels from each quadrant. If the there are fewer than three noisy pixels in the level2.evt file, extra rows are filled as -1
| Pixel properties | Quadrant properties | ||||||
|---|---|---|---|---|---|---|---|
| Quadrant | DetID | PixID | Counts | Sigma | Mean | Median | Sigma |
| A | 10 | 83 | 436014 | 3556.63 | 602 | 590 | 122.4 |
| A | 0 | 230 | 74735 | 605.63 | 602 | 590 | 122.4 |
| A | 15 | 223 | 26295 | 209.96 | 602 | 590 | 122.4 |
| B | 5 | 172 | 29927 | 253.01 | 597 | 579 | 116.0 |
| B | 15 | 85 | 22821 | 191.75 | 597 | 579 | 116.0 |
| B | 12 | 111 | 14475 | 119.8 | 597 | 579 | 116.0 |
| C | 15 | 214 | 225984 | 1660.01 | 586 | 589 | 135.8 |
| C | 9 | 187 | 109003 | 798.46 | 586 | 589 | 135.8 |
| C | 2 | 16 | 63103 | 460.41 | 586 | 589 | 135.8 |
| D | 12 | 235 | 4506669 | 32914.09 | 550 | 536 | 136.9 |
| D | 2 | 249 | 348793 | 2543.77 | 550 | 536 | 136.9 |
| D | 2 | 250 | 75852 | 550.13 | 550 | 536 | 136.9 |
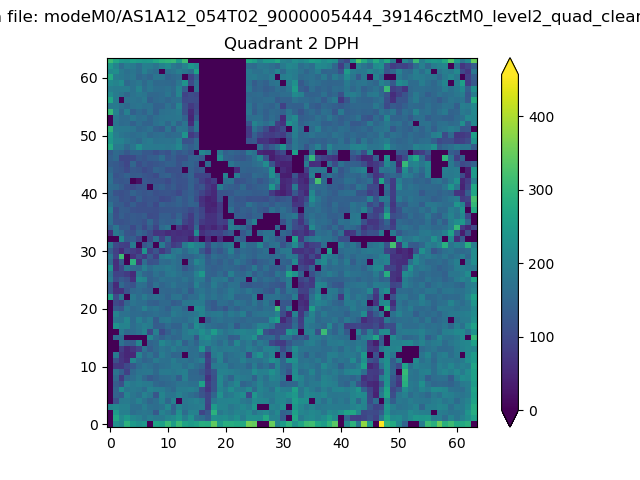
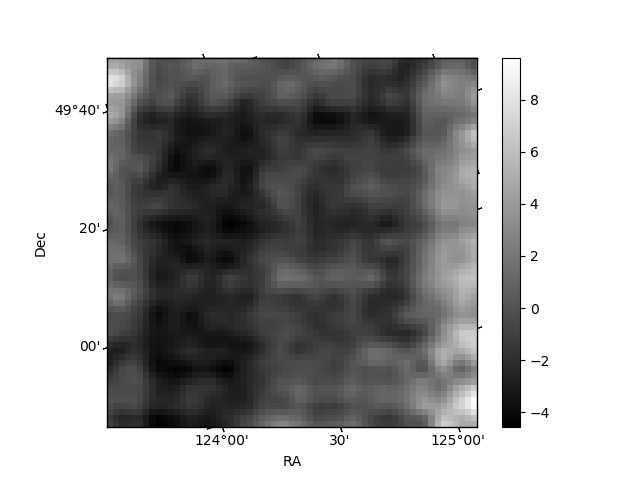
Histogram calculated using DETX and DETY for each event in the final _common_clean file
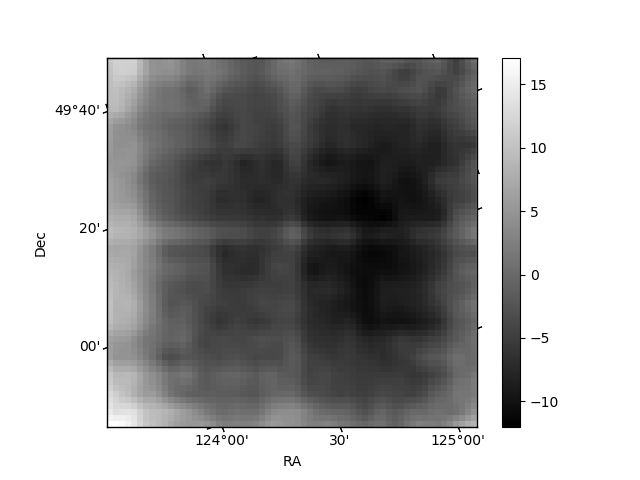
| Quadrant A | 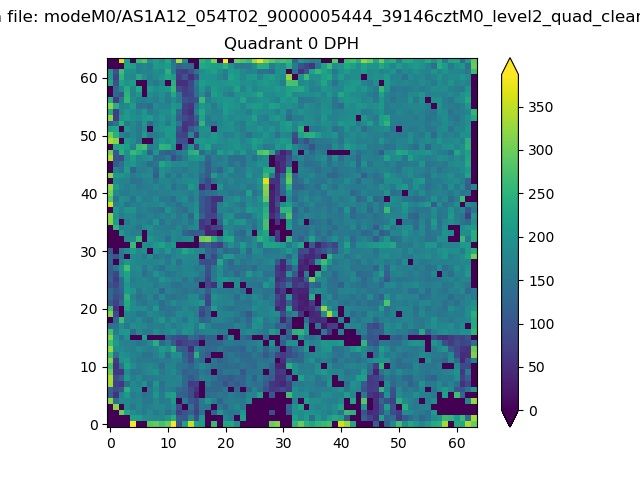 |
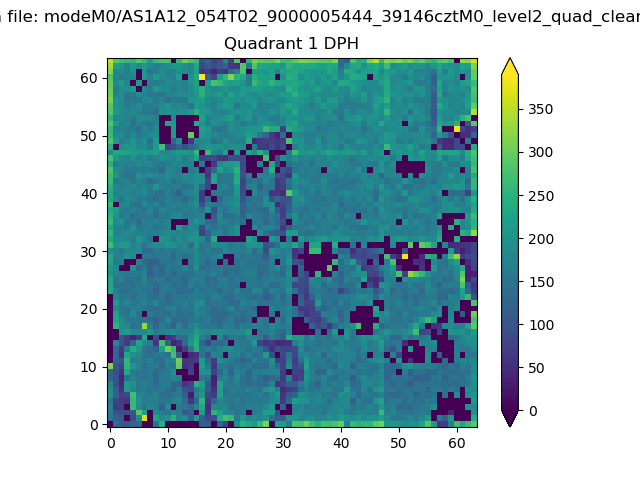 |
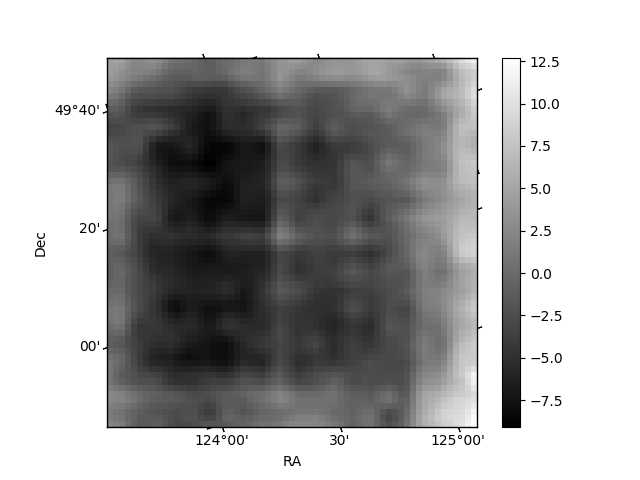
Quadrant B |
|---|---|---|---|
| Quadrant D | 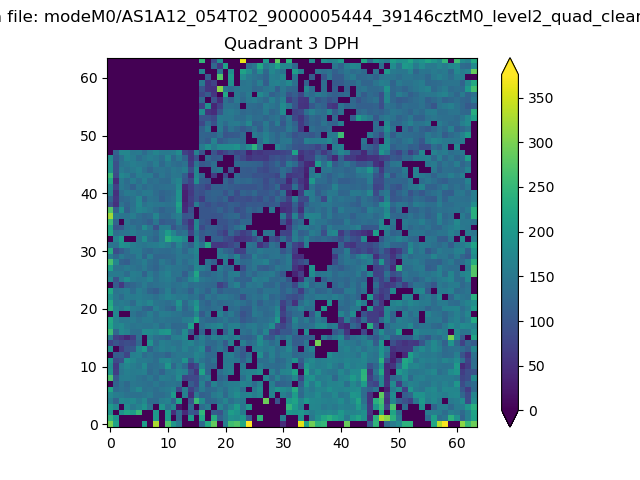 |
 |
Quadrant C |
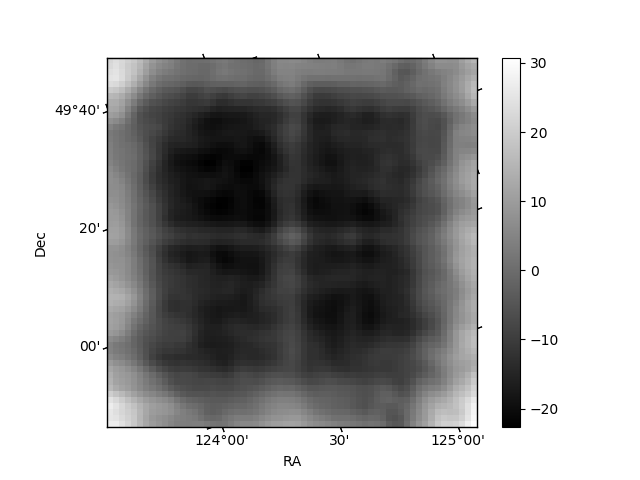
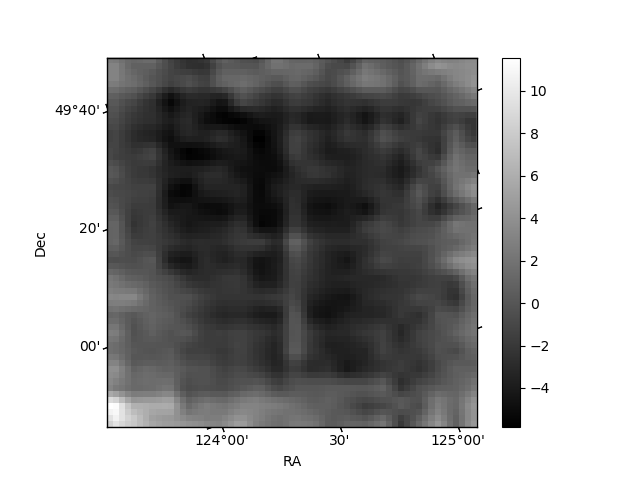
| Plot type | Count rate plots | Images |
|---|---|---|
| Comparison with Poisson distribution Blue bars denote a histogram of data divided into 1 sec bins. Red curve is a Poisson curve with rate = median count rate of data. |
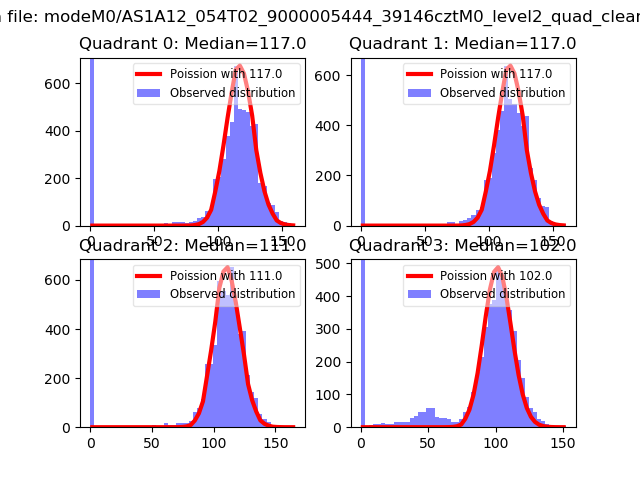 |
 |
| Quadrant-wise count rates Data is divided into 100 sec bins |
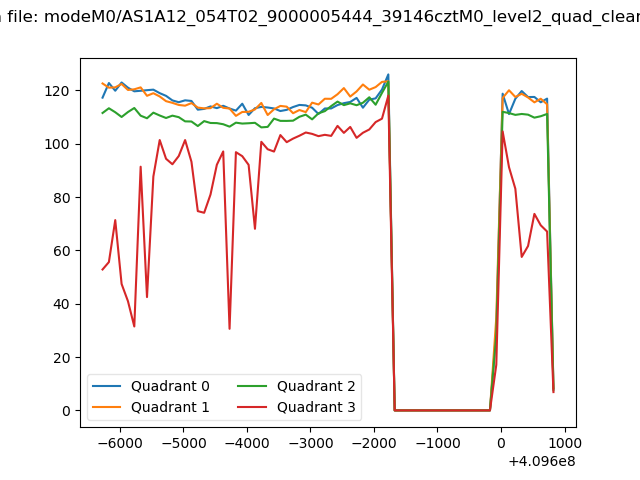 |
|
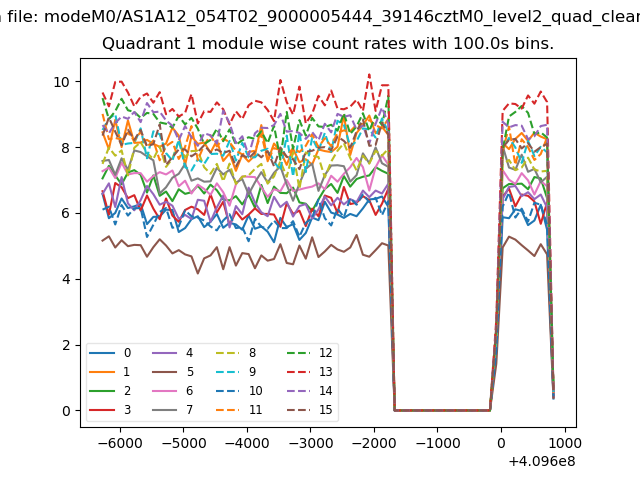
| Module-wise count rates for Quadrant A Data is divided into 100 sec bins |
 |
 |
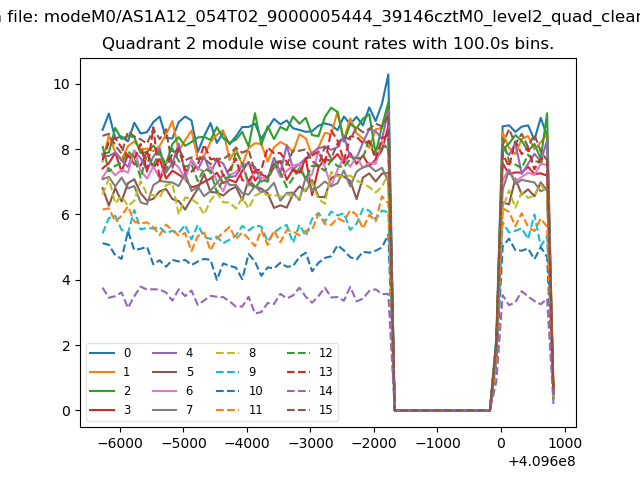
| Module-wise count rates for Quadrant B Data is divided into 100 sec bins |
 |
 |
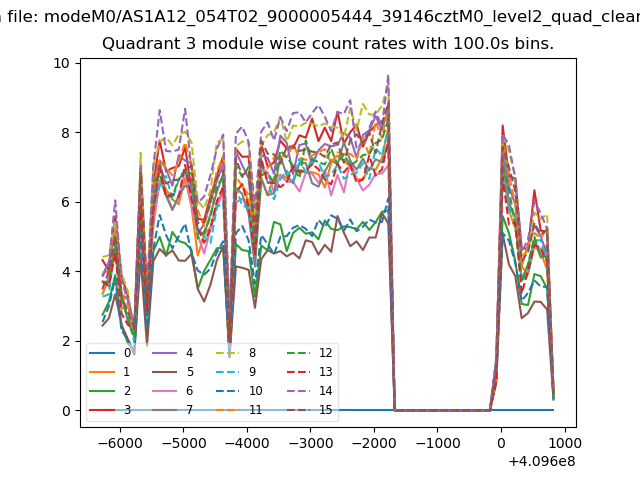
| Module-wise count rates for Quadrant C Data is divided into 100 sec bins |
 |
 |
| Module-wise count rates for Quadrant D Data is divided into 100 sec bins |
 |
 |
| Parameter | Plot |
|---|---|
| CZT HV Monitor | 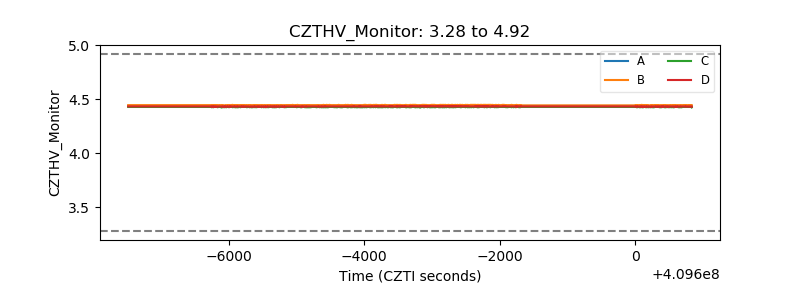 |
| D_VDD | 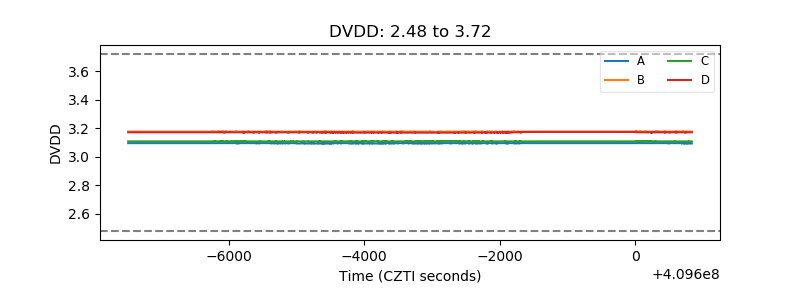 |
| Temperature 1 | 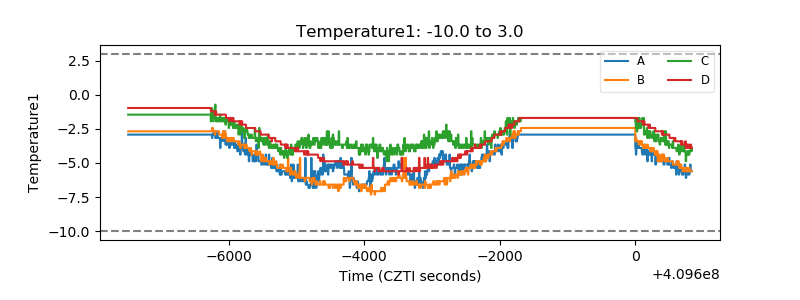 |
| Veto HV Monitor | 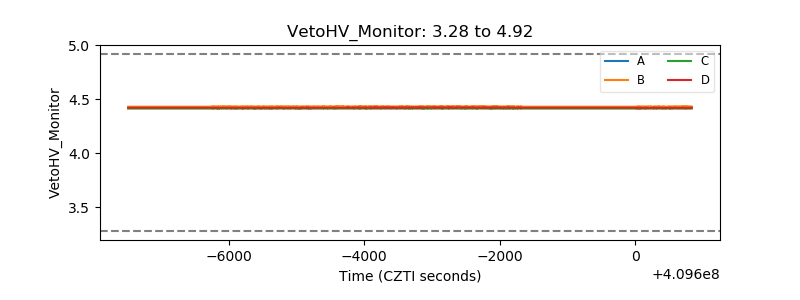 |
| Veto LLD | 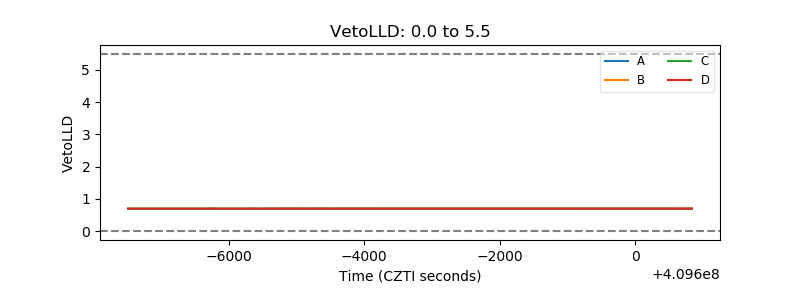 |
| Alpha Counter | 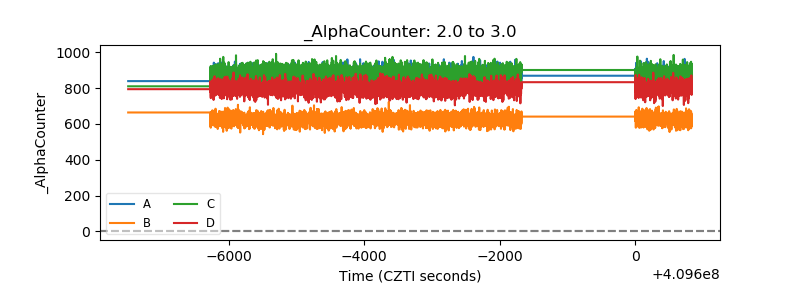 |
| _CPM_Rate | 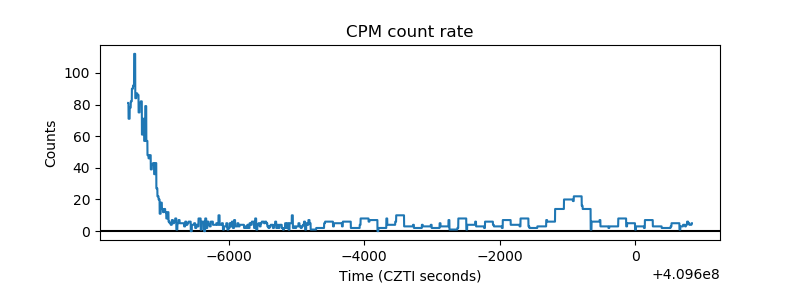 |
| CZT Counter | 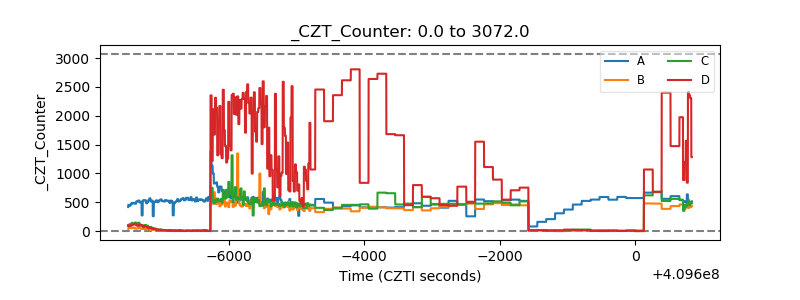 |
| +2.5 Volts monitor | 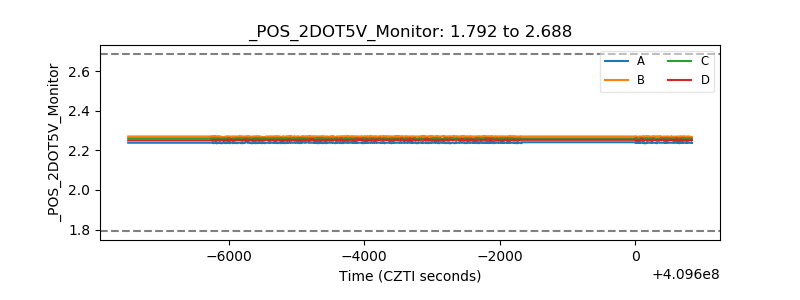 |
| +5 Volts monitor | 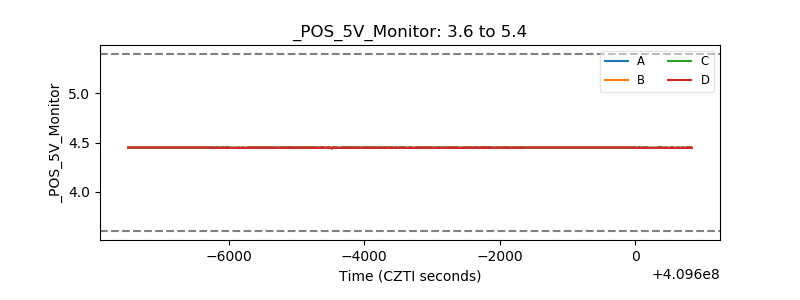 |
| _ROLL_ROT | 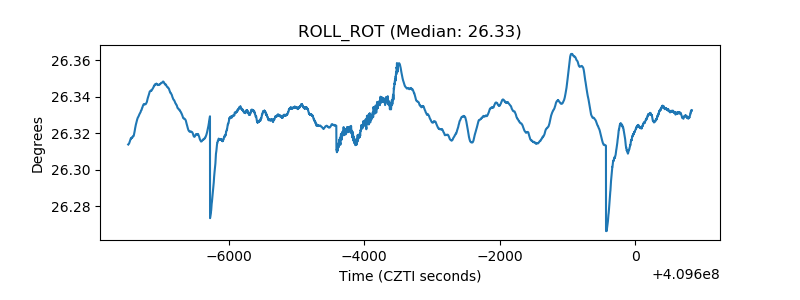 |
| _Roll_DEC | 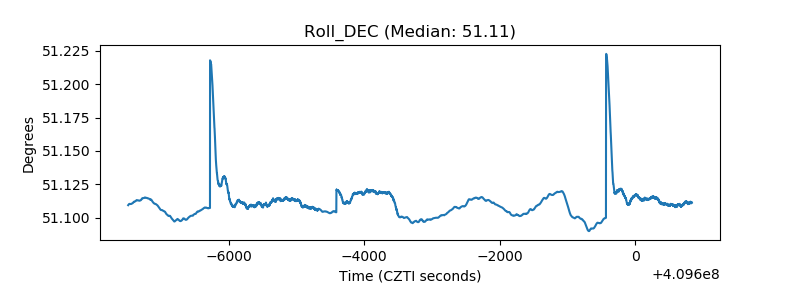 |
| _Roll_RA | 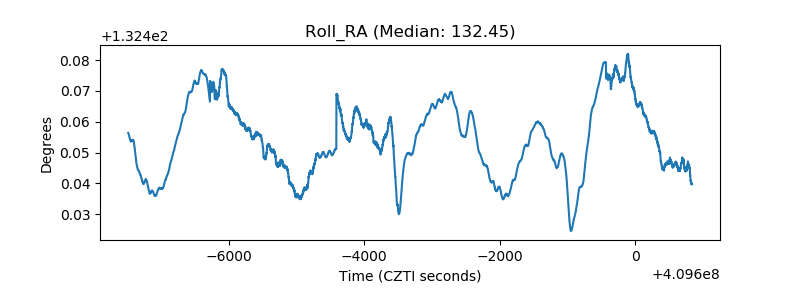 |
| Veto Counter | 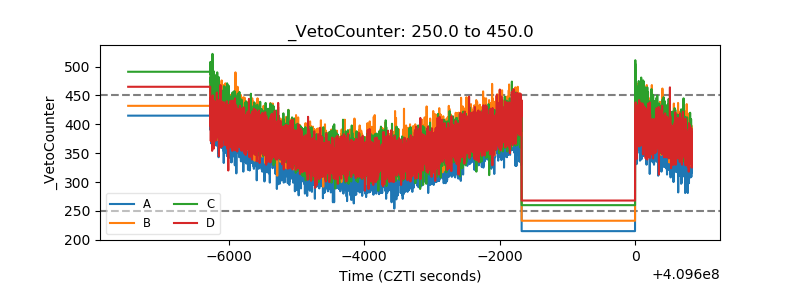 |