| Param | Original file | Final file |
|---|---|---|
| Filename | modeM0/AS1A12_054T02_9000005444_39147cztM0_level2.fits | modeM0/AS1A12_054T02_9000005444_39147cztM0_level2_quad_clean.evt |
| Size (bytes) | 390,778,560 | 96,433,920 |
| Size | 372.7 MB | 92.0 MB |
| Events in quadrant A | 3,070,099 | 660,840 |
| Events in quadrant B | 2,641,720 | 661,953 |
| Events in quadrant C | 2,822,864 | 636,410 |
| Events in quadrant D | 5,482,921 | 558,270 |
| Mode M9 | |||
|---|---|---|---|
| Quadrant | BADHDUFLAG | Total packets | Discarded packets |
| A | 0 | 17 | 0 |
| B | 0 | 17 | 0 |
| C | 0 | 17 | 0 |
| D | 0 | 18 | 0 |
| Mode M0 | |||
|---|---|---|---|
| Quadrant | BADHDUFLAG | Total packets | Discarded packets |
| A | 0 | 12768 | 3 |
| B | 0 | 11956 | 2 |
| C | 0 | 12046 | 2 |
| D | 0 | 20208 | 2 |
| Mode SS | |||
|---|---|---|---|
| Quadrant | BADHDUFLAG | Total packets | Discarded packets |
| A | 0 | 118 | 0 |
| B | 0 | 118 | 0 |
| C | 0 | 118 | 0 |
| D | 0 | 118 | 0 |
| Quadrant | Total seconds | Saturated seconds | Saturation percentage |
|---|---|---|---|
| A | 5754 | 33 | 0.573514% |
| B | 5754 | 25 | 0.434480% |
| C | 5754 | 13 | 0.225930% |
| D | 5754 | 522 | 9.071950% |
Noise dominated data is calculated using 1-second bins in cleaned event files. If a bin has >2000 counts, and if more than 50% of those come from <1% of pixels, then it is considered to be noise-dominated and hence unusable.
| Quadrant | # 1 sec bins | Bins with >0 counts | Bins with >2000 counts | High rate bins dominated by noise | Noise dominated (total time) | Noise dominated (detector-on time) | Marked lightcurve |
|---|---|---|---|---|---|---|---|
| A | 7126 | 5755 | 21 | 21 | 0.29% | 0.36% | 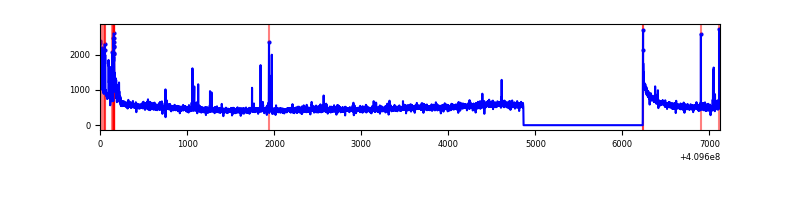 |
| B | 7126 | 5755 | 10 | 10 | 0.14% | 0.17% | 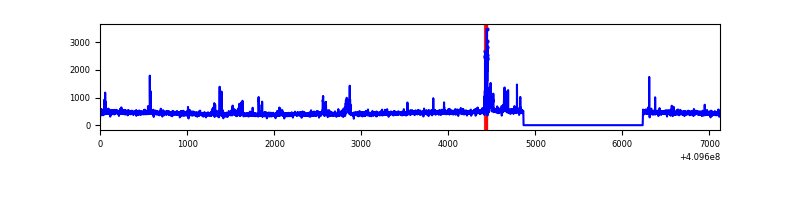 |
| C | 7126 | 5755 | 6 | 6 | 0.08% | 0.10% | 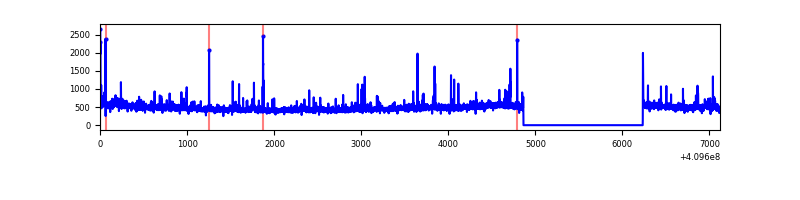 |
| D | 7126 | 5755 | 477 | 477 | 6.69% | 8.29% | 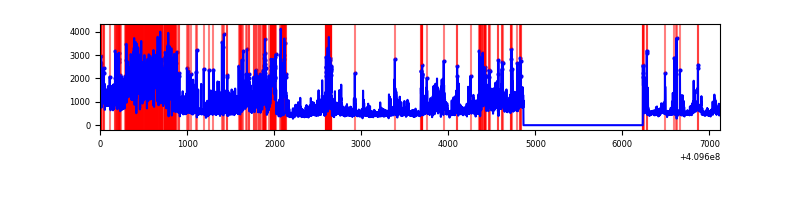 |
Top three noisy pixels from each quadrant. If the there are fewer than three noisy pixels in the level2.evt file, extra rows are filled as -1
| Pixel properties | Quadrant properties | ||||||
|---|---|---|---|---|---|---|---|
| Quadrant | DetID | PixID | Counts | Sigma | Mean | Median | Sigma |
| A | 10 | 83 | 446850 | 3432.03 | 634 | 620 | 130.0 |
| A | 0 | 230 | 74806 | 570.57 | 634 | 620 | 130.0 |
| A | 9 | 143 | 34401 | 259.81 | 634 | 620 | 130.0 |
| B | 5 | 172 | 126900 | 1026.88 | 629 | 610 | 123.0 |
| B | 4 | 80 | 16389 | 128.3 | 629 | 610 | 123.0 |
| B | 12 | 111 | 15400 | 120.26 | 629 | 610 | 123.0 |
| C | 15 | 214 | 238698 | 1662.01 | 619 | 622 | 143.2 |
| C | 9 | 187 | 119899 | 832.67 | 619 | 622 | 143.2 |
| C | 2 | 16 | 27312 | 186.32 | 619 | 622 | 143.2 |
| D | 12 | 235 | 2039127 | 13753.87 | 604 | 586 | 148.2 |
| D | 13 | 171 | 425070 | 2863.96 | 604 | 586 | 148.2 |
| D | 7 | 223 | 169753 | 1141.36 | 604 | 586 | 148.2 |
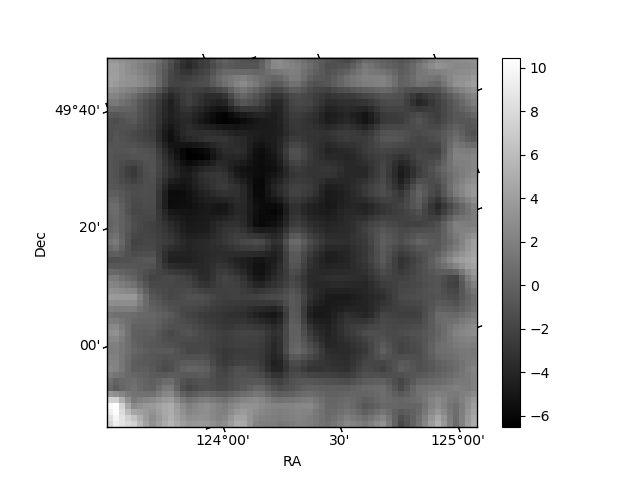
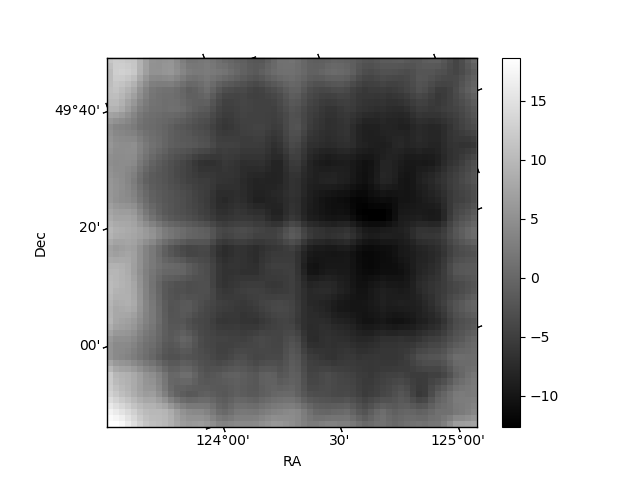
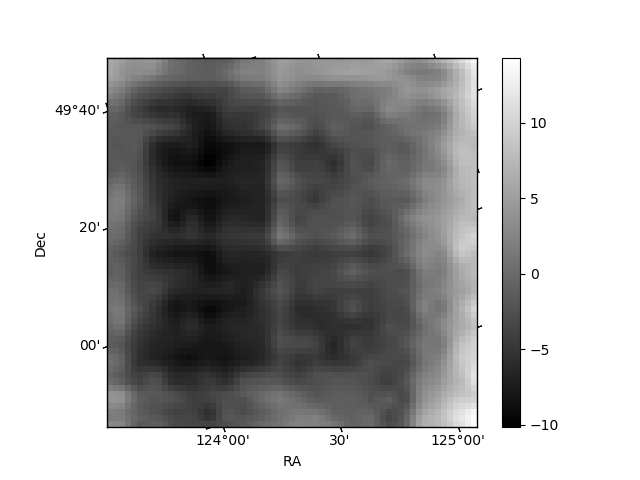
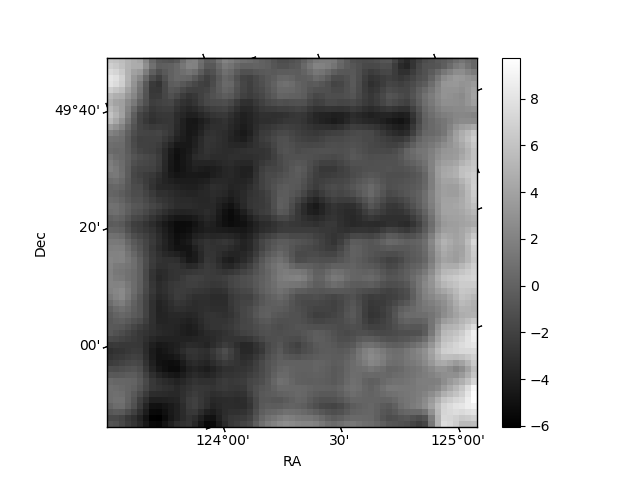
Histogram calculated using DETX and DETY for each event in the final _common_clean file
| Quadrant A | 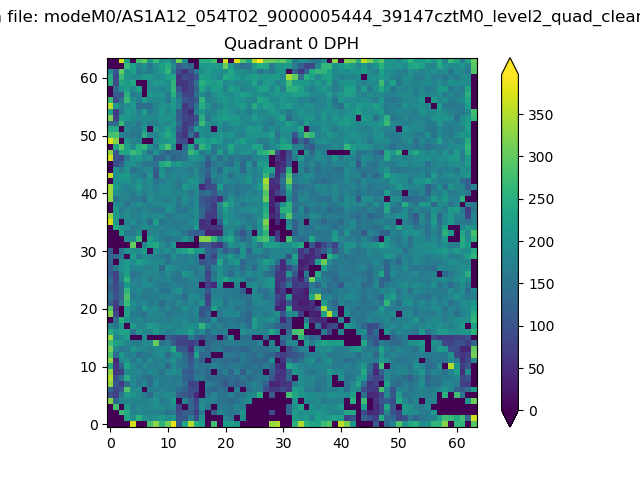 |
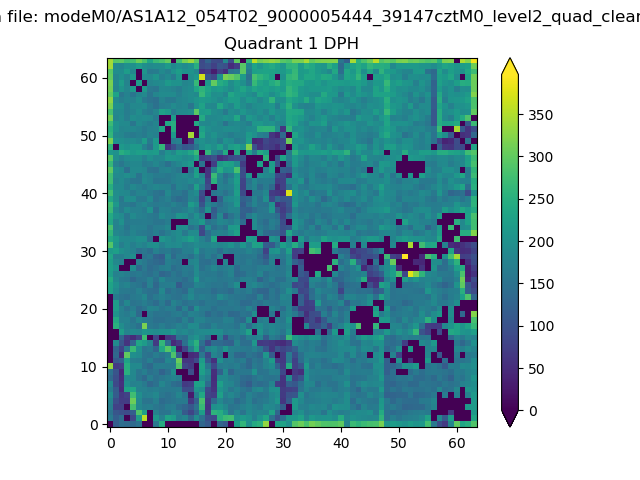 |
Quadrant B |
|---|---|---|---|
| Quadrant D | 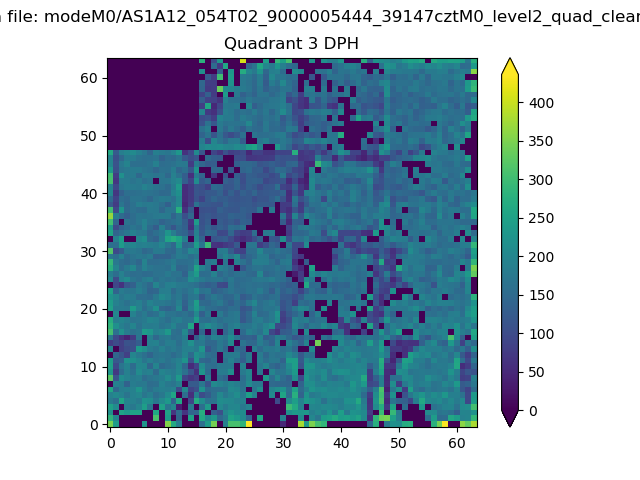 |
 |
Quadrant C |
| Plot type | Count rate plots | Images |
|---|---|---|
| Comparison with Poisson distribution Blue bars denote a histogram of data divided into 1 sec bins. Red curve is a Poisson curve with rate = median count rate of data. |
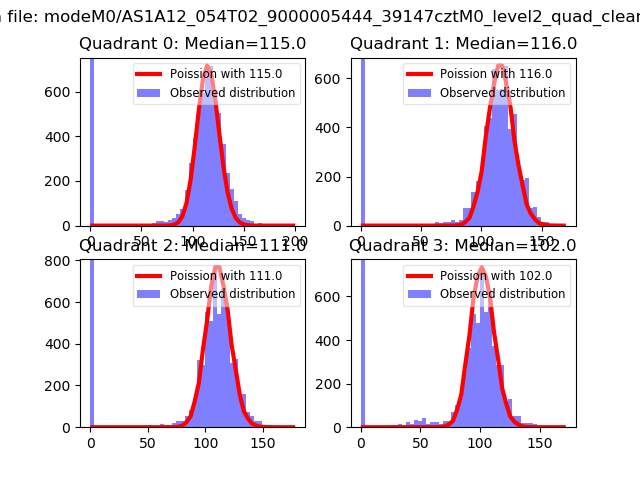 |
 |
| Quadrant-wise count rates Data is divided into 100 sec bins |
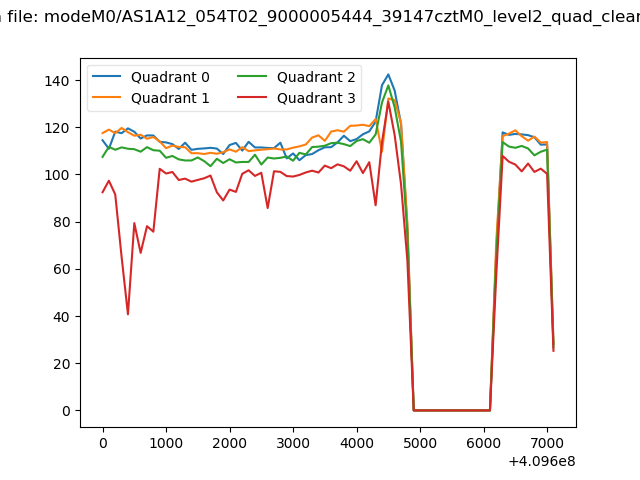 |
|
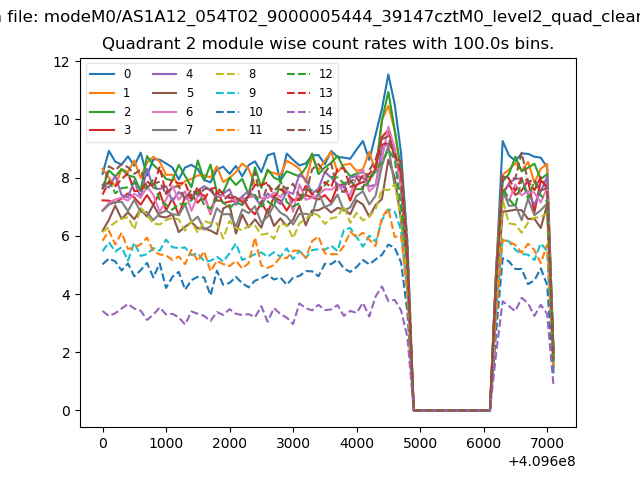
| Module-wise count rates for Quadrant A Data is divided into 100 sec bins |
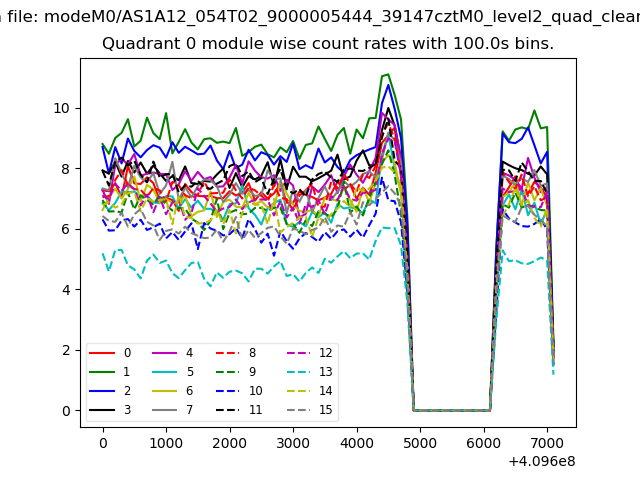 |
 |
| Module-wise count rates for Quadrant B Data is divided into 100 sec bins |
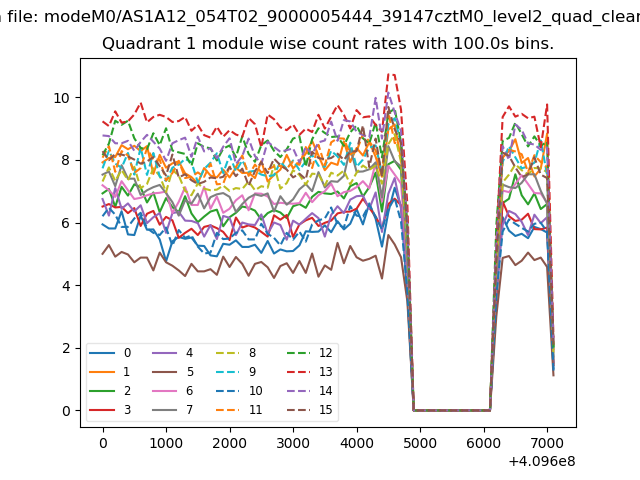 |
 |
| Module-wise count rates for Quadrant C Data is divided into 100 sec bins |
 |
 |
| Module-wise count rates for Quadrant D Data is divided into 100 sec bins |
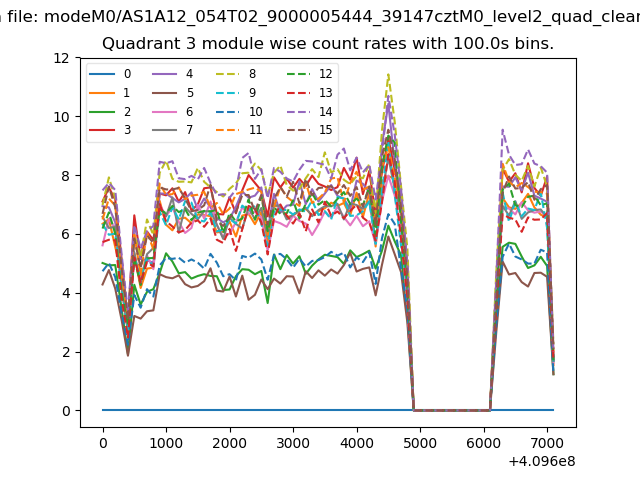 |
 |
| Parameter | Plot |
|---|---|
| CZT HV Monitor | 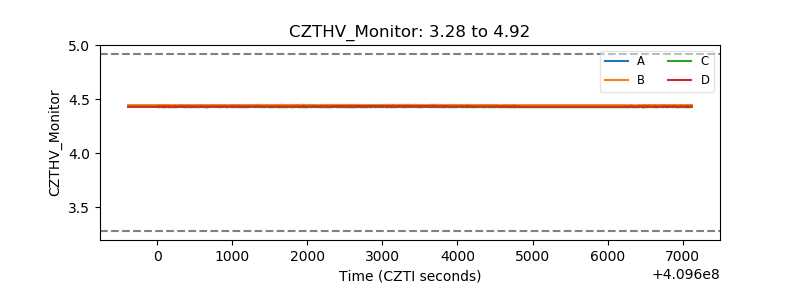 |
| D_VDD | 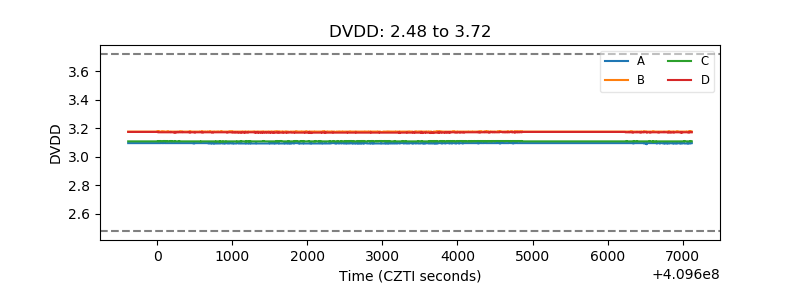 |
| Temperature 1 | 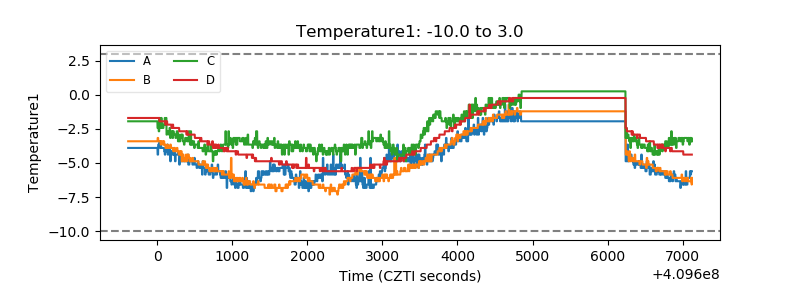 |
| Veto HV Monitor | 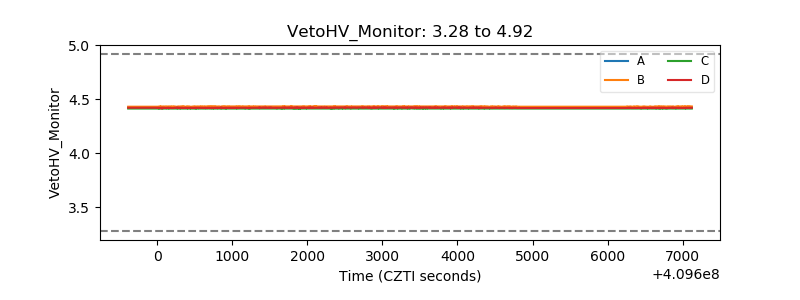 |
| Veto LLD | 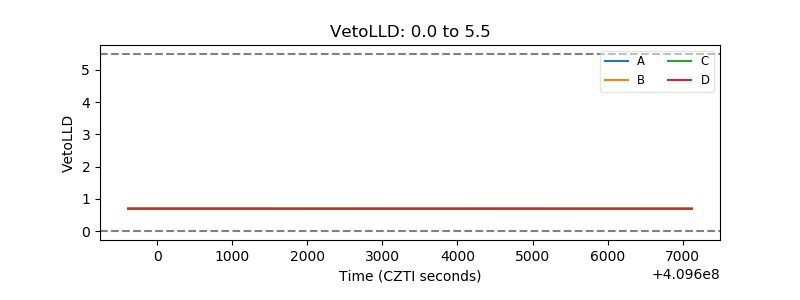 |
| Alpha Counter | 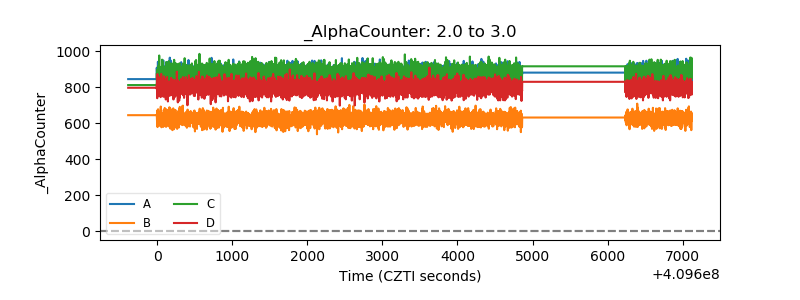 |
| _CPM_Rate | 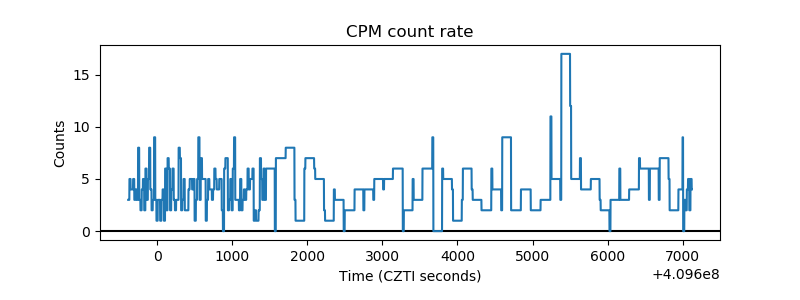 |
| CZT Counter | 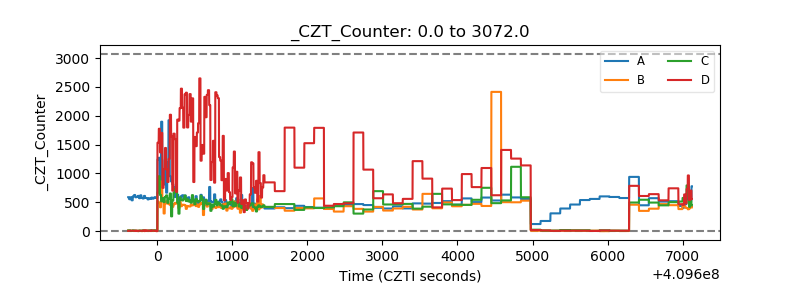 |
| +2.5 Volts monitor | 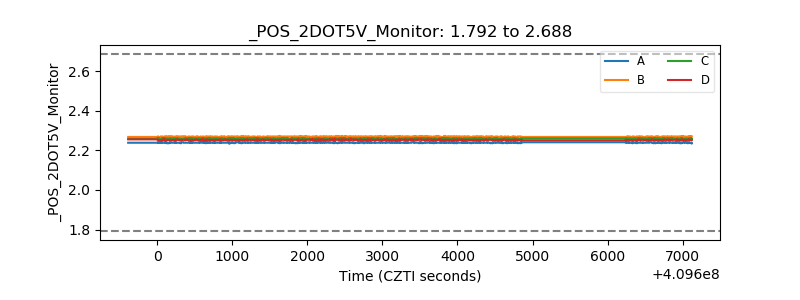 |
| +5 Volts monitor | 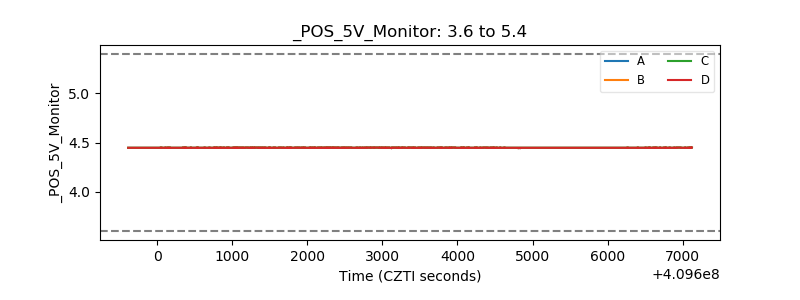 |
| _ROLL_ROT | 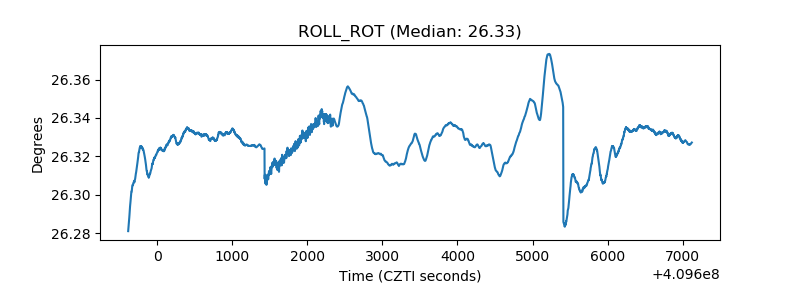 |
| _Roll_DEC |  |
| _Roll_RA | 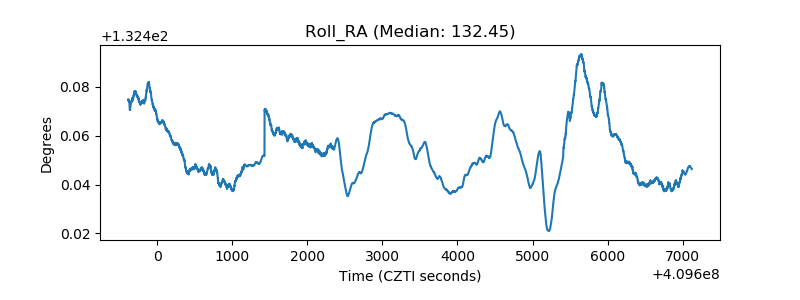 |
| Veto Counter | 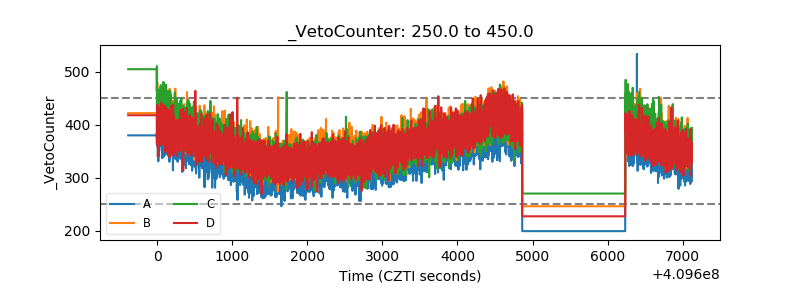 |