| Param | Original file | Final file |
|---|---|---|
| Filename | modeM0/AS1A12_054T02_9000005444_39148cztM0_level2.fits | modeM0/AS1A12_054T02_9000005444_39148cztM0_level2_quad_clean.evt |
| Size (bytes) | 417,072,960 | 112,515,840 |
| Size | 397.8 MB | 107.3 MB |
| Events in quadrant A | 3,526,868 | 762,293 |
| Events in quadrant B | 3,093,916 | 767,994 |
| Events in quadrant C | 3,335,182 | 736,214 |
| Events in quadrant D | 4,963,354 | 674,647 |
| Mode M9 | |||
|---|---|---|---|
| Quadrant | BADHDUFLAG | Total packets | Discarded packets |
| A | 0 | 26 | 0 |
| B | 0 | 26 | 0 |
| C | 0 | 26 | 0 |
| D | 0 | 26 | 0 |
| Mode M0 | |||
|---|---|---|---|
| Quadrant | BADHDUFLAG | Total packets | Discarded packets |
| A | 0 | 14752 | 3 |
| B | 0 | 13900 | 2 |
| C | 0 | 14144 | 2 |
| D | 0 | 19491 | 2 |
| Mode SS | |||
|---|---|---|---|
| Quadrant | BADHDUFLAG | Total packets | Discarded packets |
| A | 0 | 138 | 0 |
| B | 0 | 138 | 0 |
| C | 0 | 138 | 0 |
| D | 0 | 138 | 0 |
| Quadrant | Total seconds | Saturated seconds | Saturation percentage |
|---|---|---|---|
| A | 6680 | 27 | 0.404192% |
| B | 6680 | 30 | 0.449102% |
| C | 6680 | 21 | 0.314371% |
| D | 6680 | 240 | 3.592814% |
Noise dominated data is calculated using 1-second bins in cleaned event files. If a bin has >2000 counts, and if more than 50% of those come from <1% of pixels, then it is considered to be noise-dominated and hence unusable.
| Quadrant | # 1 sec bins | Bins with >0 counts | Bins with >2000 counts | High rate bins dominated by noise | Noise dominated (total time) | Noise dominated (detector-on time) | Marked lightcurve |
|---|---|---|---|---|---|---|---|
| A | 9333 | 6682 | 17 | 17 | 0.18% | 0.25% | 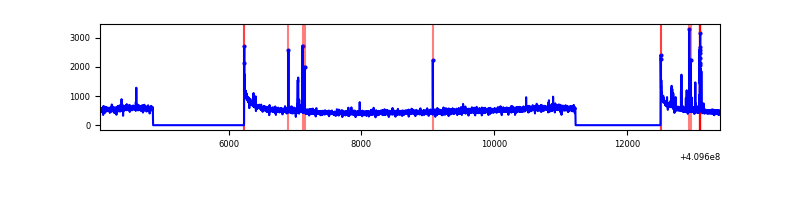 |
| B | 9333 | 6682 | 10 | 10 | 0.11% | 0.15% | 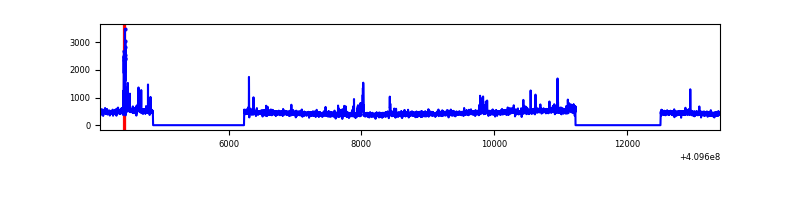 |
| C | 9333 | 6682 | 13 | 13 | 0.14% | 0.19% | 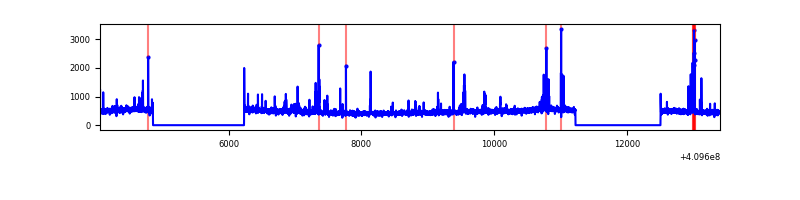 |
| D | 9333 | 6682 | 171 | 171 | 1.83% | 2.56% | 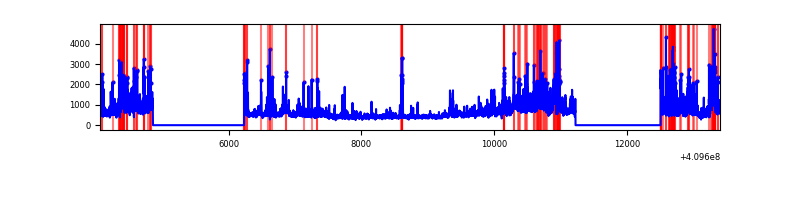 |
Top three noisy pixels from each quadrant. If the there are fewer than three noisy pixels in the level2.evt file, extra rows are filled as -1
| Pixel properties | Quadrant properties | ||||||
|---|---|---|---|---|---|---|---|
| Quadrant | DetID | PixID | Counts | Sigma | Mean | Median | Sigma |
| A | 10 | 83 | 486465 | 3198.42 | 748 | 734 | 151.9 |
| A | 13 | 248 | 79758 | 520.35 | 748 | 734 | 151.9 |
| A | 9 | 143 | 32356 | 208.22 | 748 | 734 | 151.9 |
| B | 5 | 172 | 122449 | 853.84 | 741 | 722 | 142.6 |
| B | 12 | 111 | 18354 | 123.67 | 741 | 722 | 142.6 |
| B | 0 | 190 | 17249 | 115.92 | 741 | 722 | 142.6 |
| C | 15 | 214 | 274218 | 1626.35 | 723 | 726 | 168.2 |
| C | 9 | 187 | 115962 | 685.26 | 723 | 726 | 168.2 |
| C | 14 | 254 | 63113 | 370.99 | 723 | 726 | 168.2 |
| D | 12 | 235 | 1161205 | 6537.81 | 720 | 699 | 177.5 |
| D | 5 | 222 | 356699 | 2005.56 | 720 | 699 | 177.5 |
| D | 13 | 171 | 296351 | 1665.58 | 720 | 699 | 177.5 |
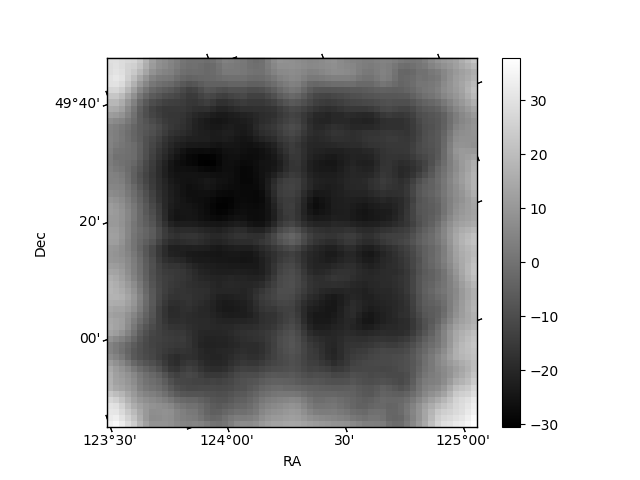
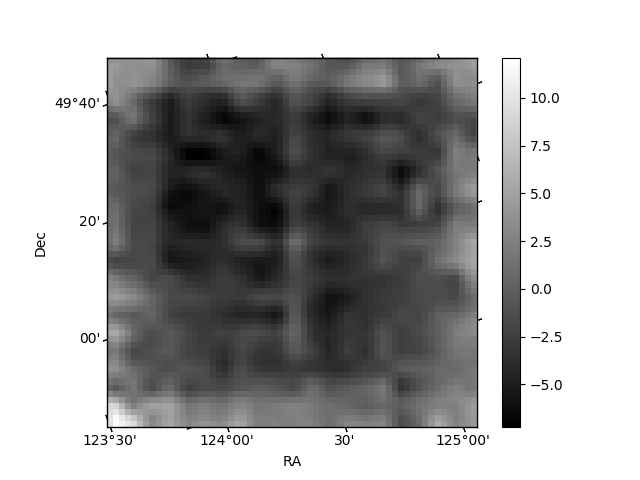
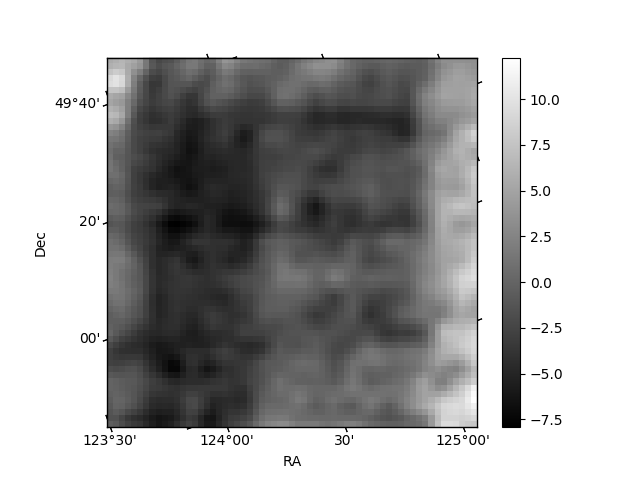
Histogram calculated using DETX and DETY for each event in the final _common_clean file
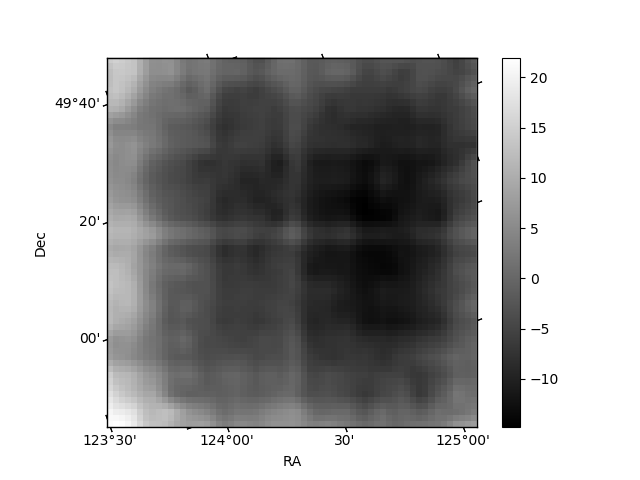
| Quadrant A | 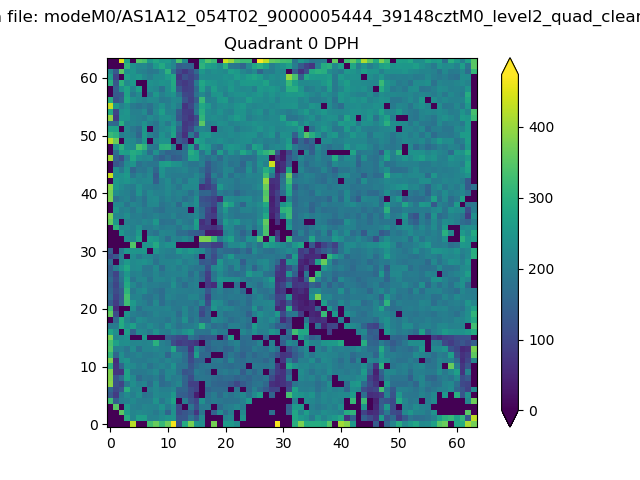 |
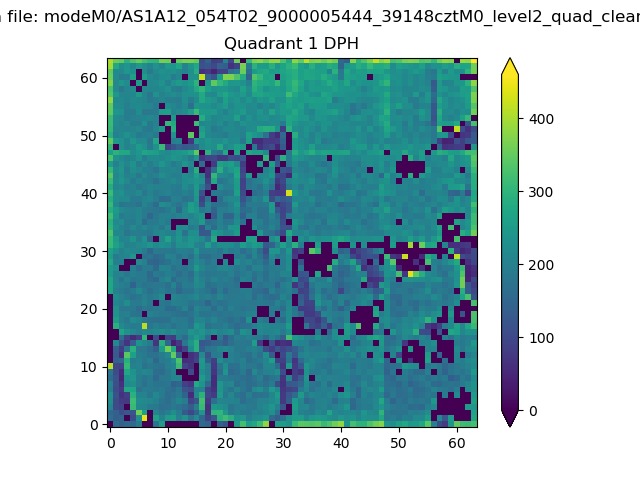 |
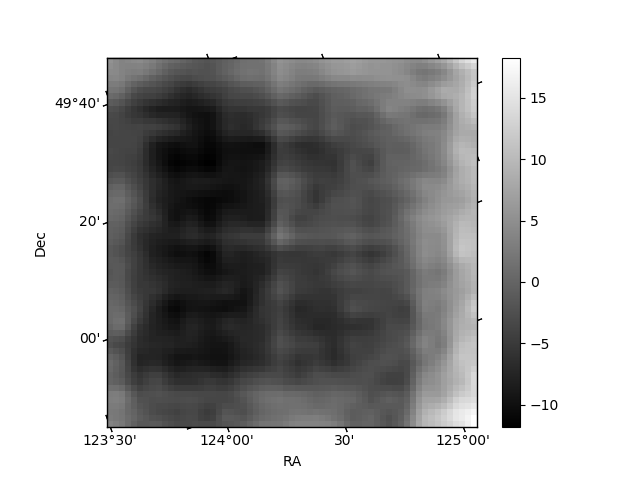
Quadrant B |
|---|---|---|---|
| Quadrant D | 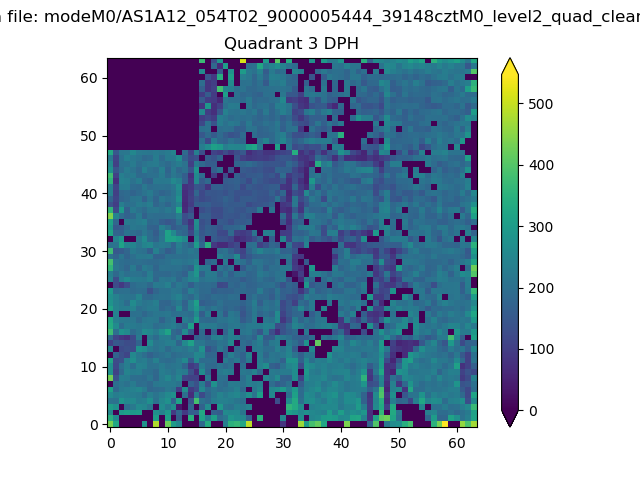 |
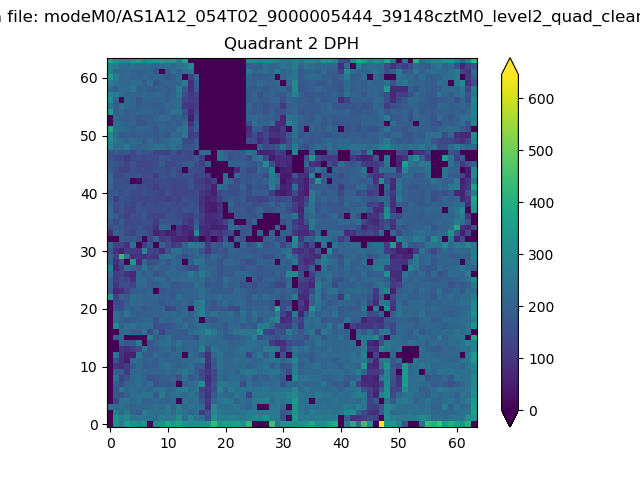 |
Quadrant C |
| Plot type | Count rate plots | Images |
|---|---|---|
| Comparison with Poisson distribution Blue bars denote a histogram of data divided into 1 sec bins. Red curve is a Poisson curve with rate = median count rate of data. |
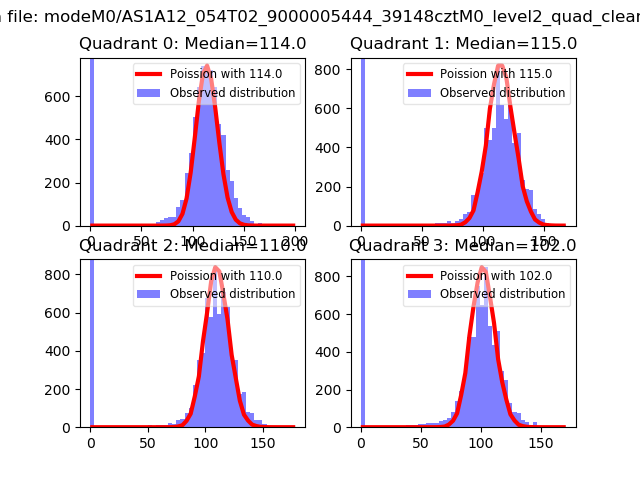 |
 |
| Quadrant-wise count rates Data is divided into 100 sec bins |
 |
|
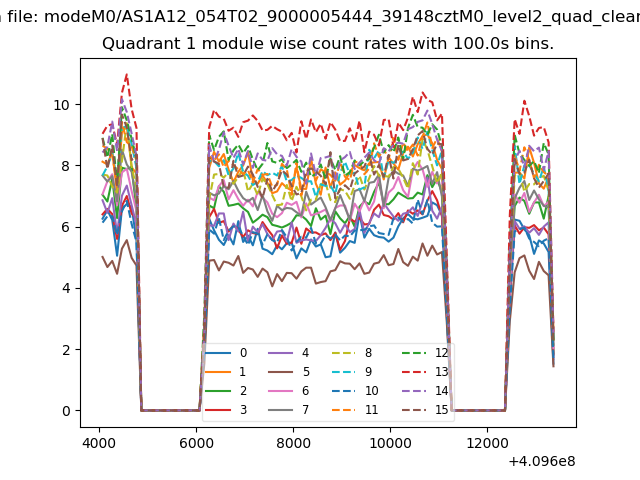
| Module-wise count rates for Quadrant A Data is divided into 100 sec bins |
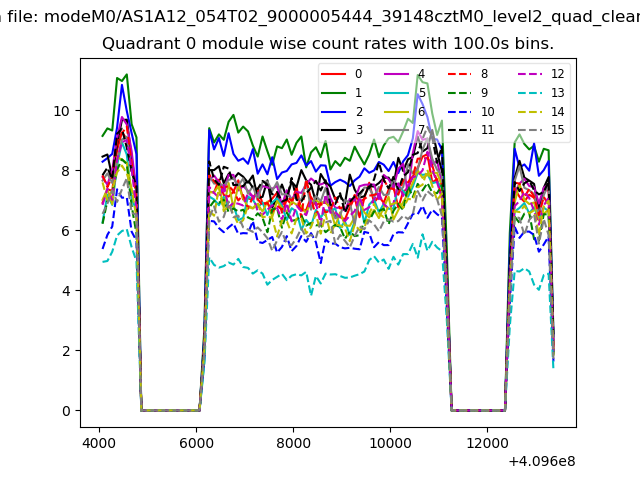 |
 |
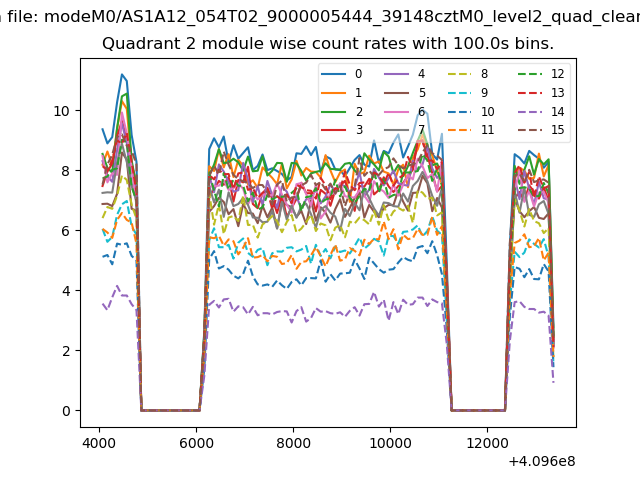
| Module-wise count rates for Quadrant B Data is divided into 100 sec bins |
 |
 |
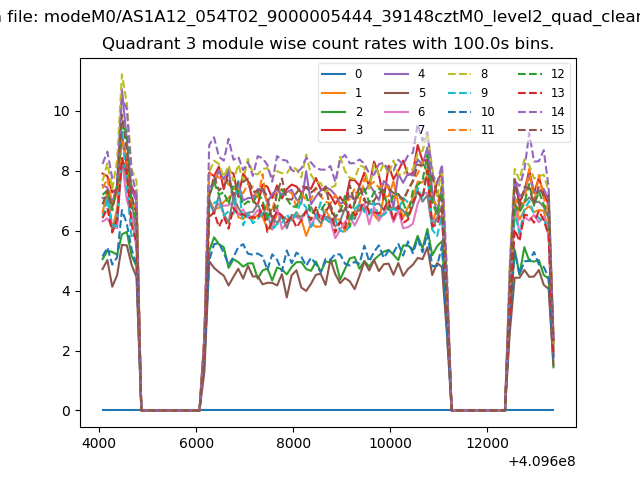
| Module-wise count rates for Quadrant C Data is divided into 100 sec bins |
 |
 |
| Module-wise count rates for Quadrant D Data is divided into 100 sec bins |
 |
 |
| Parameter | Plot |
|---|---|
| CZT HV Monitor | 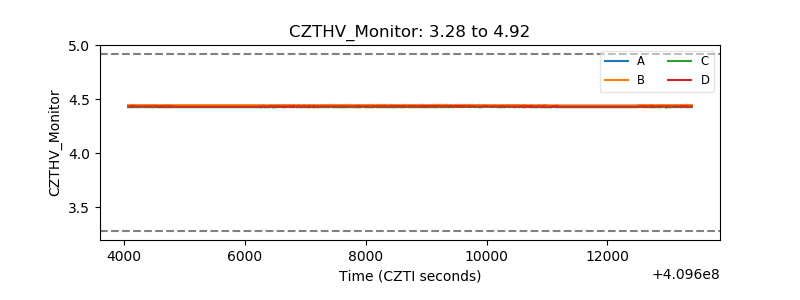 |
| D_VDD | 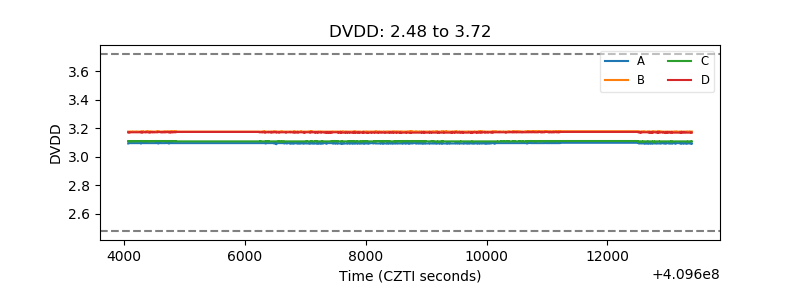 |
| Temperature 1 | 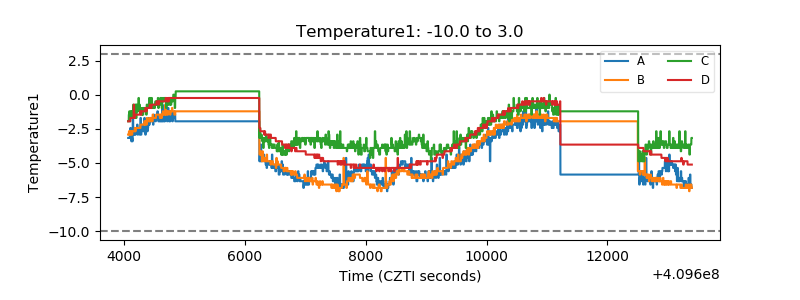 |
| Veto HV Monitor | 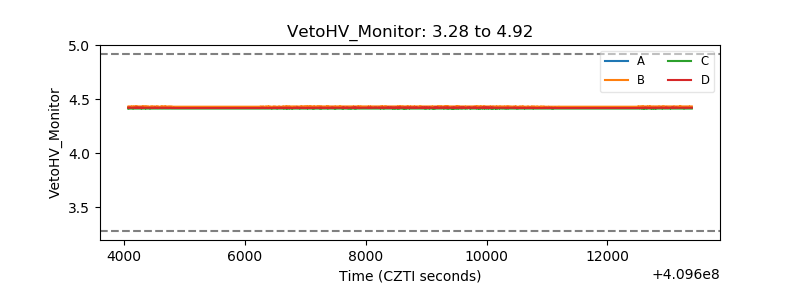 |
| Veto LLD | 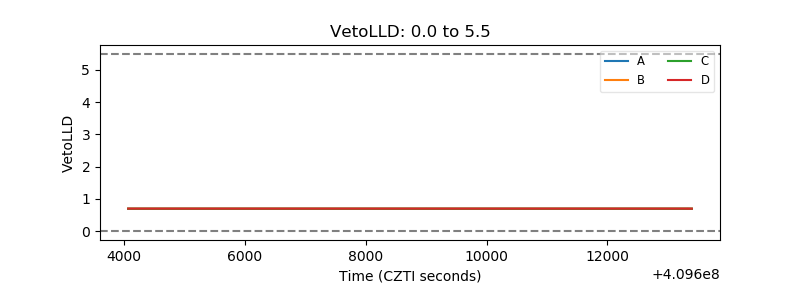 |
| Alpha Counter | 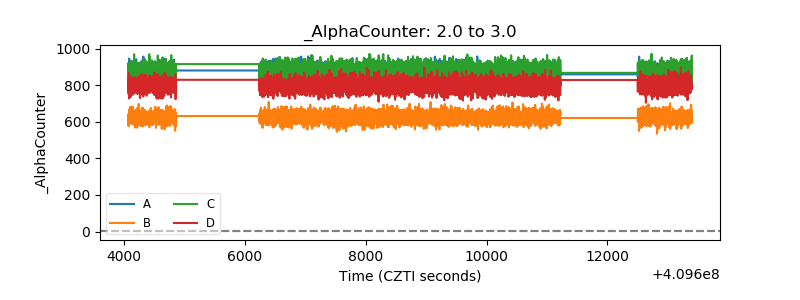 |
| _CPM_Rate | 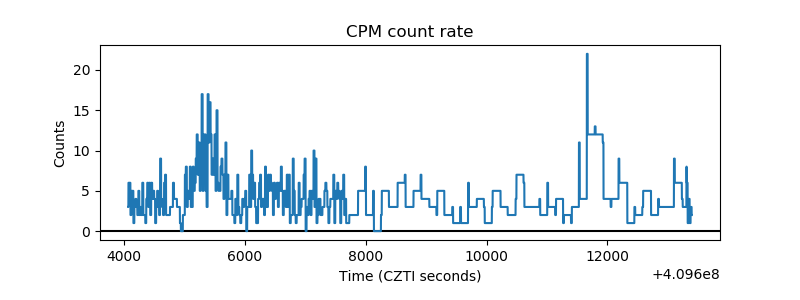 |
| CZT Counter | 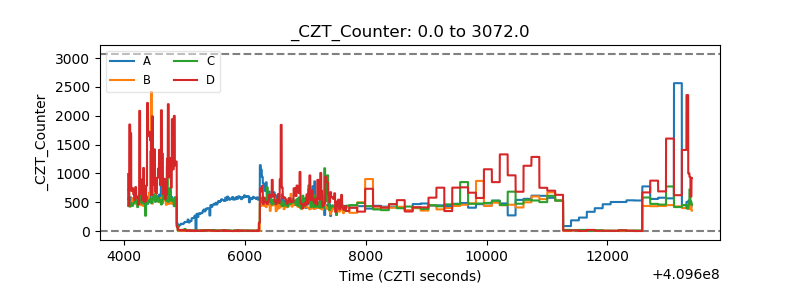 |
| +2.5 Volts monitor | 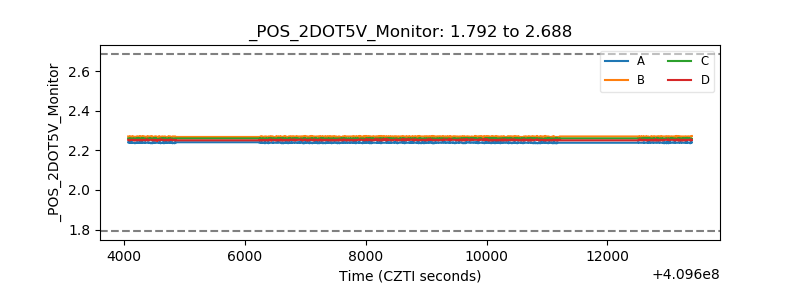 |
| +5 Volts monitor | 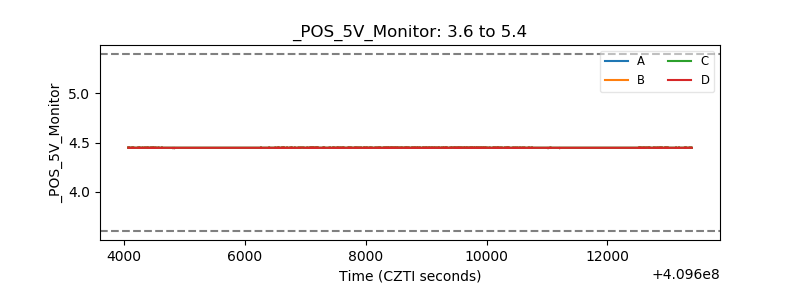 |
| _ROLL_ROT | 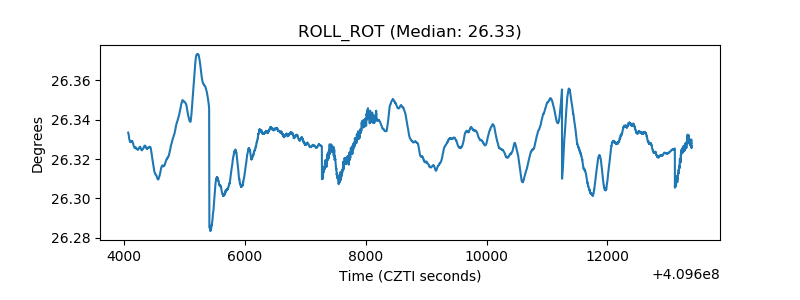 |
| _Roll_DEC | 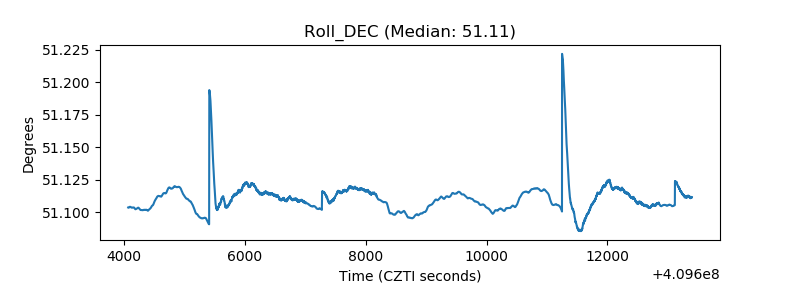 |
| _Roll_RA | 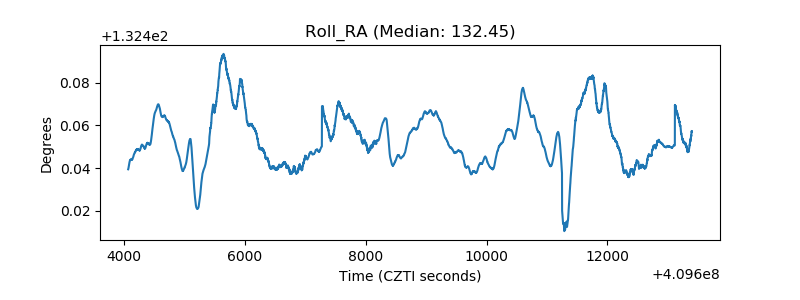 |
| Veto Counter | 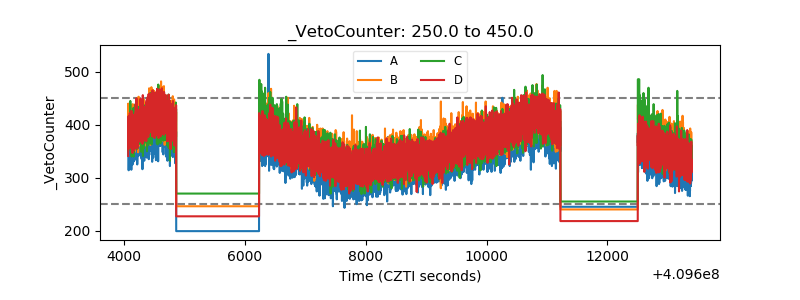 |