| Param | Original file | Final file |
|---|---|---|
| Filename | modeM0/AS1A12_054T02_9000005444_39151cztM0_level2.fits | modeM0/AS1A12_054T02_9000005444_39151cztM0_level2_quad_clean.evt |
| Size (bytes) | 1,032,203,520 | 262,128,960 |
| Size | 984.4 MB | 250.0 MB |
| Events in quadrant A | 8,190,124 | 1,787,914 |
| Events in quadrant B | 7,300,147 | 1,807,583 |
| Events in quadrant C | 7,720,524 | 1,723,026 |
| Events in quadrant D | 13,761,012 | 1,515,804 |
| Mode M9 | |||
|---|---|---|---|
| Quadrant | BADHDUFLAG | Total packets | Discarded packets |
| A | 0 | 55 | 0 |
| B | 0 | 55 | 0 |
| C | 0 | 55 | 0 |
| D | 0 | 55 | 0 |
| Mode M0 | |||
|---|---|---|---|
| Quadrant | BADHDUFLAG | Total packets | Discarded packets |
| A | 0 | 34661 | 5 |
| B | 0 | 33215 | 4 |
| C | 0 | 33508 | 4 |
| D | 0 | 52066 | 4 |
| Mode SS | |||
|---|---|---|---|
| Quadrant | BADHDUFLAG | Total packets | Discarded packets |
| A | 0 | 328 | 0 |
| B | 0 | 328 | 0 |
| C | 0 | 328 | 0 |
| D | 0 | 328 | 0 |
| Quadrant | Total seconds | Saturated seconds | Saturation percentage |
|---|---|---|---|
| A | 15978 | 38 | 0.237827% |
| B | 15978 | 55 | 0.344223% |
| C | 15978 | 44 | 0.275379% |
| D | 15978 | 1155 | 7.228689% |
Noise dominated data is calculated using 1-second bins in cleaned event files. If a bin has >2000 counts, and if more than 50% of those come from <1% of pixels, then it is considered to be noise-dominated and hence unusable.
| Quadrant | # 1 sec bins | Bins with >0 counts | Bins with >2000 counts | High rate bins dominated by noise | Noise dominated (total time) | Noise dominated (detector-on time) | Marked lightcurve |
|---|---|---|---|---|---|---|---|
| A | 21498 | 15982 | 17 | 17 | 0.08% | 0.11% | 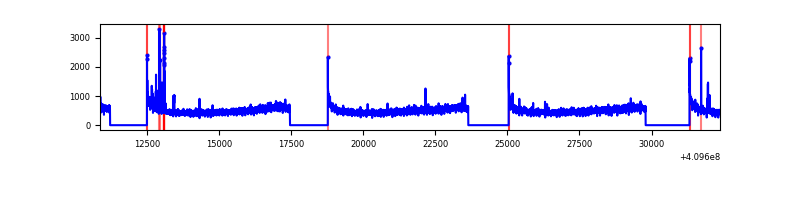 |
| B | 21498 | 15982 | 26 | 26 | 0.12% | 0.16% | 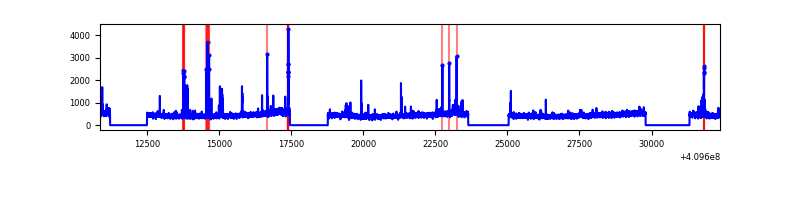 |
| C | 21498 | 15982 | 25 | 25 | 0.12% | 0.16% | 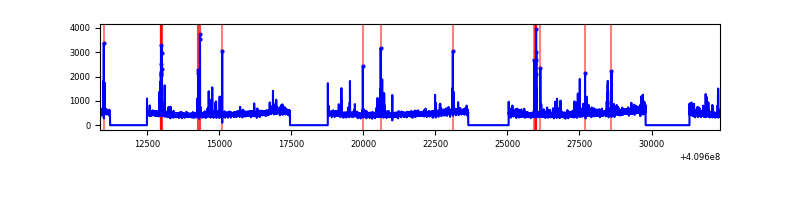 |
| D | 21498 | 15982 | 865 | 865 | 4.02% | 5.41% | 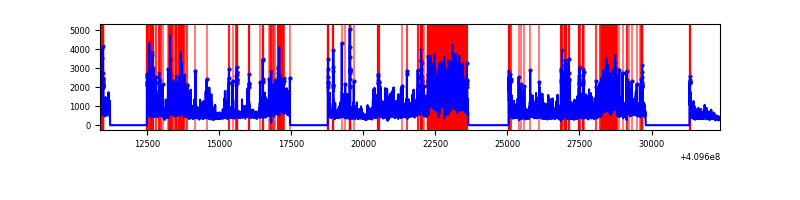 |
Top three noisy pixels from each quadrant. If the there are fewer than three noisy pixels in the level2.evt file, extra rows are filled as -1
| Pixel properties | Quadrant properties | ||||||
|---|---|---|---|---|---|---|---|
| Quadrant | DetID | PixID | Counts | Sigma | Mean | Median | Sigma |
| A | 10 | 83 | 1119873 | 3149.85 | 1770 | 1736 | 355.0 |
| A | 15 | 223 | 75547 | 207.93 | 1770 | 1736 | 355.0 |
| A | 13 | 248 | 66414 | 182.2 | 1770 | 1736 | 355.0 |
| B | 5 | 172 | 192183 | 571.01 | 1750 | 1699 | 333.6 |
| B | 5 | 200 | 71378 | 208.87 | 1750 | 1699 | 333.6 |
| B | 5 | 184 | 53593 | 155.56 | 1750 | 1699 | 333.6 |
| C | 15 | 214 | 658637 | 1665.09 | 1709 | 1719 | 394.5 |
| C | 9 | 187 | 253400 | 637.93 | 1709 | 1719 | 394.5 |
| C | 14 | 254 | 89337 | 222.08 | 1709 | 1719 | 394.5 |
| D | 12 | 235 | 5149222 | 12538.83 | 1680 | 1632 | 410.5 |
| D | 5 | 222 | 980604 | 2384.64 | 1680 | 1632 | 410.5 |
| D | 2 | 249 | 334156 | 809.98 | 1680 | 1632 | 410.5 |
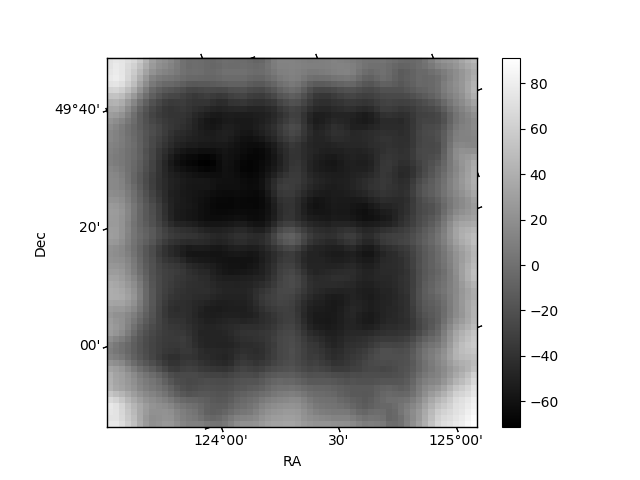
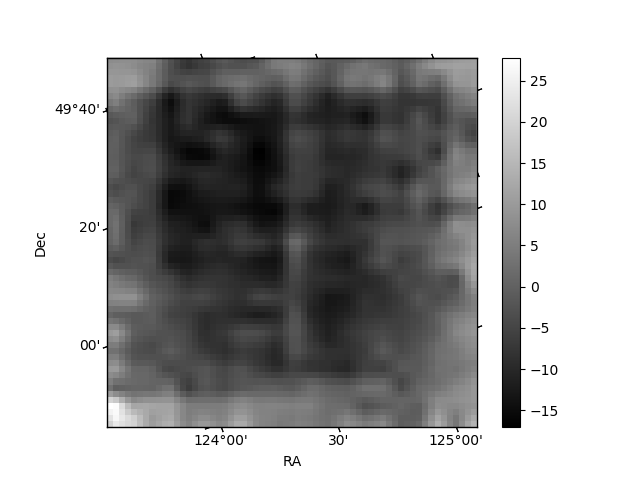
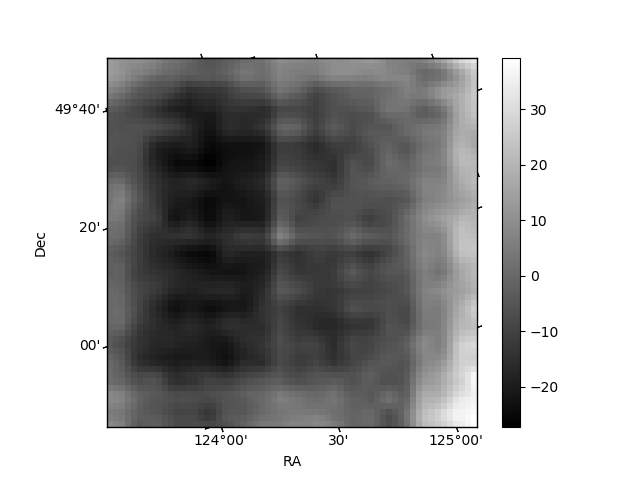
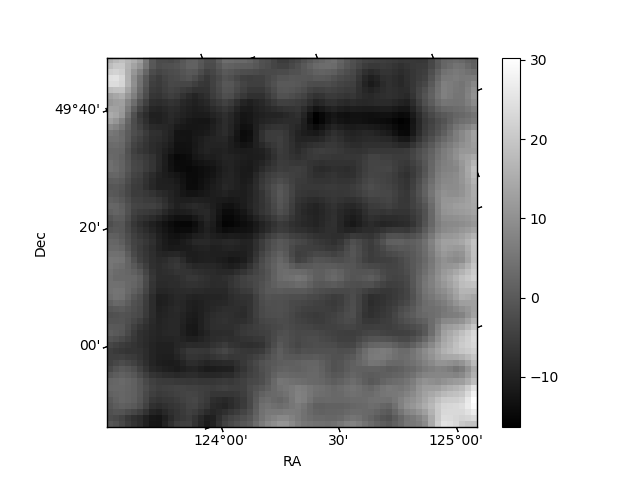
Histogram calculated using DETX and DETY for each event in the final _common_clean file
| Quadrant A | 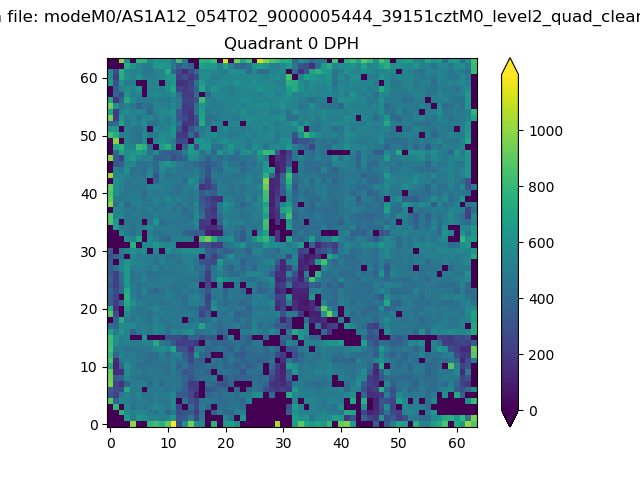 |
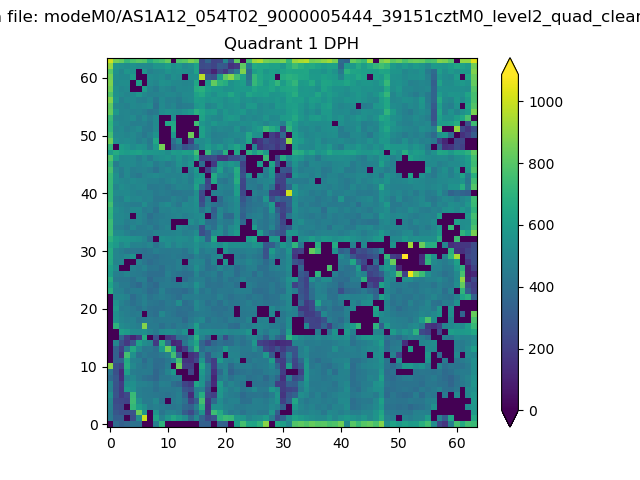 |
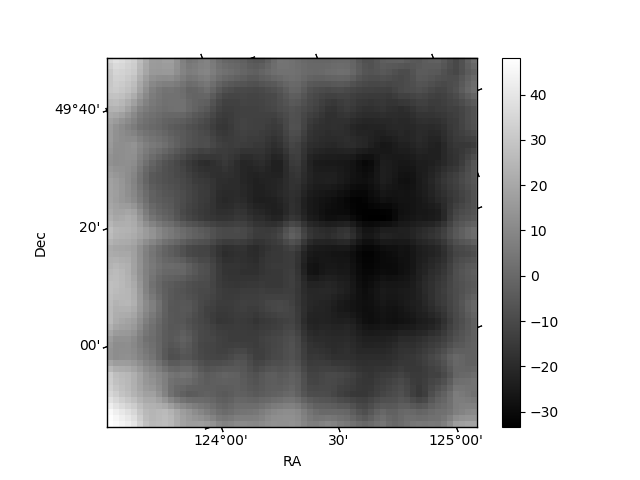
Quadrant B |
|---|---|---|---|
| Quadrant D | 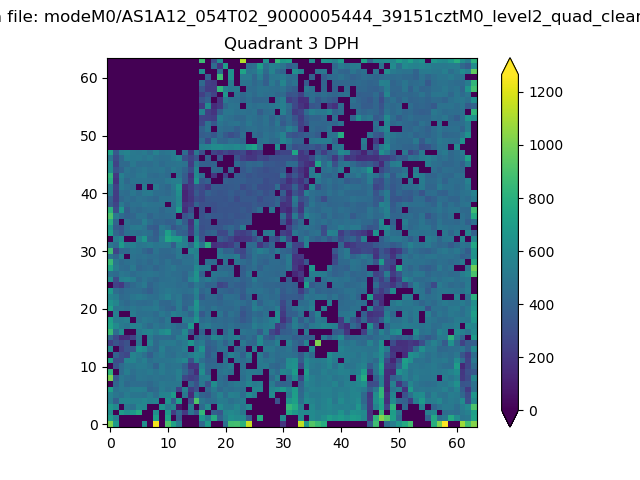 |
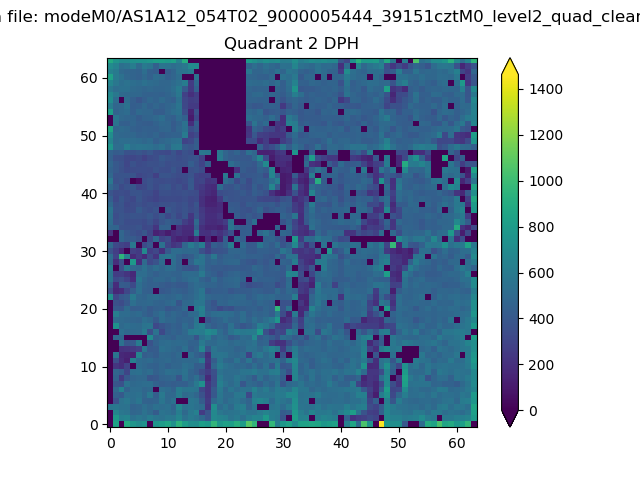 |
Quadrant C |
| Plot type | Count rate plots | Images |
|---|---|---|
| Comparison with Poisson distribution Blue bars denote a histogram of data divided into 1 sec bins. Red curve is a Poisson curve with rate = median count rate of data. |
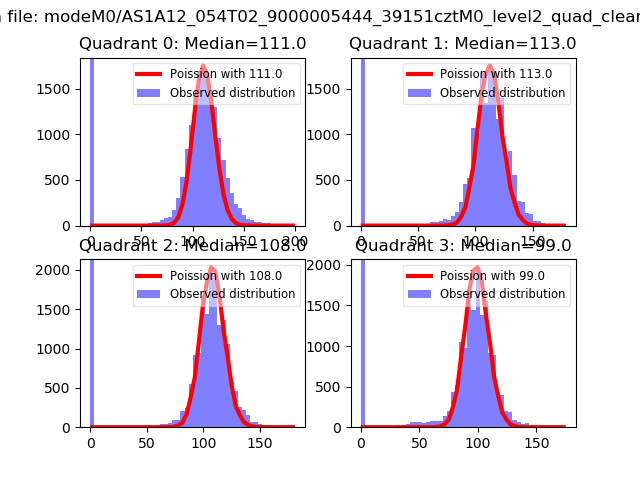 |
 |
| Quadrant-wise count rates Data is divided into 100 sec bins |
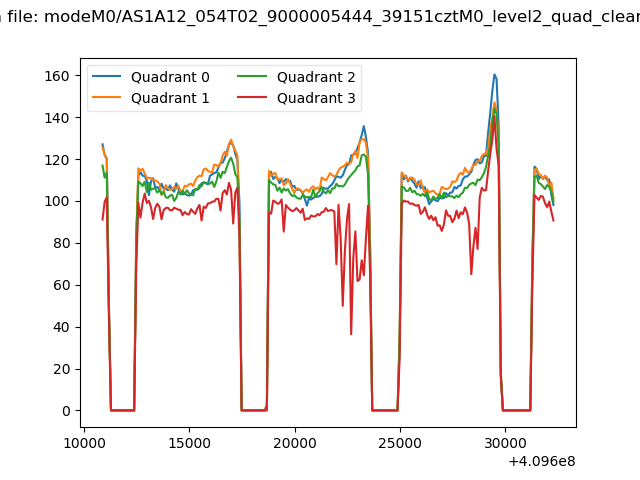 |
|
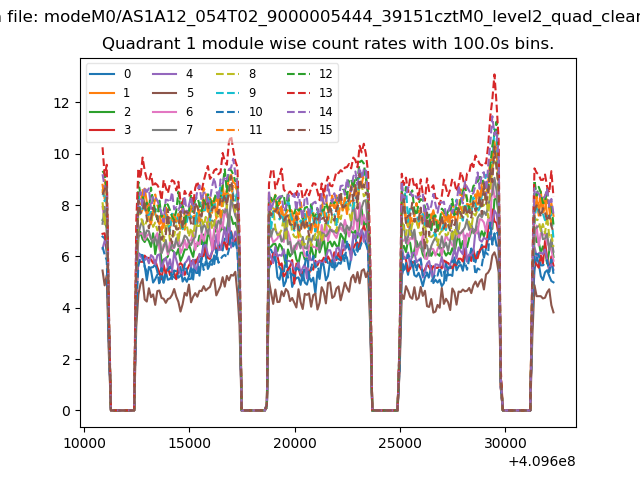
| Module-wise count rates for Quadrant A Data is divided into 100 sec bins |
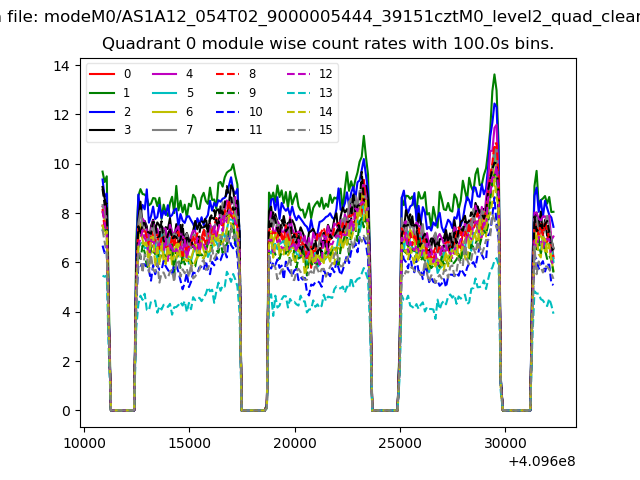 |
 |
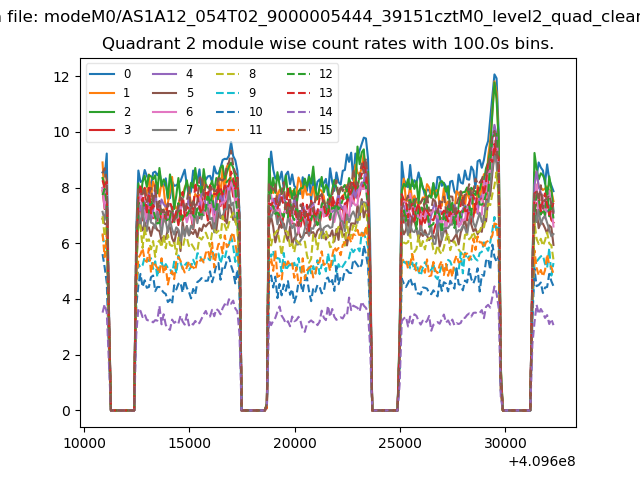
| Module-wise count rates for Quadrant B Data is divided into 100 sec bins |
 |
 |
| Module-wise count rates for Quadrant C Data is divided into 100 sec bins |
 |
 |
| Module-wise count rates for Quadrant D Data is divided into 100 sec bins |
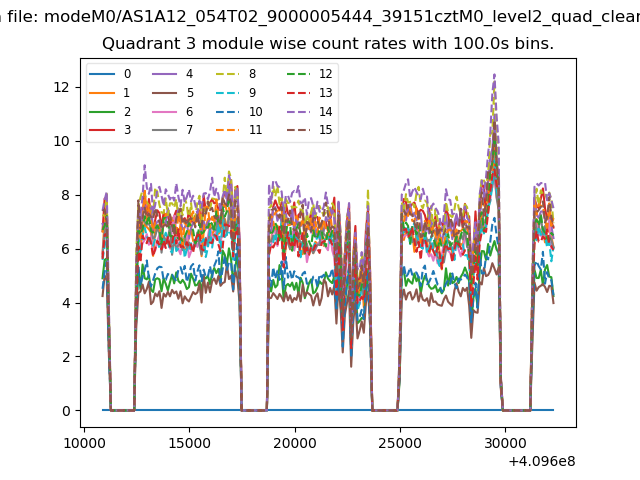 |
 |
| Parameter | Plot |
|---|---|
| CZT HV Monitor | 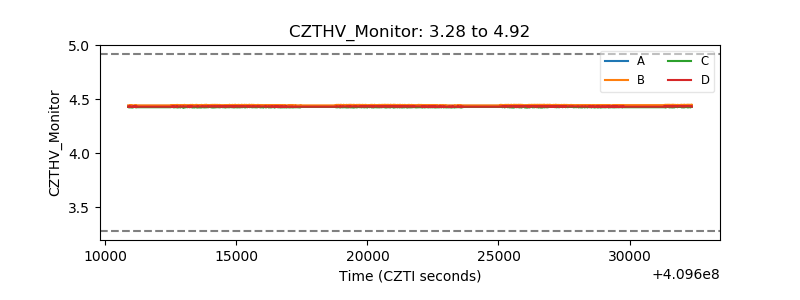 |
| D_VDD | 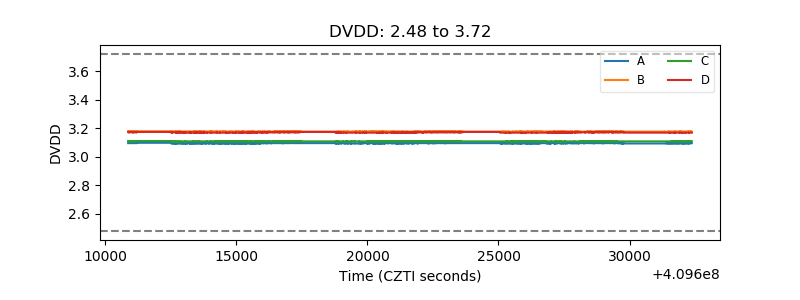 |
| Temperature 1 | 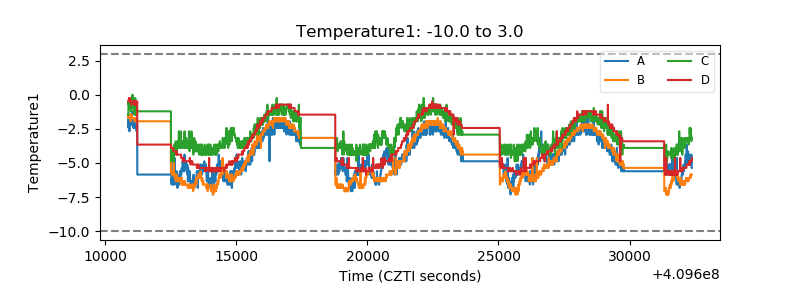 |
| Veto HV Monitor | 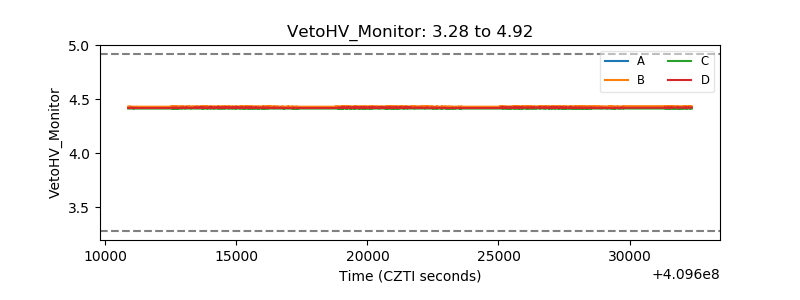 |
| Veto LLD | 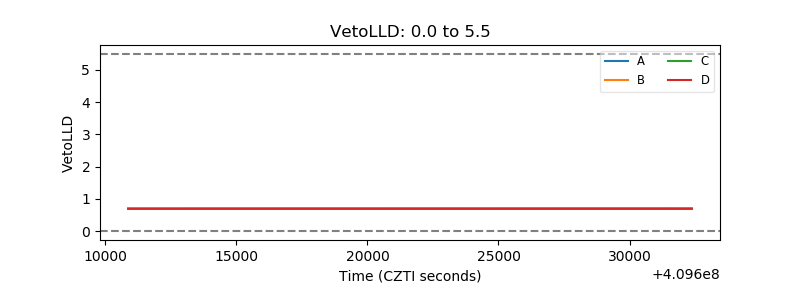 |
| Alpha Counter | 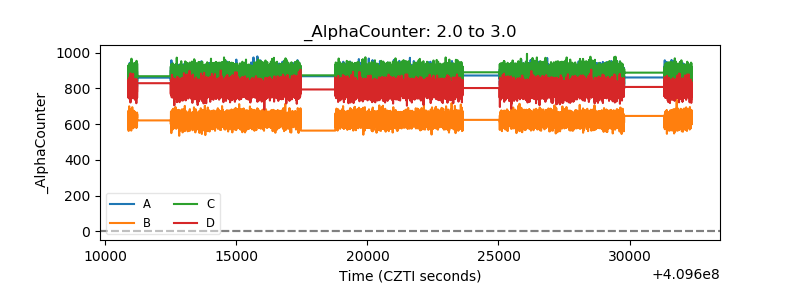 |
| _CPM_Rate | 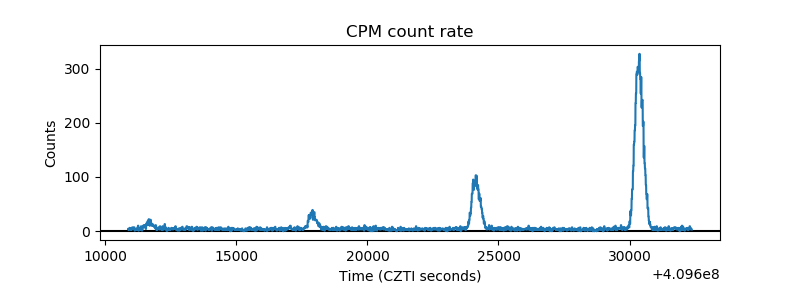 |
| CZT Counter | 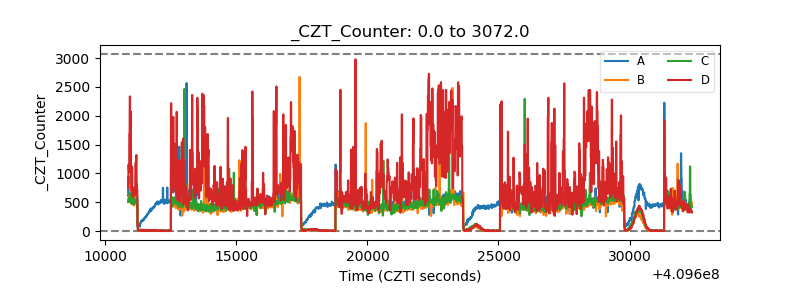 |
| +2.5 Volts monitor | 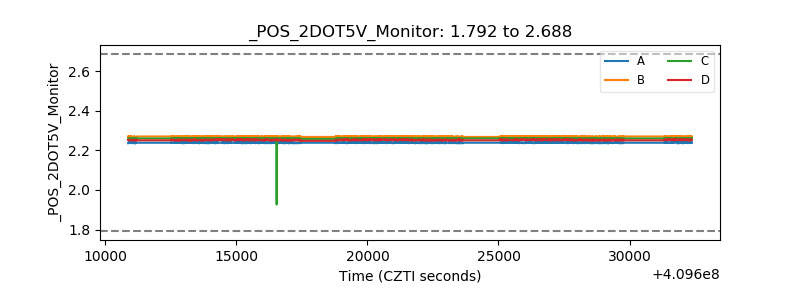 |
| +5 Volts monitor | 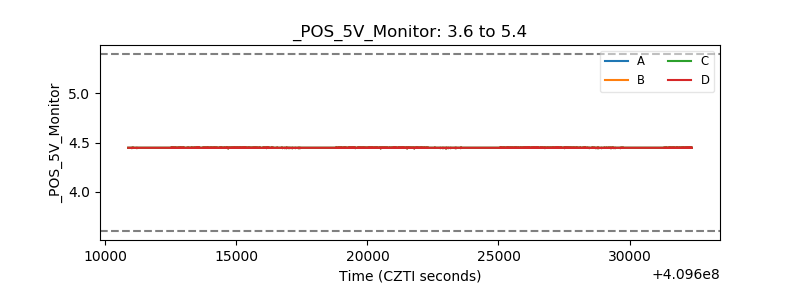 |
| _ROLL_ROT | 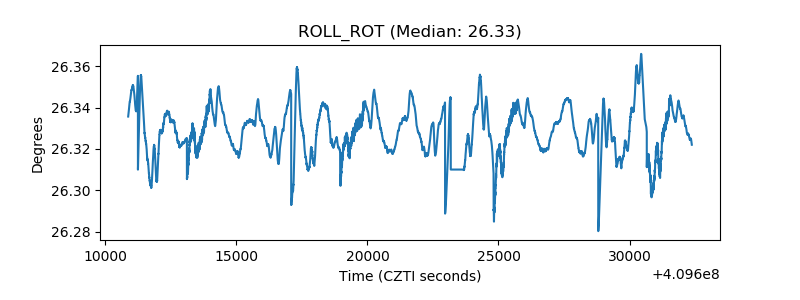 |
| _Roll_DEC | 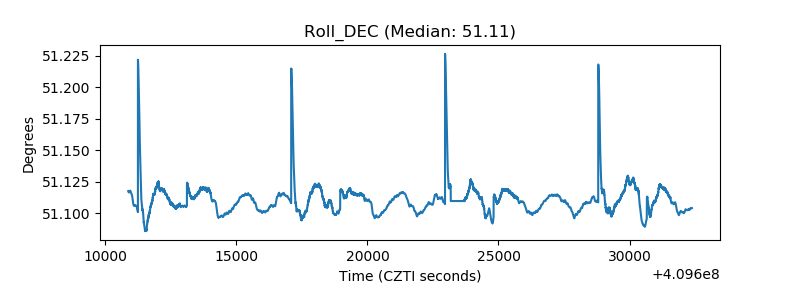 |
| _Roll_RA | 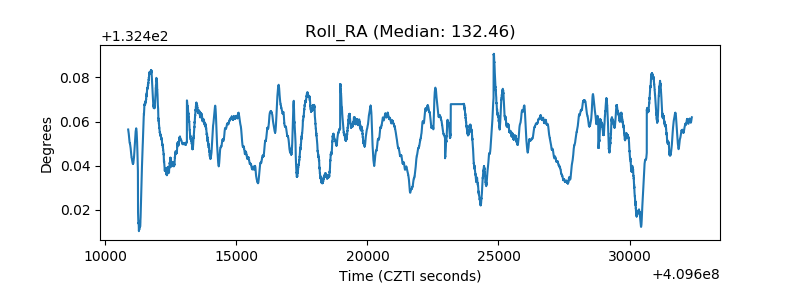 |
| Veto Counter | 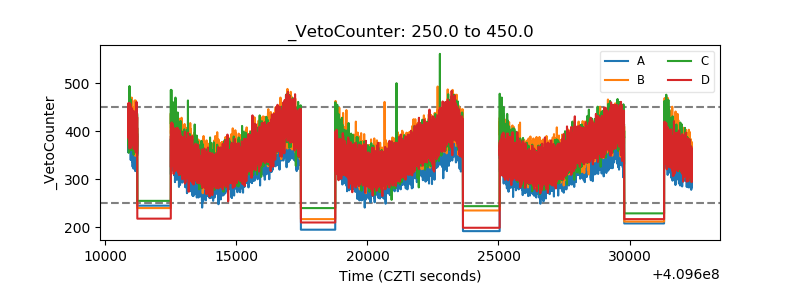 |