| Param | Original file | Final file |
|---|---|---|
| Filename | modeM0/AS1A12_054T02_9000005444_39152cztM0_level2.fits | modeM0/AS1A12_054T02_9000005444_39152cztM0_level2_quad_clean.evt |
| Size (bytes) | 343,575,360 | 93,191,040 |
| Size | 327.7 MB | 88.9 MB |
| Events in quadrant A | 2,904,303 | 636,450 |
| Events in quadrant B | 2,556,846 | 642,366 |
| Events in quadrant C | 3,065,503 | 596,086 |
| Events in quadrant D | 3,755,234 | 555,309 |
| Mode M9 | |||
|---|---|---|---|
| Quadrant | BADHDUFLAG | Total packets | Discarded packets |
| A | 0 | 25 | 0 |
| B | 0 | 25 | 0 |
| C | 0 | 25 | 0 |
| D | 0 | 26 | 0 |
| Mode M0 | |||
|---|---|---|---|
| Quadrant | BADHDUFLAG | Total packets | Discarded packets |
| A | 0 | 11989 | 3 |
| B | 0 | 11491 | 2 |
| C | 0 | 12703 | 2 |
| D | 0 | 15146 | 2 |
| Mode SS | |||
|---|---|---|---|
| Quadrant | BADHDUFLAG | Total packets | Discarded packets |
| A | 0 | 114 | 0 |
| B | 0 | 114 | 0 |
| C | 0 | 114 | 0 |
| D | 0 | 114 | 0 |
| Quadrant | Total seconds | Saturated seconds | Saturation percentage |
|---|---|---|---|
| A | 5598 | 4 | 0.071454% |
| B | 5598 | 27 | 0.482315% |
| C | 5598 | 152 | 2.715255% |
| D | 5598 | 196 | 3.501250% |
Noise dominated data is calculated using 1-second bins in cleaned event files. If a bin has >2000 counts, and if more than 50% of those come from <1% of pixels, then it is considered to be noise-dominated and hence unusable.
| Quadrant | # 1 sec bins | Bins with >0 counts | Bins with >2000 counts | High rate bins dominated by noise | Noise dominated (total time) | Noise dominated (detector-on time) | Marked lightcurve |
|---|---|---|---|---|---|---|---|
| A | 7241 | 5599 | 6 | 6 | 0.08% | 0.11% | 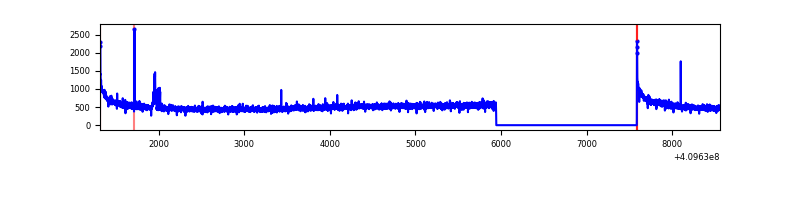 |
| B | 7241 | 5599 | 20 | 20 | 0.28% | 0.36% | 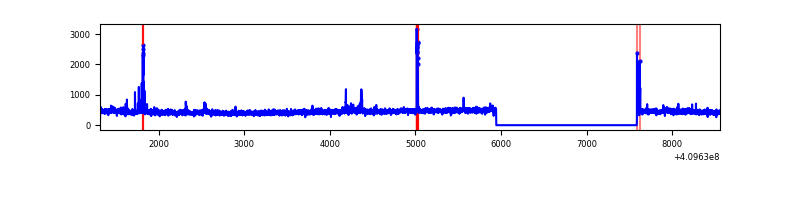 |
| C | 7241 | 5599 | 124 | 124 | 1.71% | 2.21% | 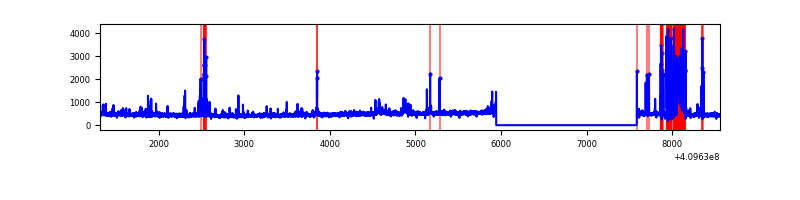 |
| D | 7241 | 5599 | 191 | 191 | 2.64% | 3.41% | 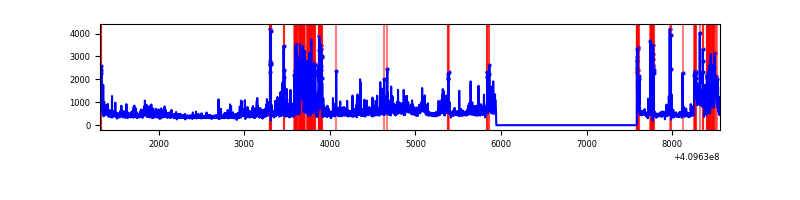 |
Top three noisy pixels from each quadrant. If the there are fewer than three noisy pixels in the level2.evt file, extra rows are filled as -1
| Pixel properties | Quadrant properties | ||||||
|---|---|---|---|---|---|---|---|
| Quadrant | DetID | PixID | Counts | Sigma | Mean | Median | Sigma |
| A | 10 | 83 | 440701 | 3511.82 | 622 | 611 | 125.3 |
| A | 2 | 79 | 26594 | 207.34 | 622 | 611 | 125.3 |
| A | 15 | 223 | 16050 | 123.2 | 622 | 611 | 125.3 |
| B | 5 | 172 | 95045 | 796.84 | 614 | 598 | 118.5 |
| B | 0 | 190 | 35900 | 297.84 | 614 | 598 | 118.5 |
| B | 12 | 111 | 14856 | 120.29 | 614 | 598 | 118.5 |
| C | 9 | 187 | 399144 | 2901.41 | 589 | 594 | 137.4 |
| C | 15 | 214 | 231390 | 1680.18 | 589 | 594 | 137.4 |
| C | 14 | 254 | 73144 | 528.16 | 589 | 594 | 137.4 |
| D | 12 | 235 | 344653 | 2350.31 | 594 | 577 | 146.4 |
| D | 13 | 171 | 287227 | 1958.05 | 594 | 577 | 146.4 |
| D | 13 | 249 | 284879 | 1942.01 | 594 | 577 | 146.4 |
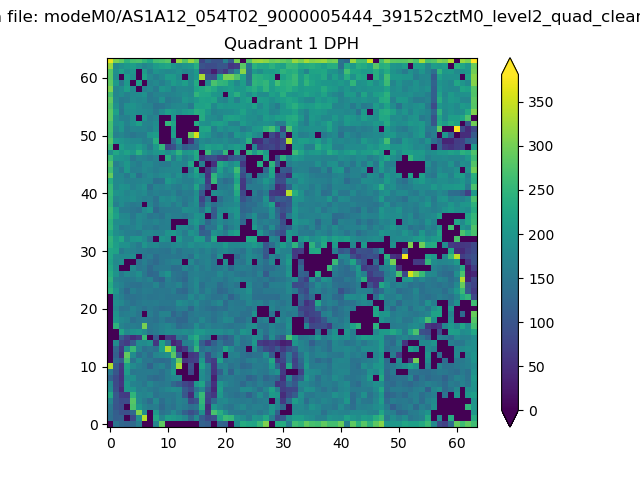
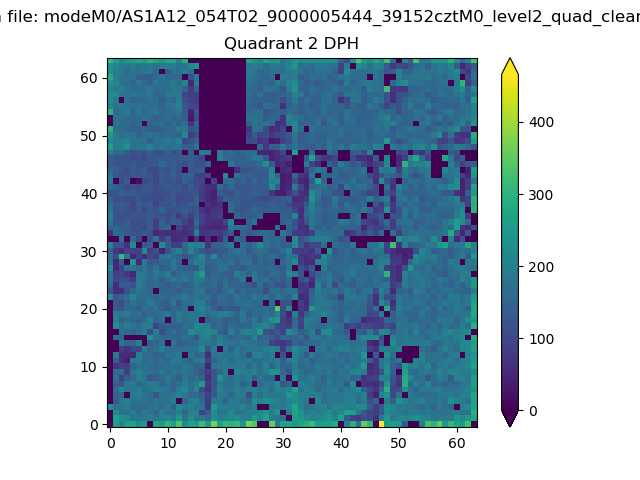
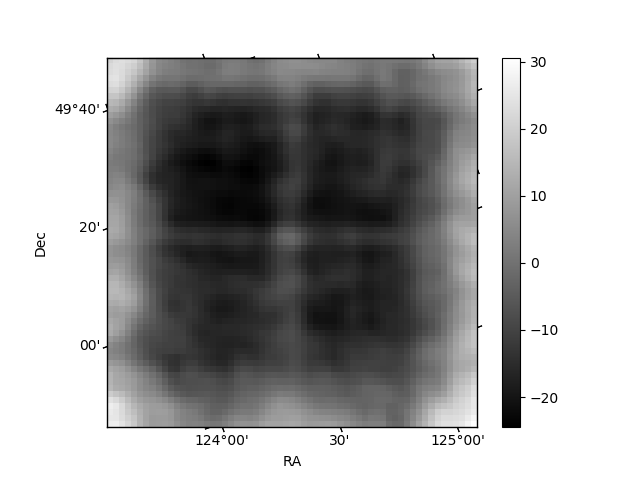
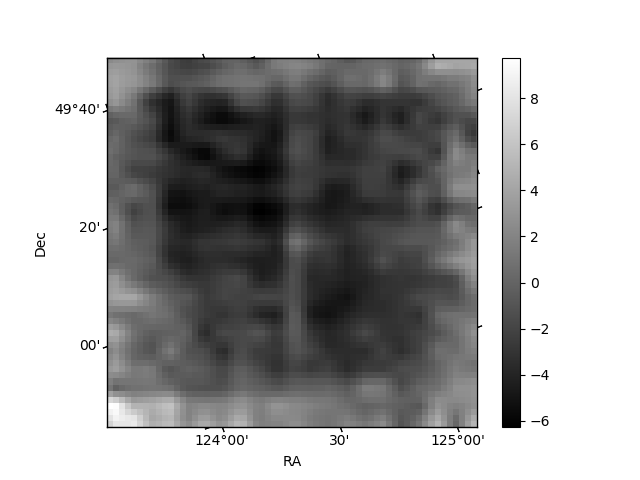
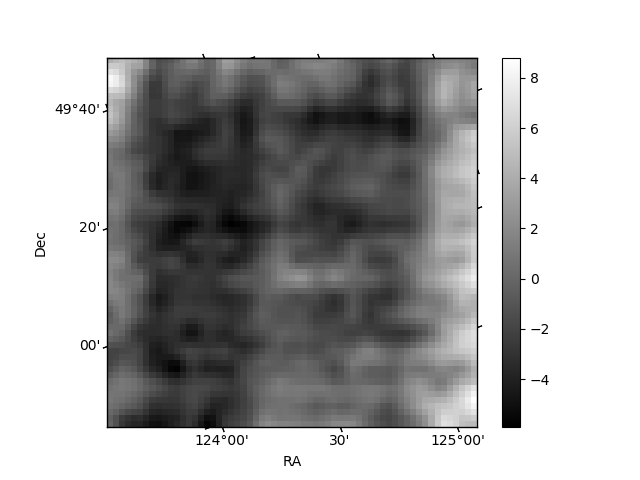
Histogram calculated using DETX and DETY for each event in the final _common_clean file
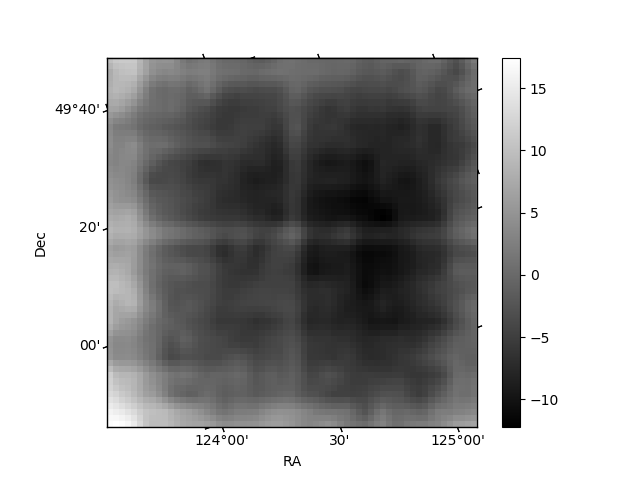
| Quadrant A |  |
 |
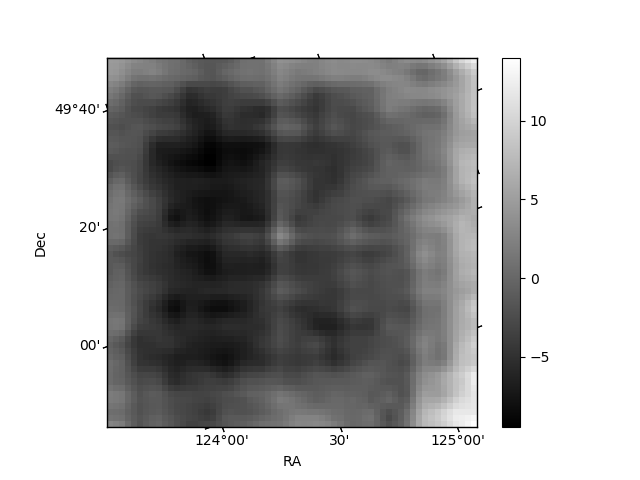
Quadrant B |
|---|---|---|---|
| Quadrant D | 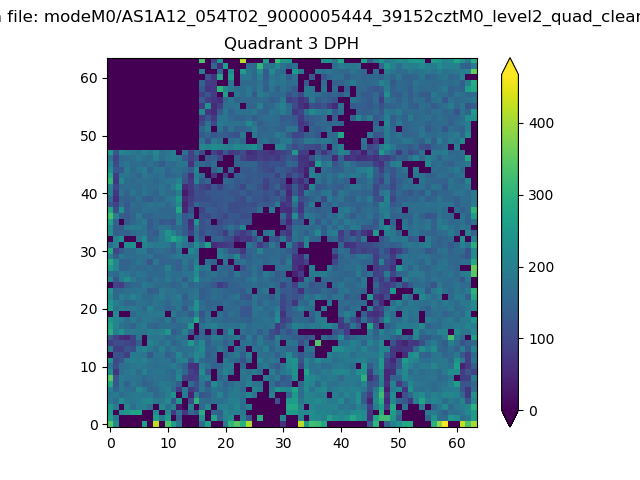 |
 |
Quadrant C |
| Plot type | Count rate plots | Images |
|---|---|---|
| Comparison with Poisson distribution Blue bars denote a histogram of data divided into 1 sec bins. Red curve is a Poisson curve with rate = median count rate of data. |
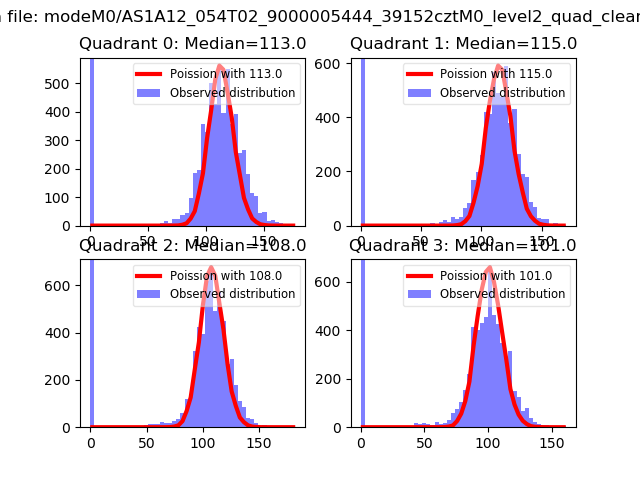 |
 |
| Quadrant-wise count rates Data is divided into 100 sec bins |
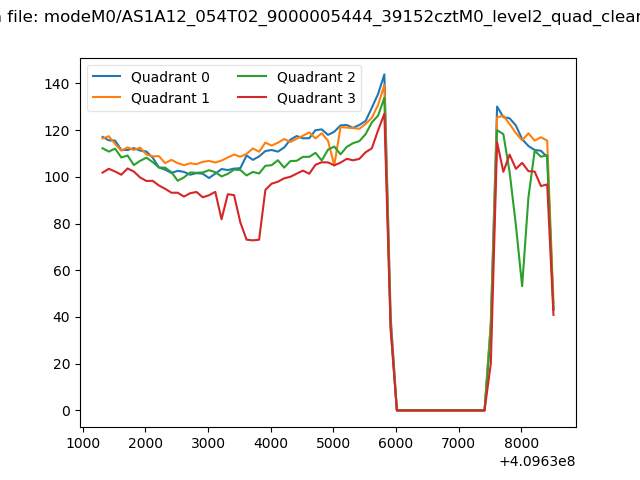 |
|
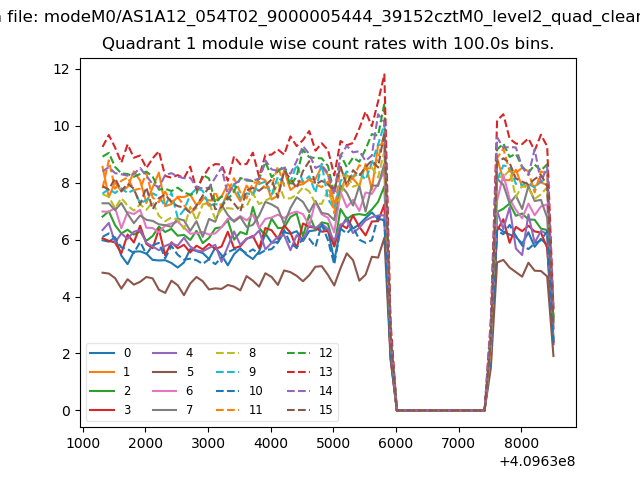
| Module-wise count rates for Quadrant A Data is divided into 100 sec bins |
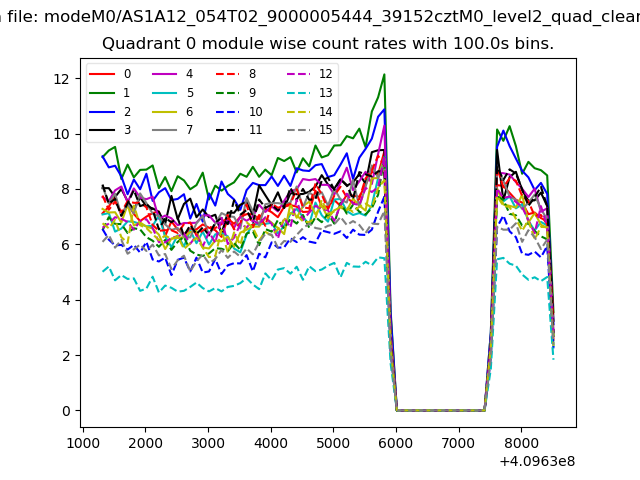 |
 |
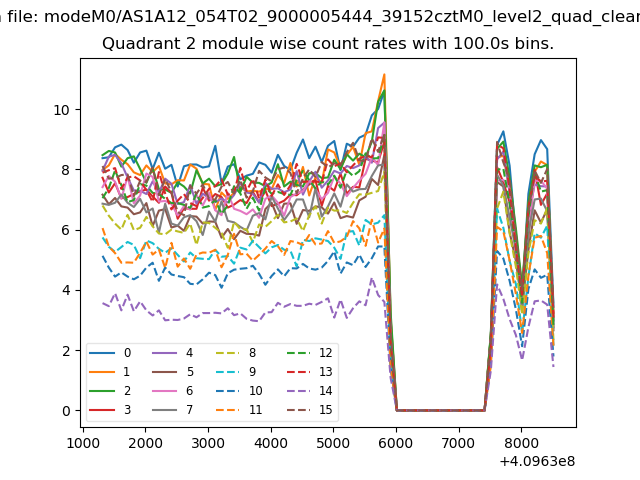
| Module-wise count rates for Quadrant B Data is divided into 100 sec bins |
 |
 |
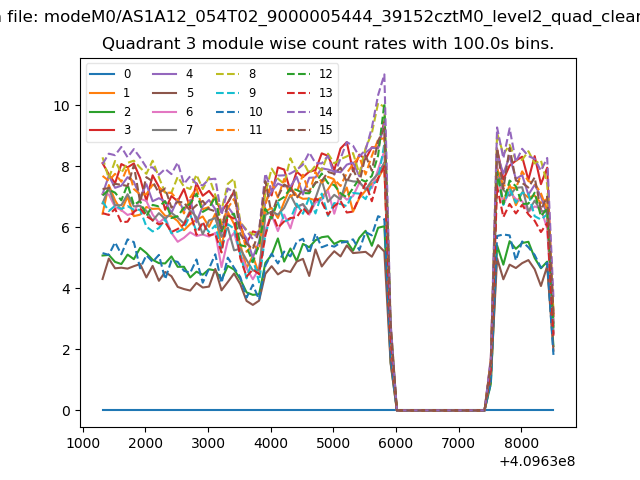
| Module-wise count rates for Quadrant C Data is divided into 100 sec bins |
 |
 |
| Module-wise count rates for Quadrant D Data is divided into 100 sec bins |
 |
 |
| Parameter | Plot |
|---|---|
| CZT HV Monitor | 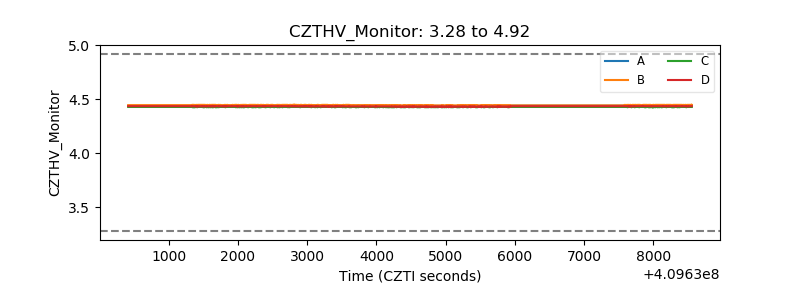 |
| D_VDD | 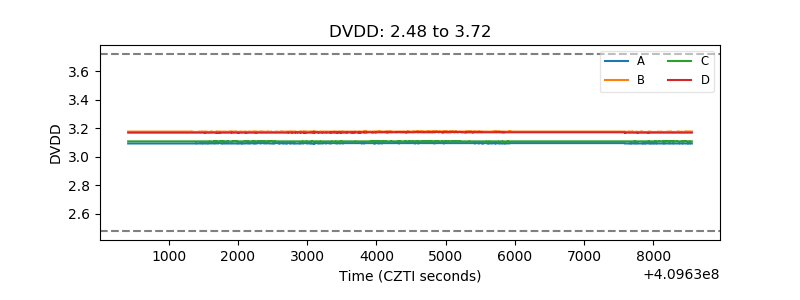 |
| Temperature 1 | 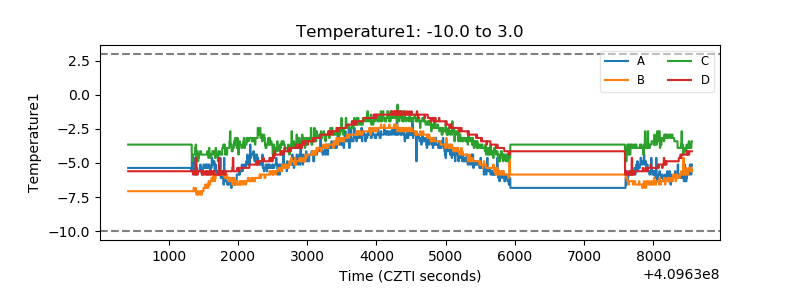 |
| Veto HV Monitor | 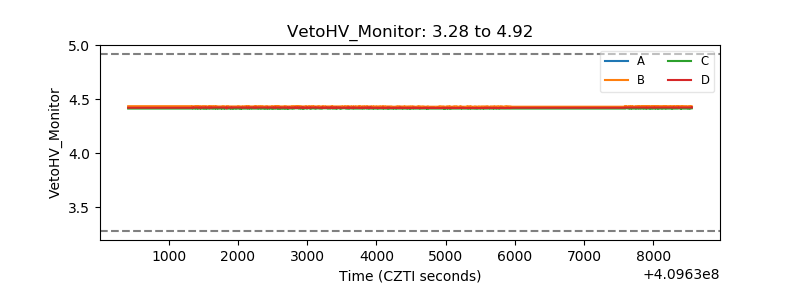 |
| Veto LLD | 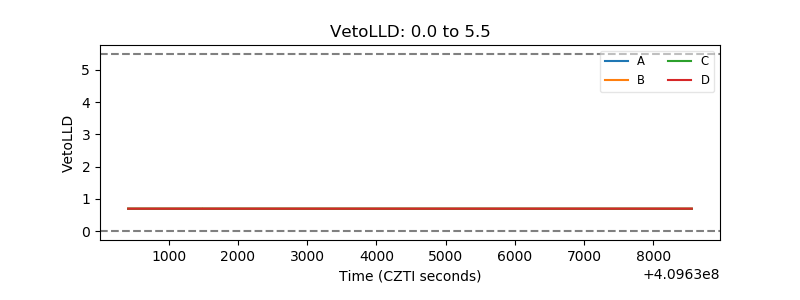 |
| Alpha Counter | 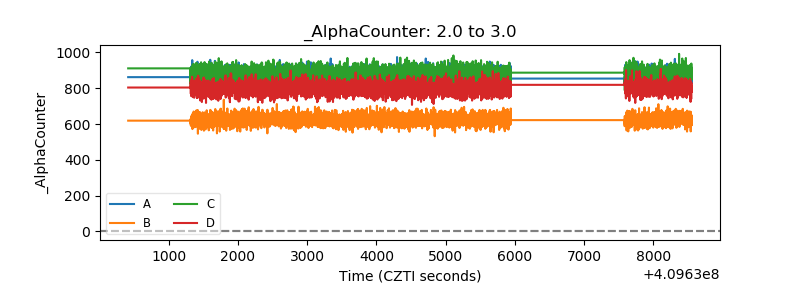 |
| _CPM_Rate | 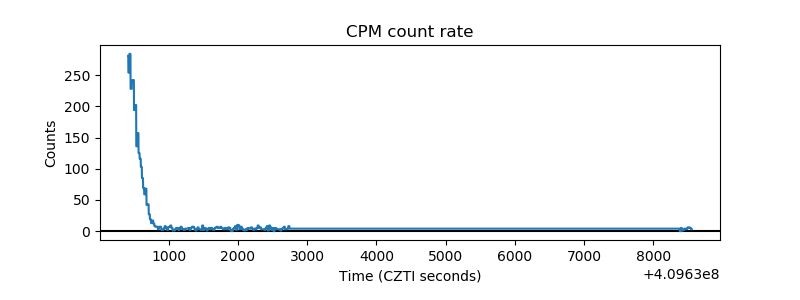 |
| CZT Counter | 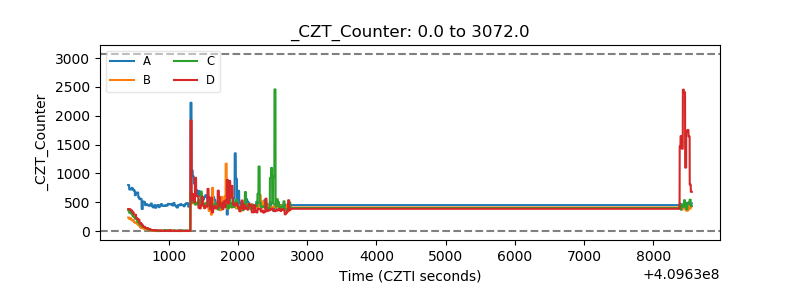 |
| +2.5 Volts monitor | 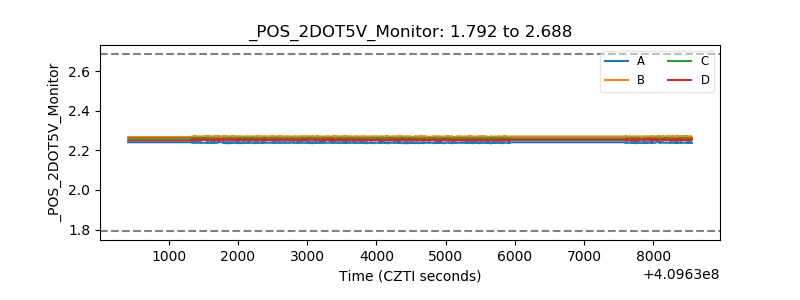 |
| +5 Volts monitor | 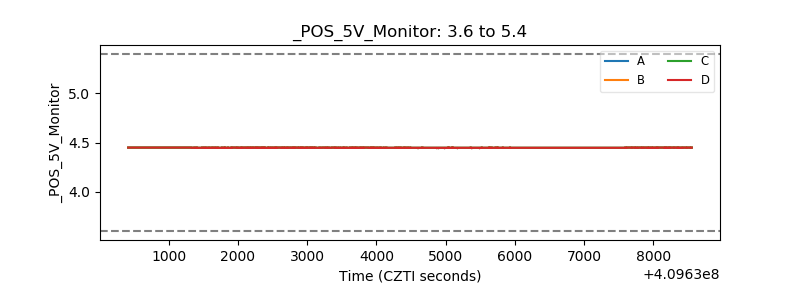 |
| _ROLL_ROT | 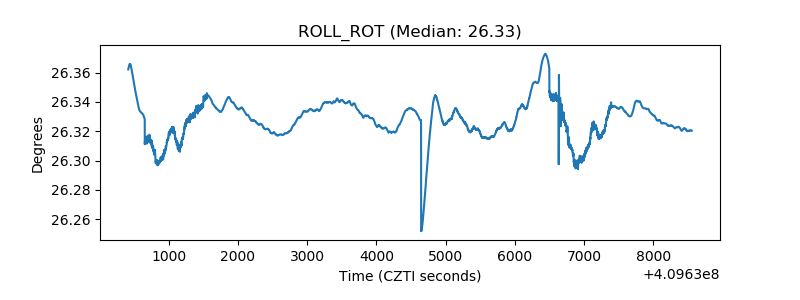 |
| _Roll_DEC | 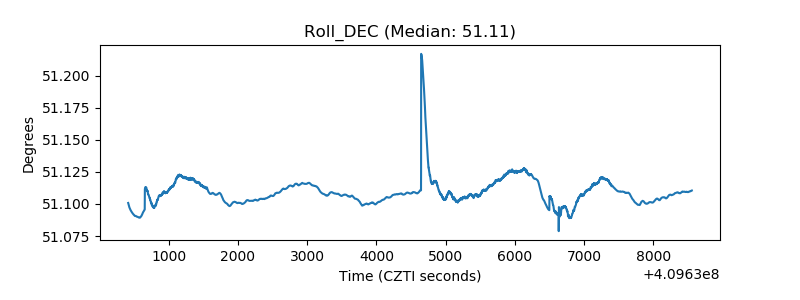 |
| _Roll_RA | 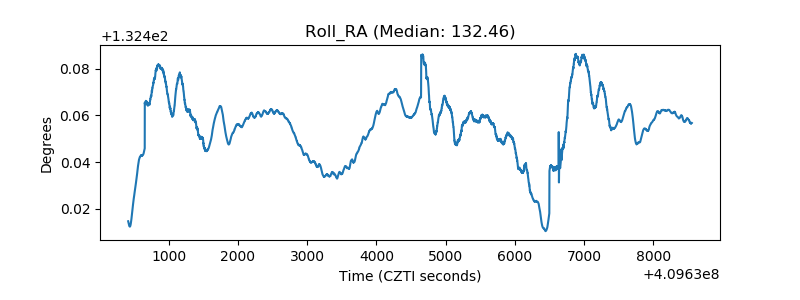 |
| Veto Counter | 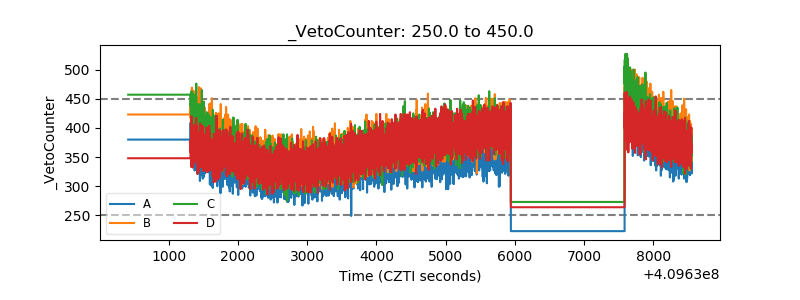 |