| Param | Original file | Final file |
|---|---|---|
| Filename | modeM0/AS1A12_054T02_9000005444_39155cztM0_level2.fits | modeM0/AS1A12_054T02_9000005444_39155cztM0_level2_quad_clean.evt |
| Size (bytes) | 317,292,480 | 91,607,040 |
| Size | 302.6 MB | 87.4 MB |
| Events in quadrant A | 3,239,502 | 626,890 |
| Events in quadrant B | 2,364,606 | 640,188 |
| Events in quadrant C | 2,488,289 | 597,704 |
| Events in quadrant D | 3,257,173 | 553,646 |
| Mode M9 | |||
|---|---|---|---|
| Quadrant | BADHDUFLAG | Total packets | Discarded packets |
| A | 0 | 27 | 0 |
| B | 0 | 27 | 0 |
| C | 0 | 27 | 0 |
| D | 0 | 28 | 0 |
| Mode M0 | |||
|---|---|---|---|
| Quadrant | BADHDUFLAG | Total packets | Discarded packets |
| A | 0 | 12594 | 3 |
| B | 0 | 10265 | 2 |
| C | 0 | 10327 | 2 |
| D | 0 | 12987 | 2 |
| Mode SS | |||
|---|---|---|---|
| Quadrant | BADHDUFLAG | Total packets | Discarded packets |
| A | 0 | 102 | 0 |
| B | 0 | 102 | 0 |
| C | 0 | 102 | 0 |
| D | 0 | 102 | 0 |
| Quadrant | Total seconds | Saturated seconds | Saturation percentage |
|---|---|---|---|
| A | 5077 | 112 | 2.206027% |
| B | 5077 | 7 | 0.137877% |
| C | 5077 | 3 | 0.059090% |
| D | 5077 | 98 | 1.930274% |
Noise dominated data is calculated using 1-second bins in cleaned event files. If a bin has >2000 counts, and if more than 50% of those come from <1% of pixels, then it is considered to be noise-dominated and hence unusable.
| Quadrant | # 1 sec bins | Bins with >0 counts | Bins with >2000 counts | High rate bins dominated by noise | Noise dominated (total time) | Noise dominated (detector-on time) | Marked lightcurve |
|---|---|---|---|---|---|---|---|
| A | 6989 | 5078 | 111 | 111 | 1.59% | 2.19% | 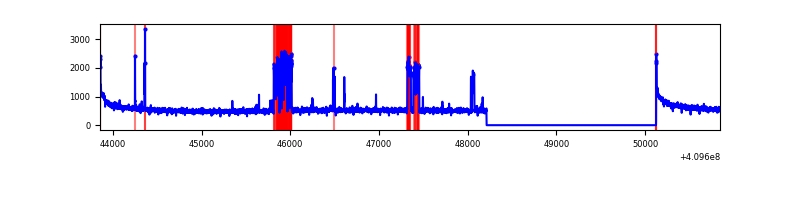 |
| B | 6989 | 5078 | 1 | 1 | 0.01% | 0.02% | 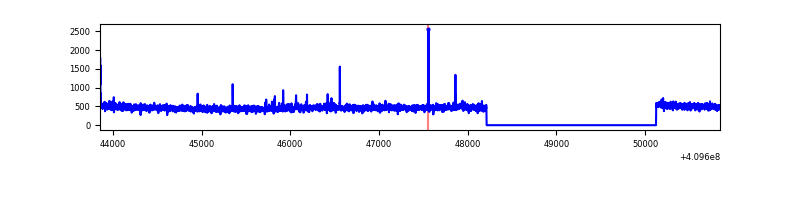 |
| C | 6989 | 5078 | 0 | 0 | 0.00% | 0.00% | 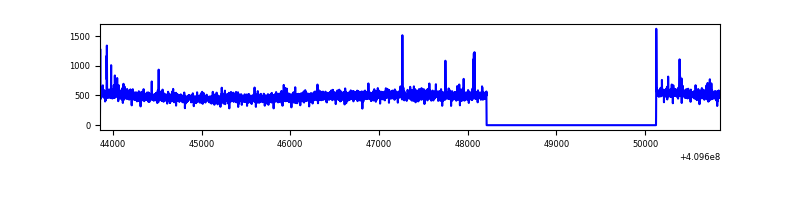 |
| D | 6989 | 5078 | 87 | 87 | 1.24% | 1.71% | 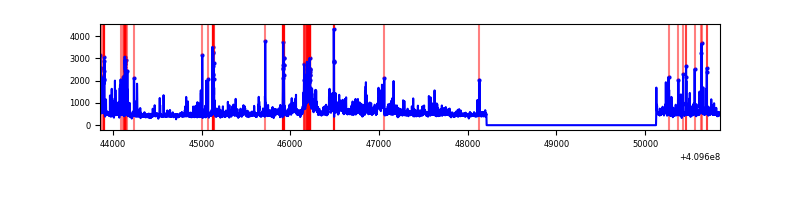 |
Top three noisy pixels from each quadrant. If the there are fewer than three noisy pixels in the level2.evt file, extra rows are filled as -1
| Pixel properties | Quadrant properties | ||||||
|---|---|---|---|---|---|---|---|
| Quadrant | DetID | PixID | Counts | Sigma | Mean | Median | Sigma |
| A | 2 | 79 | 468160 | 3850.07 | 599 | 587 | 121.4 |
| A | 10 | 83 | 417646 | 3434.13 | 599 | 587 | 121.4 |
| A | 9 | 143 | 26528 | 213.6 | 599 | 587 | 121.4 |
| B | 5 | 172 | 23947 | 205.79 | 591 | 576 | 113.6 |
| B | 12 | 111 | 13951 | 117.77 | 591 | 576 | 113.6 |
| B | 11 | 111 | 12904 | 108.55 | 591 | 576 | 113.6 |
| C | 15 | 214 | 216032 | 1616.63 | 572 | 575 | 133.3 |
| C | 9 | 187 | 25030 | 183.49 | 572 | 575 | 133.3 |
| C | 0 | 10 | 5106 | 34.0 | 572 | 575 | 133.3 |
| D | 12 | 235 | 373655 | 2632.82 | 577 | 560 | 141.7 |
| D | 2 | 249 | 309691 | 2181.45 | 577 | 560 | 141.7 |
| D | 12 | 227 | 144268 | 1014.11 | 577 | 560 | 141.7 |
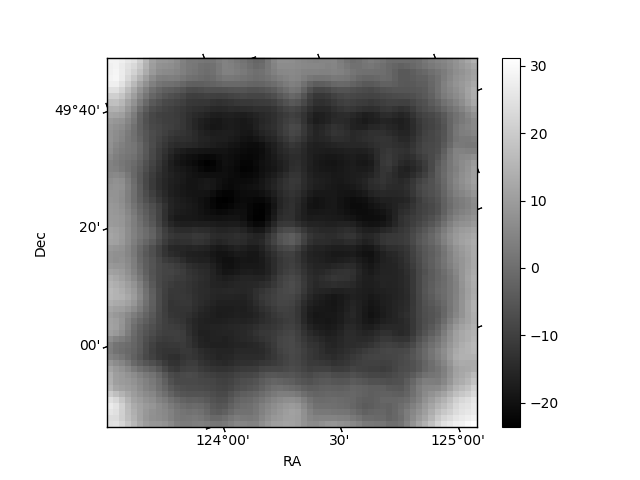
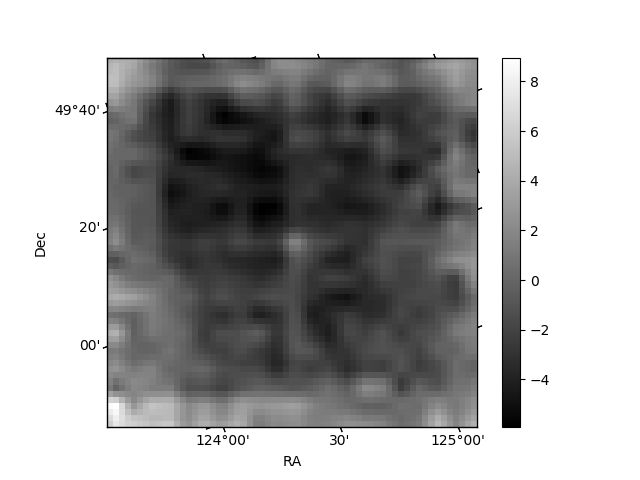
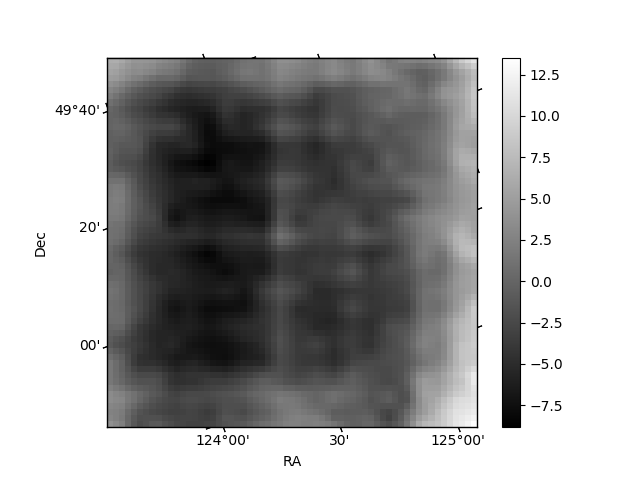
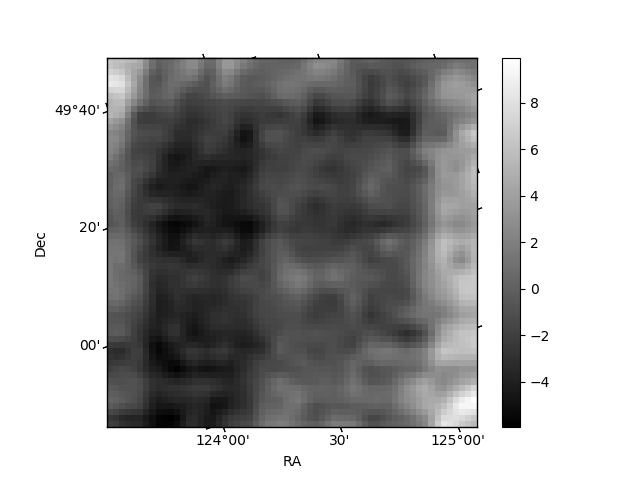
Histogram calculated using DETX and DETY for each event in the final _common_clean file
| Quadrant A | 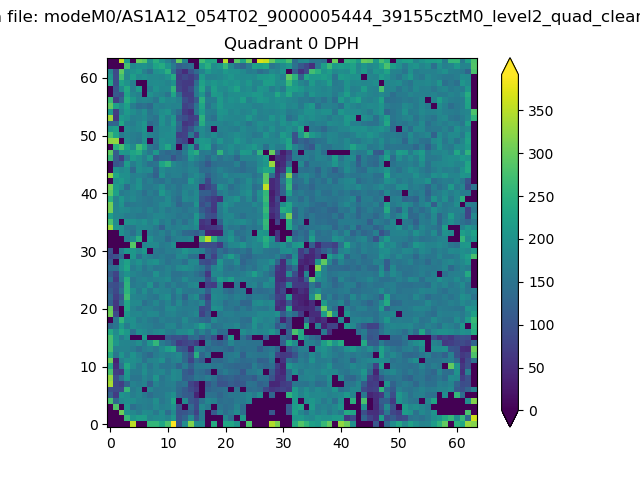 |
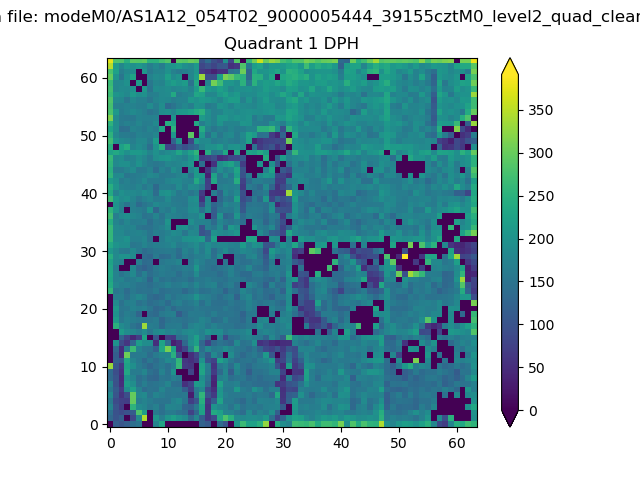 |
Quadrant B |
|---|---|---|---|
| Quadrant D | 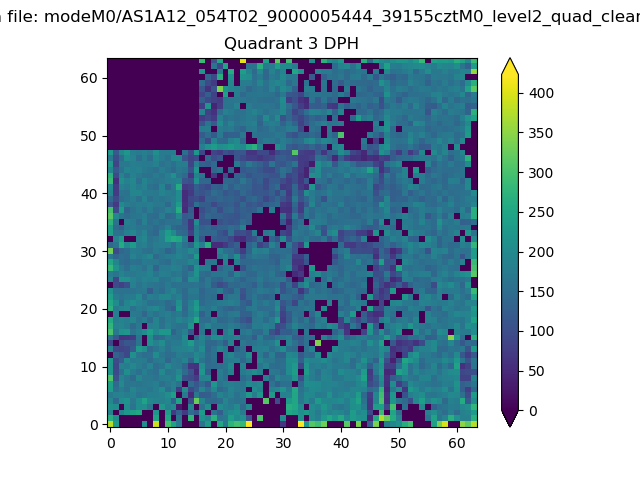 |
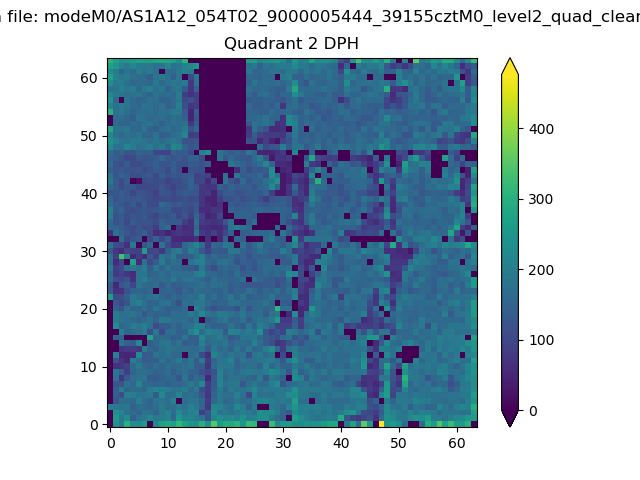 |
Quadrant C |
| Plot type | Count rate plots | Images |
|---|---|---|
| Comparison with Poisson distribution Blue bars denote a histogram of data divided into 1 sec bins. Red curve is a Poisson curve with rate = median count rate of data. |
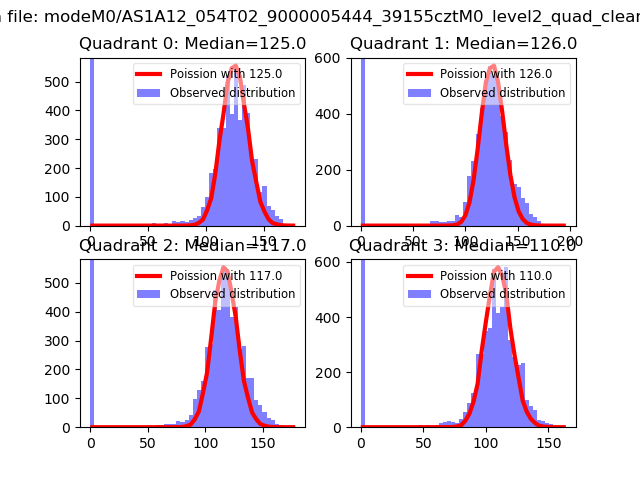 |
 |
| Quadrant-wise count rates Data is divided into 100 sec bins |
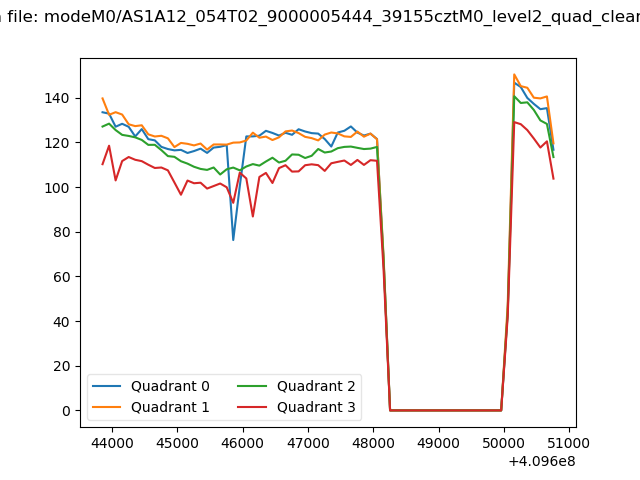 |
|
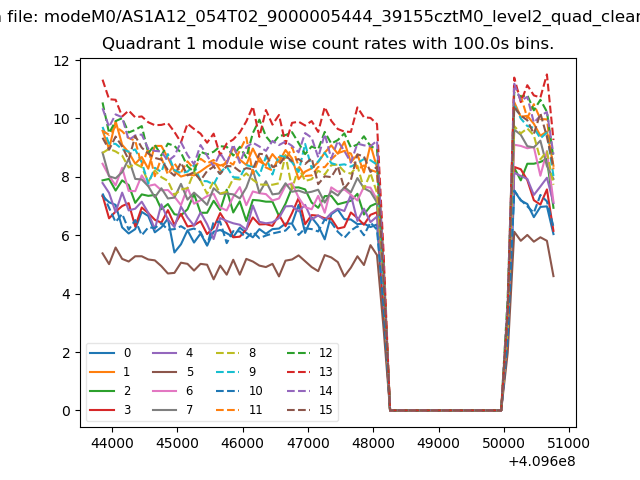
| Module-wise count rates for Quadrant A Data is divided into 100 sec bins |
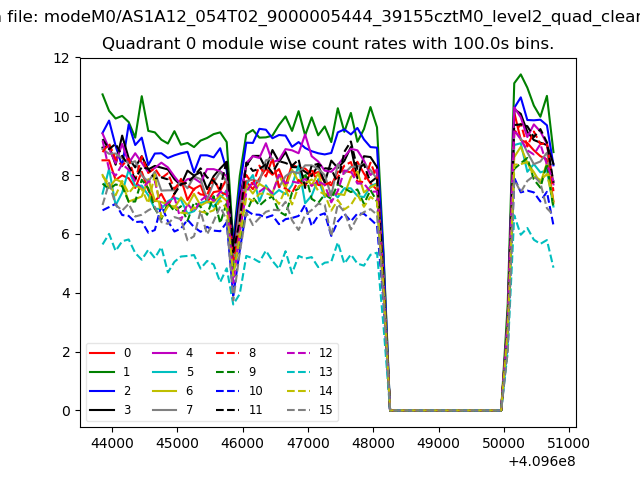 |
 |
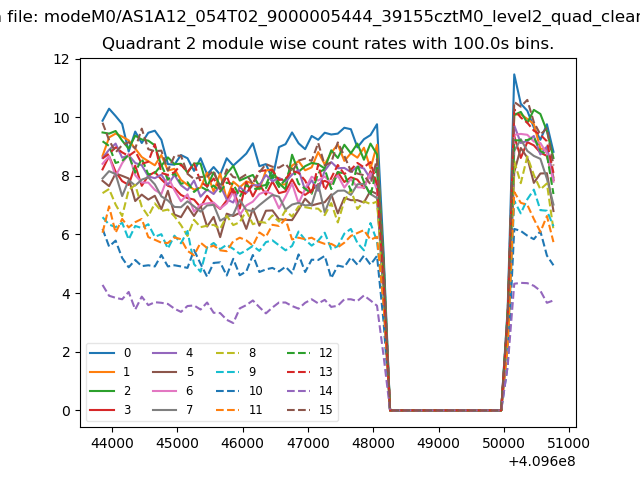
| Module-wise count rates for Quadrant B Data is divided into 100 sec bins |
 |
 |
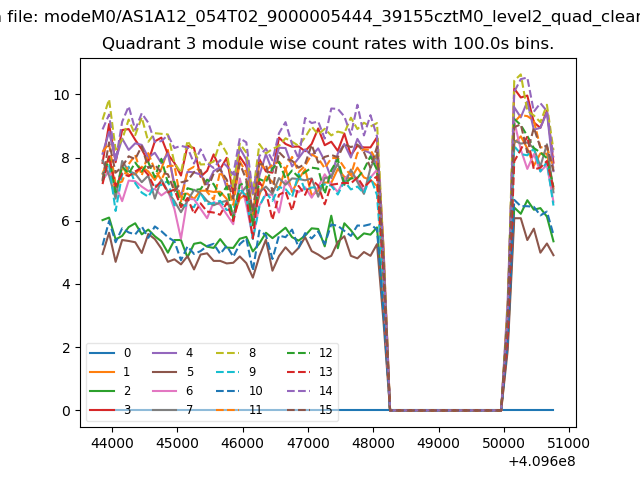
| Module-wise count rates for Quadrant C Data is divided into 100 sec bins |
 |
 |
| Module-wise count rates for Quadrant D Data is divided into 100 sec bins |
 |
 |
| Parameter | Plot |
|---|---|
| CZT HV Monitor | 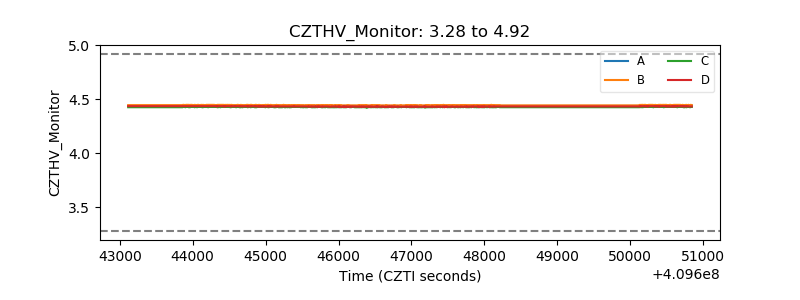 |
| D_VDD | 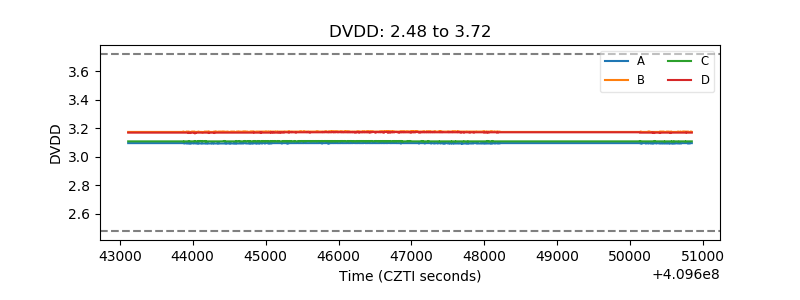 |
| Temperature 1 | 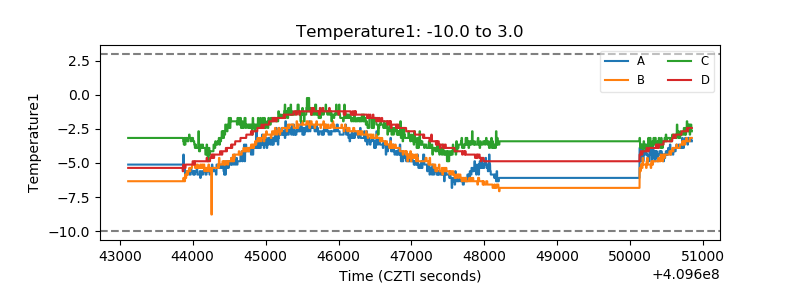 |
| Veto HV Monitor | 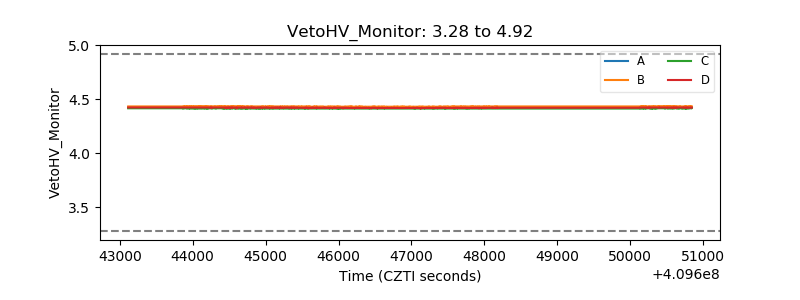 |
| Veto LLD | 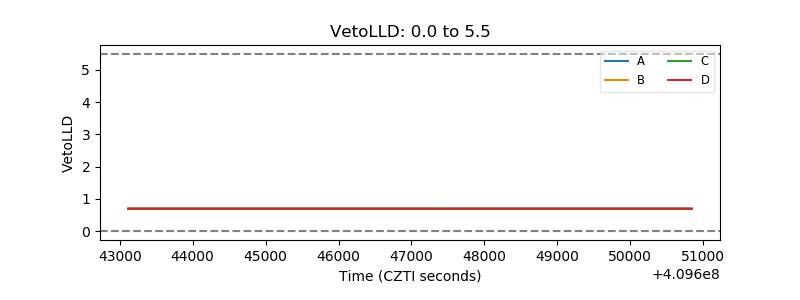 |
| Alpha Counter | 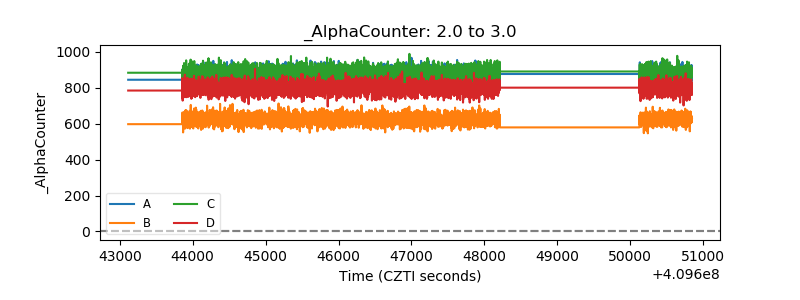 |
| _CPM_Rate | 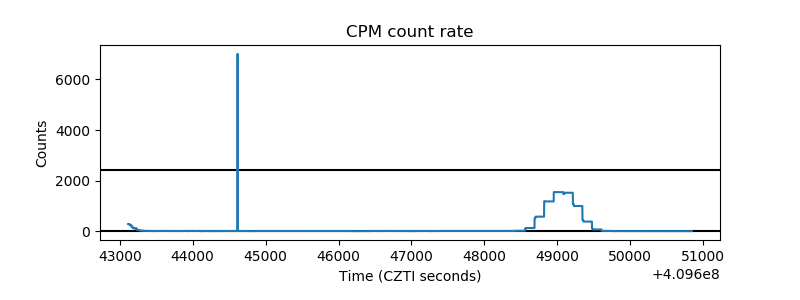 |
| CZT Counter | 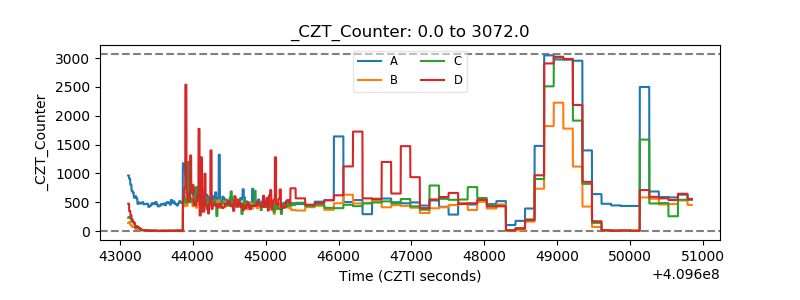 |
| +2.5 Volts monitor | 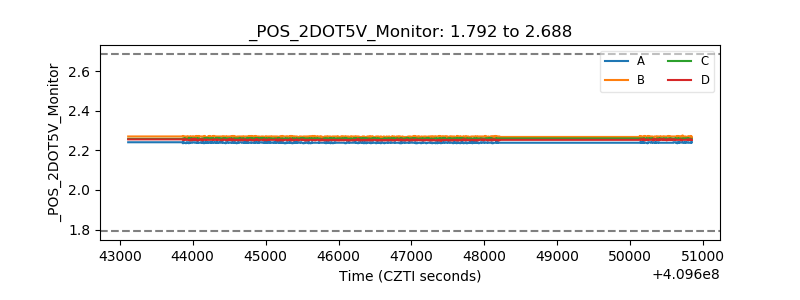 |
| +5 Volts monitor | 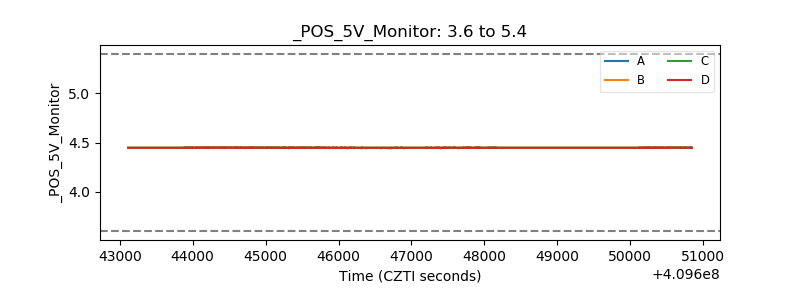 |
| _ROLL_ROT | 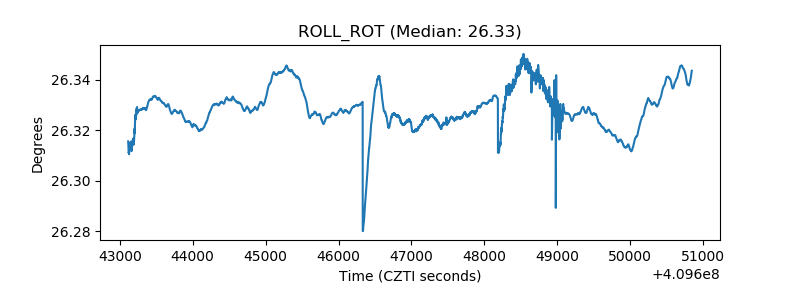 |
| _Roll_DEC | 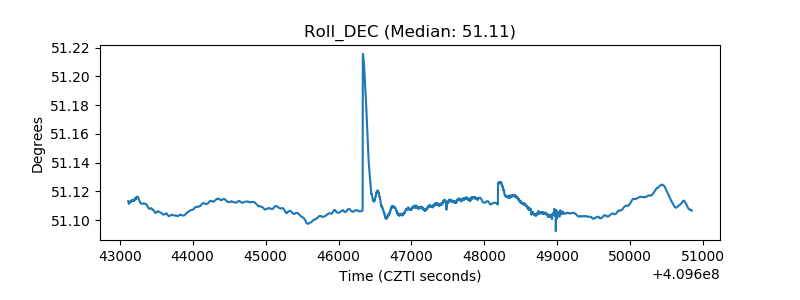 |
| _Roll_RA | 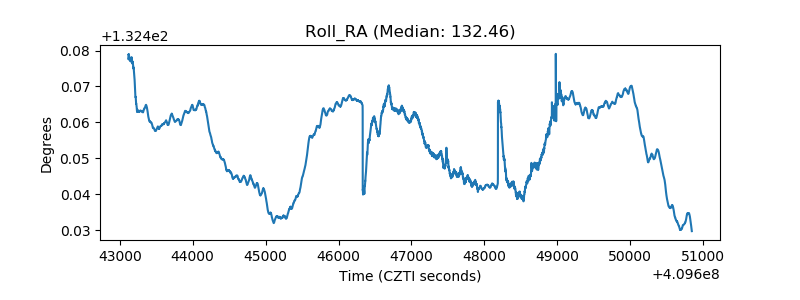 |
| Veto Counter | 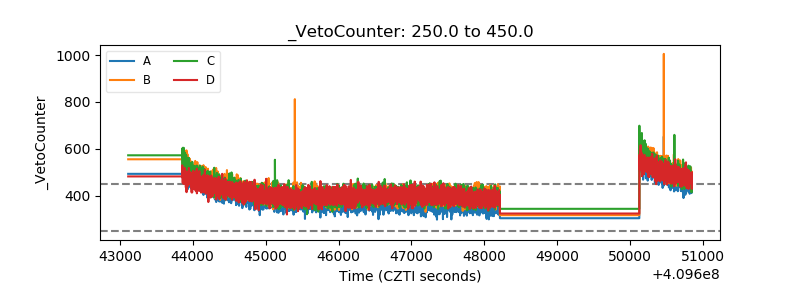 |