| Param | Original file | Final file |
|---|---|---|
| Filename | modeM0/AS1A12_054T02_9000005444_39156cztM0_level2.fits | modeM0/AS1A12_054T02_9000005444_39156cztM0_level2_quad_clean.evt |
| Size (bytes) | 337,158,720 | 99,377,280 |
| Size | 321.5 MB | 94.8 MB |
| Events in quadrant A | 2,989,914 | 691,913 |
| Events in quadrant B | 2,550,830 | 699,172 |
| Events in quadrant C | 2,658,704 | 648,143 |
| Events in quadrant D | 3,873,160 | 603,374 |
| Mode M9 | |||
|---|---|---|---|
| Quadrant | BADHDUFLAG | Total packets | Discarded packets |
| A | 0 | 27 | 0 |
| B | 0 | 27 | 0 |
| C | 0 | 27 | 0 |
| D | 0 | 28 | 0 |
| Mode M0 | |||
|---|---|---|---|
| Quadrant | BADHDUFLAG | Total packets | Discarded packets |
| A | 0 | 11900 | 3 |
| B | 0 | 10682 | 2 |
| C | 0 | 10738 | 2 |
| D | 0 | 15018 | 2 |
| Mode SS | |||
|---|---|---|---|
| Quadrant | BADHDUFLAG | Total packets | Discarded packets |
| A | 0 | 106 | 0 |
| B | 0 | 106 | 0 |
| C | 0 | 106 | 0 |
| D | 0 | 106 | 0 |
| Quadrant | Total seconds | Saturated seconds | Saturation percentage |
|---|---|---|---|
| A | 5241 | 15 | 0.286205% |
| B | 5241 | 12 | 0.228964% |
| C | 5241 | 5 | 0.095402% |
| D | 5241 | 100 | 1.908033% |
Noise dominated data is calculated using 1-second bins in cleaned event files. If a bin has >2000 counts, and if more than 50% of those come from <1% of pixels, then it is considered to be noise-dominated and hence unusable.
| Quadrant | # 1 sec bins | Bins with >0 counts | Bins with >2000 counts | High rate bins dominated by noise | Noise dominated (total time) | Noise dominated (detector-on time) | Marked lightcurve |
|---|---|---|---|---|---|---|---|
| A | 7274 | 5242 | 6 | 6 | 0.08% | 0.11% | 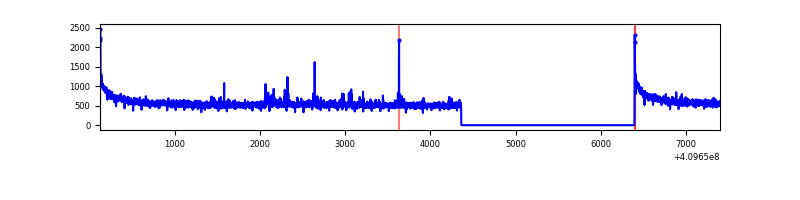 |
| B | 7274 | 5242 | 0 | 0 | 0.00% | 0.00% | 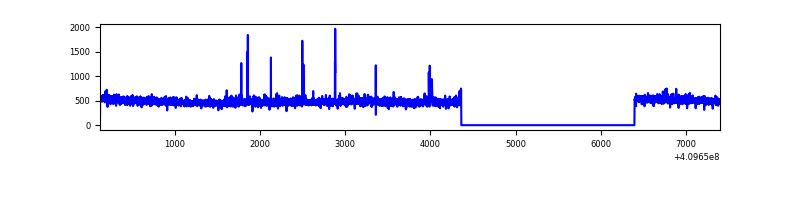 |
| C | 7274 | 5242 | 1 | 1 | 0.01% | 0.02% | 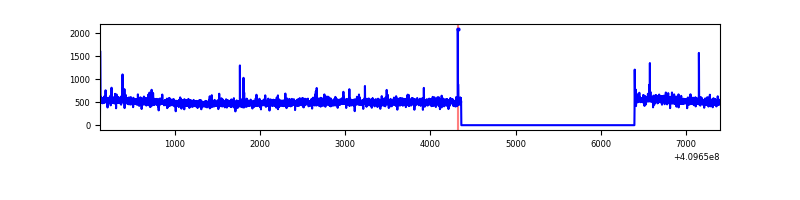 |
| D | 7274 | 5242 | 81 | 81 | 1.11% | 1.55% | 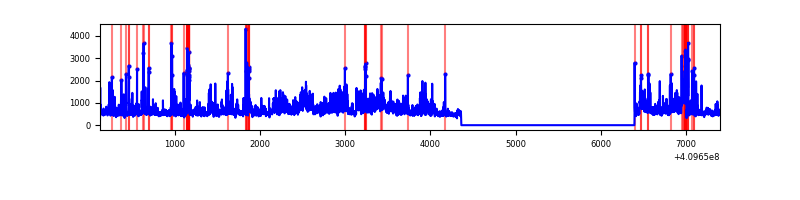 |
Top three noisy pixels from each quadrant. If the there are fewer than three noisy pixels in the level2.evt file, extra rows are filled as -1
| Pixel properties | Quadrant properties | ||||||
|---|---|---|---|---|---|---|---|
| Quadrant | DetID | PixID | Counts | Sigma | Mean | Median | Sigma |
| A | 10 | 83 | 438757 | 3384.92 | 645 | 632 | 129.4 |
| A | 13 | 248 | 23454 | 176.32 | 645 | 632 | 129.4 |
| A | 15 | 223 | 18690 | 139.51 | 645 | 632 | 129.4 |
| B | 5 | 184 | 28615 | 232.97 | 632 | 617 | 120.2 |
| B | 5 | 172 | 18194 | 146.26 | 632 | 617 | 120.2 |
| B | 0 | 213 | 17147 | 137.54 | 632 | 617 | 120.2 |
| C | 15 | 214 | 220813 | 1551.72 | 614 | 618 | 141.9 |
| C | 9 | 187 | 27348 | 188.37 | 614 | 618 | 141.9 |
| C | 15 | 208 | 9742 | 64.3 | 614 | 618 | 141.9 |
| D | 12 | 235 | 811931 | 5353.41 | 619 | 601 | 151.6 |
| D | 2 | 249 | 287909 | 1895.75 | 619 | 601 | 151.6 |
| D | 5 | 222 | 245382 | 1615.14 | 619 | 601 | 151.6 |
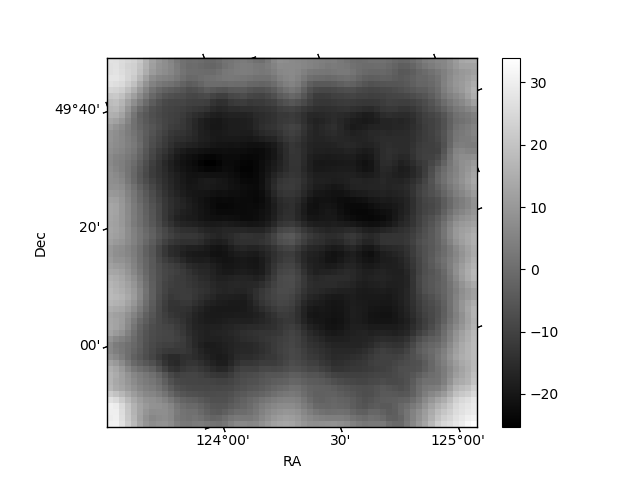
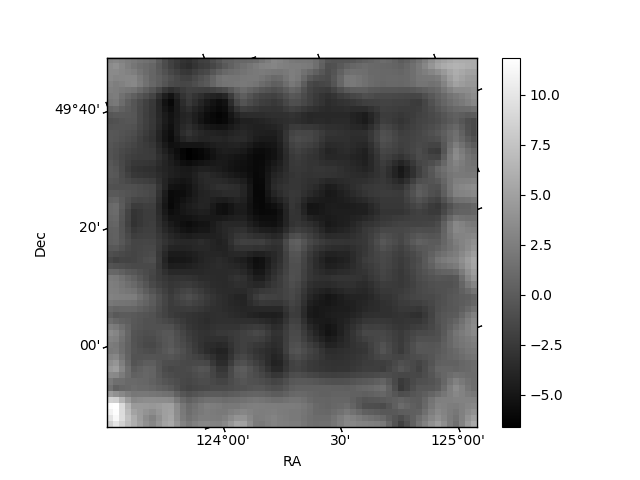
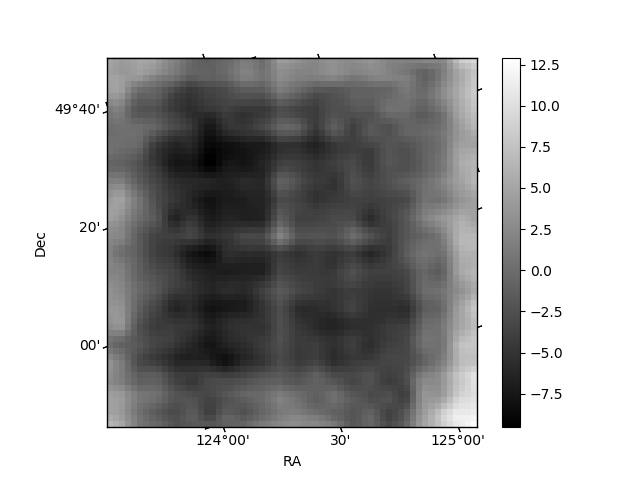
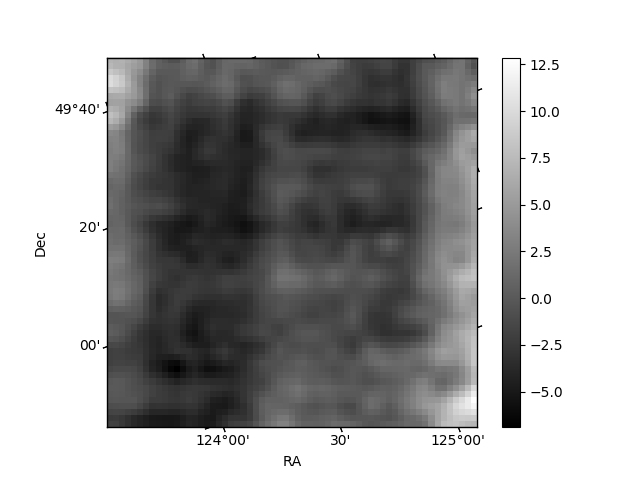
Histogram calculated using DETX and DETY for each event in the final _common_clean file
| Quadrant A | 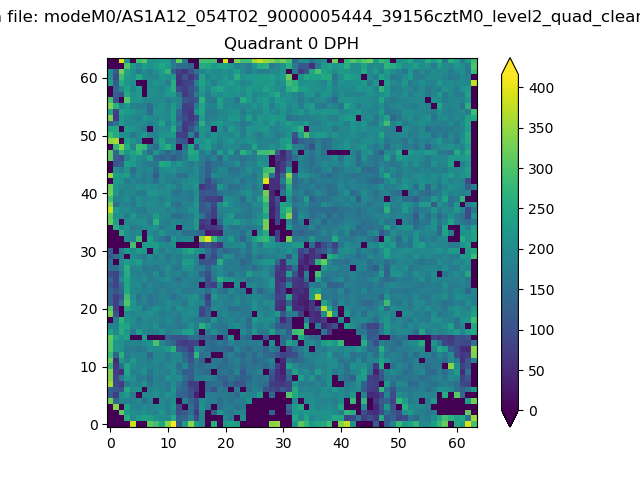 |
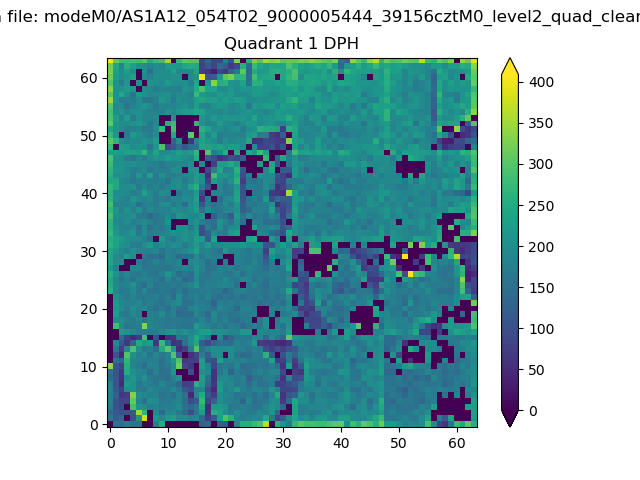 |
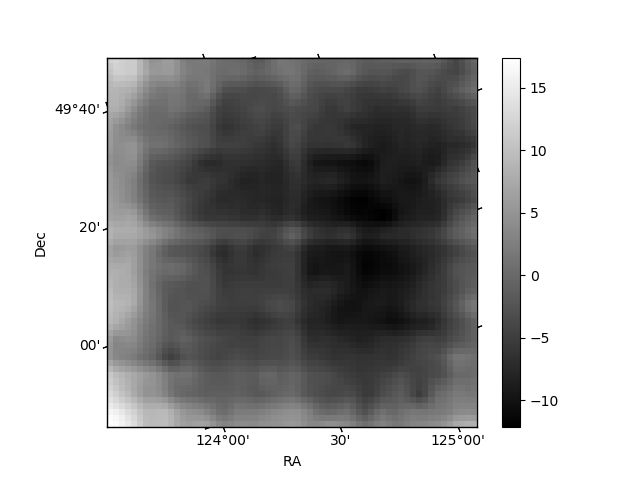
Quadrant B |
|---|---|---|---|
| Quadrant D | 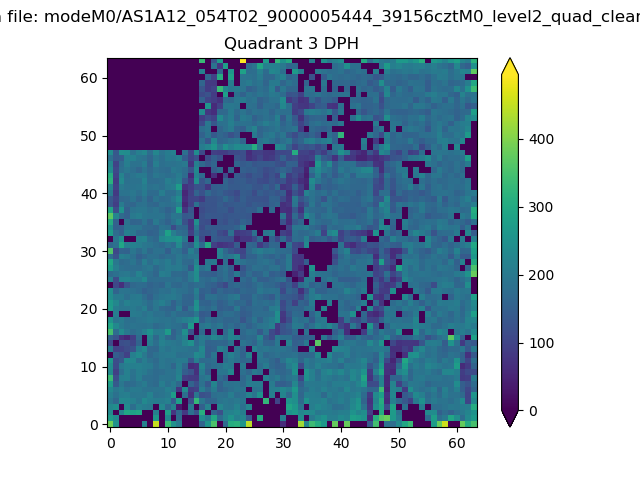 |
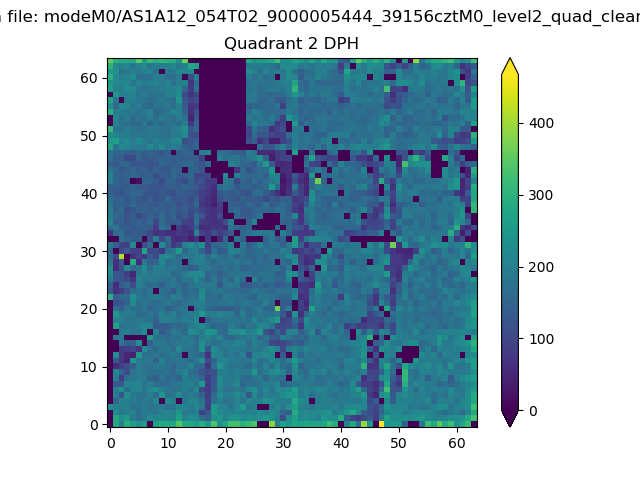 |
Quadrant C |
| Plot type | Count rate plots | Images |
|---|---|---|
| Comparison with Poisson distribution Blue bars denote a histogram of data divided into 1 sec bins. Red curve is a Poisson curve with rate = median count rate of data. |
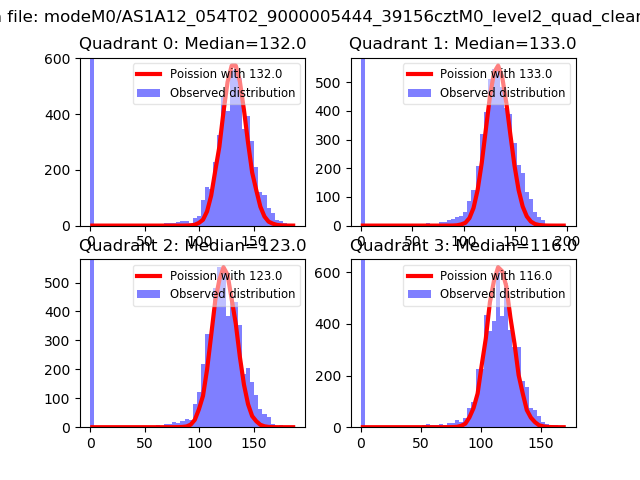 |
 |
| Quadrant-wise count rates Data is divided into 100 sec bins |
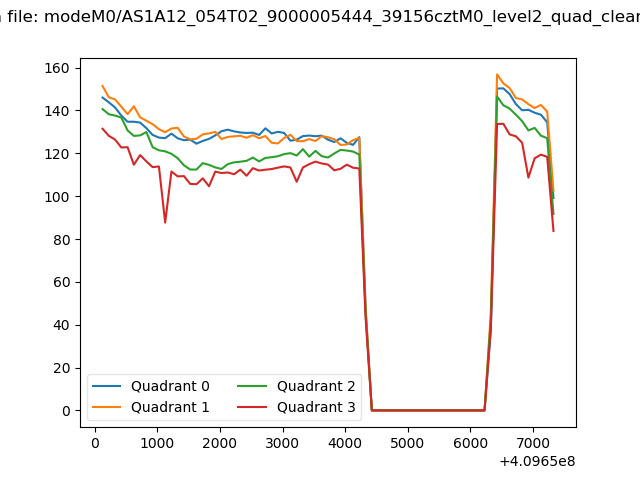 |
|
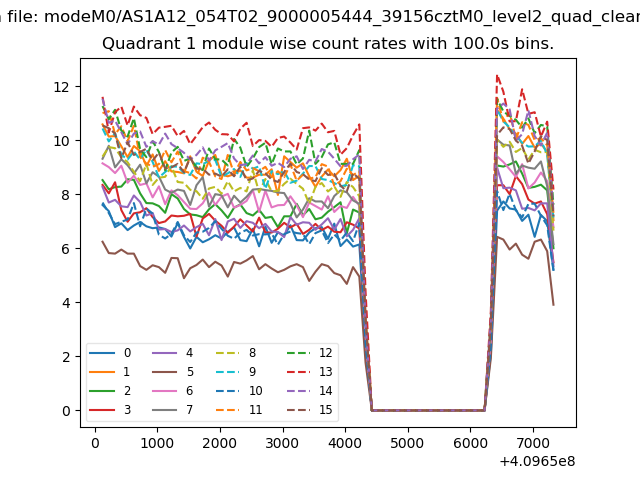
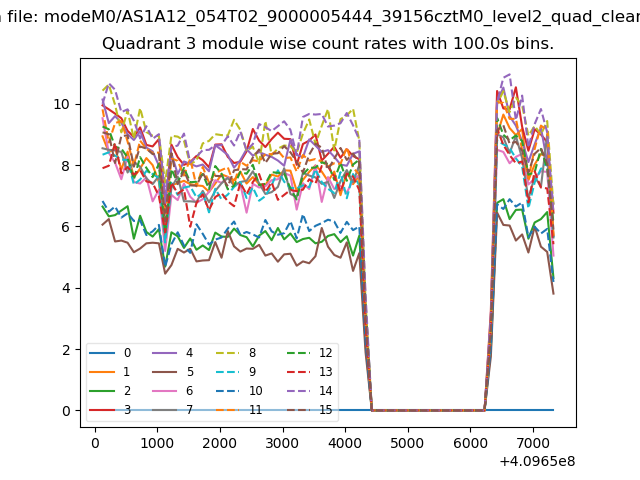
| Module-wise count rates for Quadrant A Data is divided into 100 sec bins |
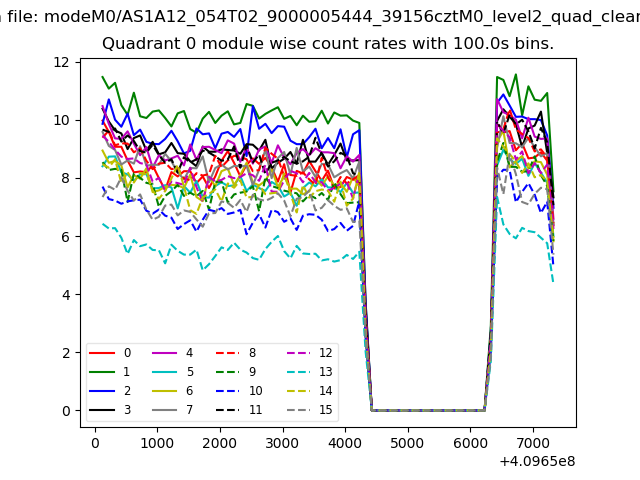 |
 |
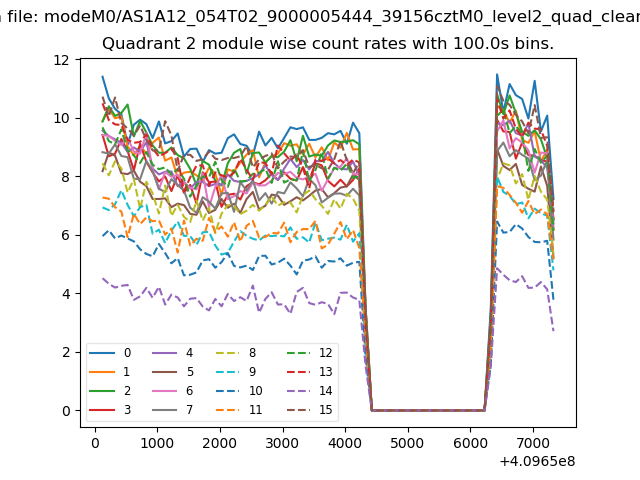
| Module-wise count rates for Quadrant B Data is divided into 100 sec bins |
 |
 |
| Module-wise count rates for Quadrant C Data is divided into 100 sec bins |
 |
 |
| Module-wise count rates for Quadrant D Data is divided into 100 sec bins |
 |
 |
| Parameter | Plot |
|---|---|
| CZT HV Monitor | 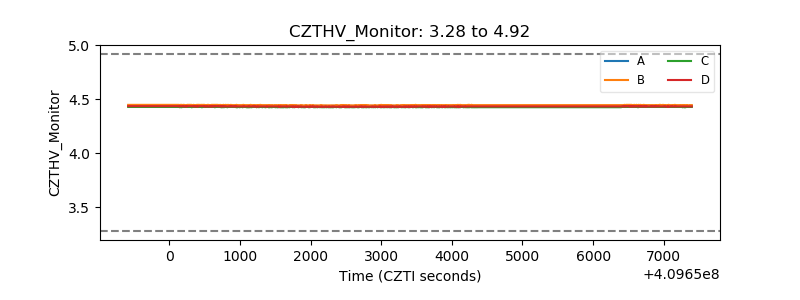 |
| D_VDD | 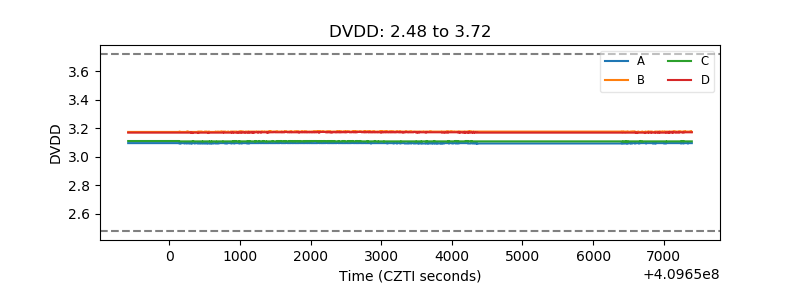 |
| Temperature 1 | 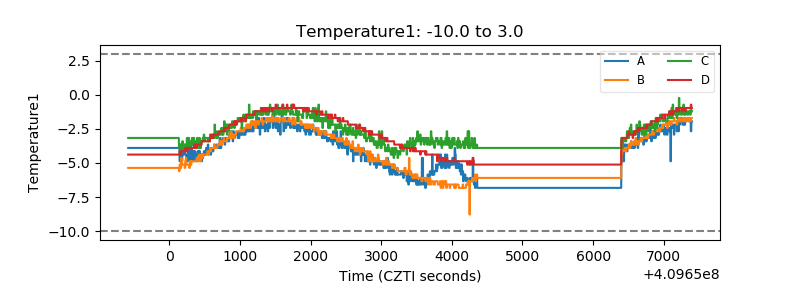 |
| Veto HV Monitor | 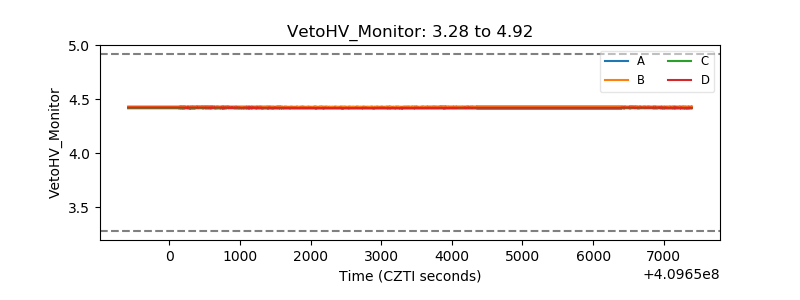 |
| Veto LLD | 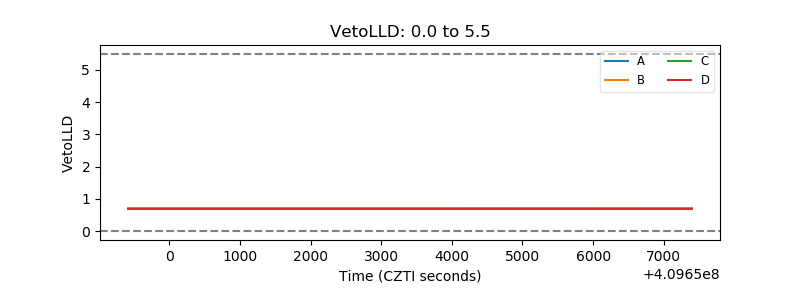 |
| Alpha Counter | 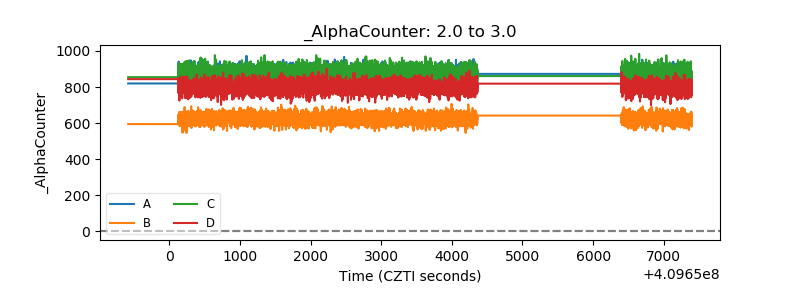 |
| _CPM_Rate | 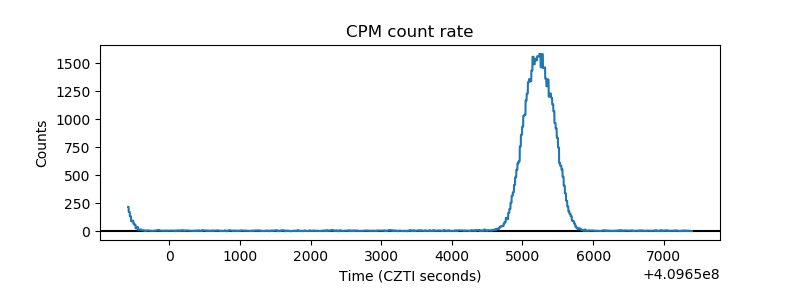 |
| CZT Counter | 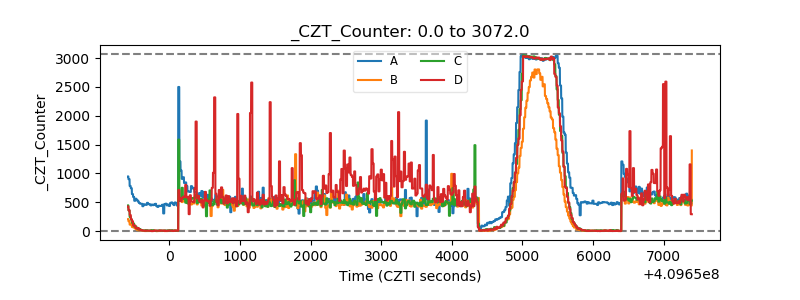 |
| +2.5 Volts monitor | 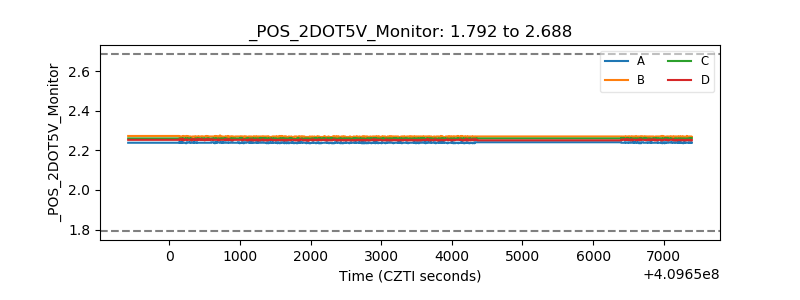 |
| +5 Volts monitor | 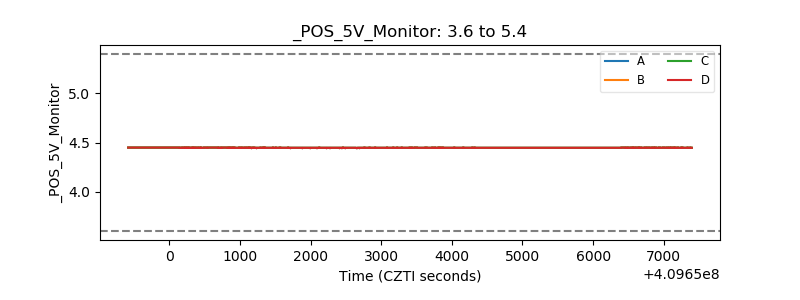 |
| _ROLL_ROT | 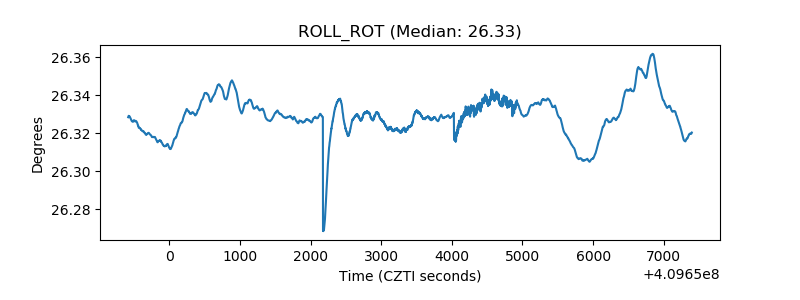 |
| _Roll_DEC |  |
| _Roll_RA | 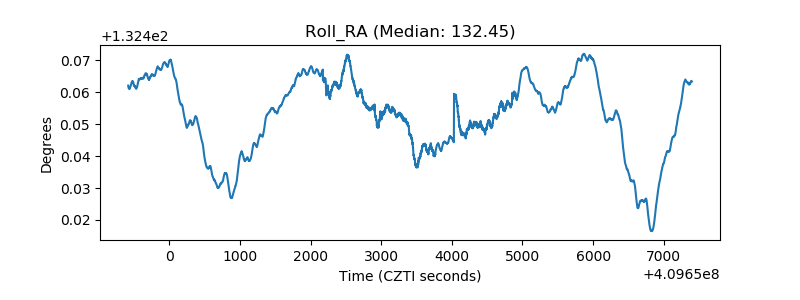 |
| Veto Counter | 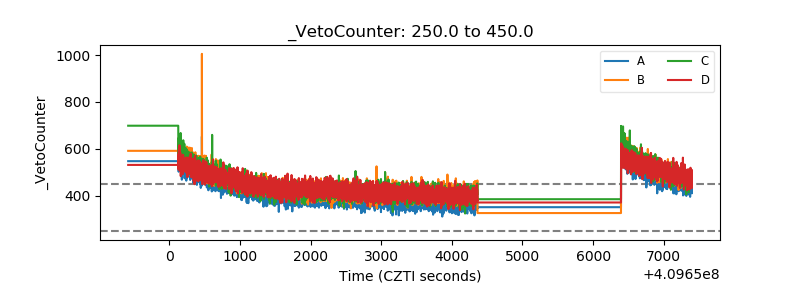 |