| Param | Original file | Final file |
|---|---|---|
| Filename | modeM0/AS1A12_054T02_9000005444_39157cztM0_level2.fits | modeM0/AS1A12_054T02_9000005444_39157cztM0_level2_quad_clean.evt |
| Size (bytes) | 357,557,760 | 96,612,480 |
| Size | 341.0 MB | 92.1 MB |
| Events in quadrant A | 2,922,276 | 686,948 |
| Events in quadrant B | 3,269,264 | 645,720 |
| Events in quadrant C | 2,637,617 | 641,289 |
| Events in quadrant D | 4,009,895 | 594,590 |
| Mode M9 | |||
|---|---|---|---|
| Quadrant | BADHDUFLAG | Total packets | Discarded packets |
| A | 0 | 27 | 0 |
| B | 0 | 27 | 0 |
| C | 0 | 27 | 0 |
| D | 0 | 28 | 0 |
| Mode M0 | |||
|---|---|---|---|
| Quadrant | BADHDUFLAG | Total packets | Discarded packets |
| A | 0 | 11727 | 3 |
| B | 0 | 12749 | 2 |
| C | 0 | 10575 | 2 |
| D | 0 | 15349 | 2 |
| Mode SS | |||
|---|---|---|---|
| Quadrant | BADHDUFLAG | Total packets | Discarded packets |
| A | 0 | 104 | 0 |
| B | 0 | 104 | 0 |
| C | 0 | 104 | 0 |
| D | 0 | 104 | 0 |
| Quadrant | Total seconds | Saturated seconds | Saturation percentage |
|---|---|---|---|
| A | 5095 | 16 | 0.314033% |
| B | 5095 | 327 | 6.418057% |
| C | 5095 | 6 | 0.117763% |
| D | 5095 | 149 | 2.924436% |
Noise dominated data is calculated using 1-second bins in cleaned event files. If a bin has >2000 counts, and if more than 50% of those come from <1% of pixels, then it is considered to be noise-dominated and hence unusable.
| Quadrant | # 1 sec bins | Bins with >0 counts | Bins with >2000 counts | High rate bins dominated by noise | Noise dominated (total time) | Noise dominated (detector-on time) | Marked lightcurve |
|---|---|---|---|---|---|---|---|
| A | 7218 | 5096 | 5 | 5 | 0.07% | 0.10% | 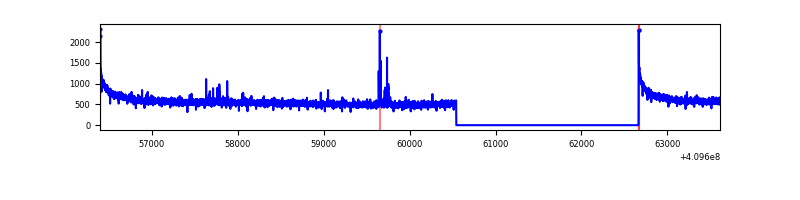 |
| B | 7218 | 5096 | 296 | 296 | 4.10% | 5.81% | 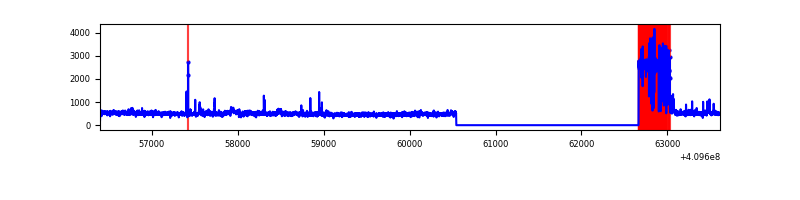 |
| C | 7218 | 5096 | 1 | 1 | 0.01% | 0.02% | 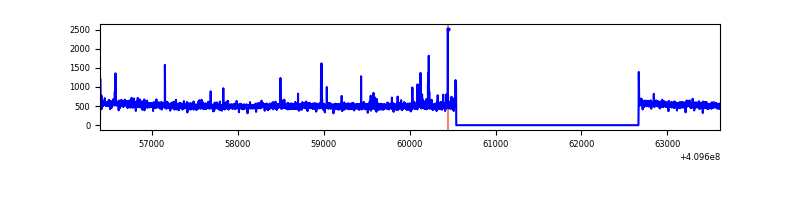 |
| D | 7218 | 5096 | 140 | 140 | 1.94% | 2.75% | 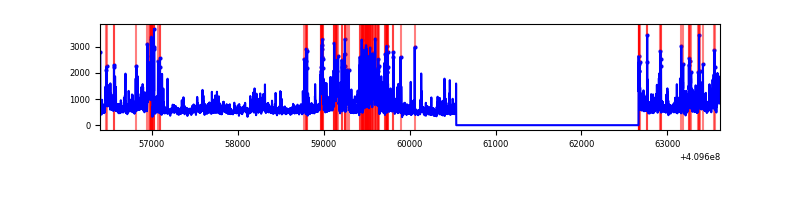 |
Top three noisy pixels from each quadrant. If the there are fewer than three noisy pixels in the level2.evt file, extra rows are filled as -1
| Pixel properties | Quadrant properties | ||||||
|---|---|---|---|---|---|---|---|
| Quadrant | DetID | PixID | Counts | Sigma | Mean | Median | Sigma |
| A | 10 | 83 | 430856 | 3410.39 | 630 | 619 | 126.2 |
| A | 15 | 174 | 22475 | 173.25 | 630 | 619 | 126.2 |
| A | 15 | 223 | 19399 | 148.86 | 630 | 619 | 126.2 |
| B | 5 | 184 | 854070 | 7567.05 | 593 | 579 | 112.8 |
| B | 5 | 172 | 43599 | 381.42 | 593 | 579 | 112.8 |
| B | 0 | 190 | 35744 | 311.77 | 593 | 579 | 112.8 |
| C | 15 | 214 | 215270 | 1543.08 | 604 | 609 | 139.1 |
| C | 9 | 187 | 54439 | 386.96 | 604 | 609 | 139.1 |
| C | 0 | 10 | 6510 | 42.42 | 604 | 609 | 139.1 |
| D | 5 | 222 | 777213 | 5277.49 | 607 | 593 | 147.2 |
| D | 12 | 235 | 625639 | 4247.48 | 607 | 593 | 147.2 |
| D | 2 | 249 | 151990 | 1028.81 | 607 | 593 | 147.2 |
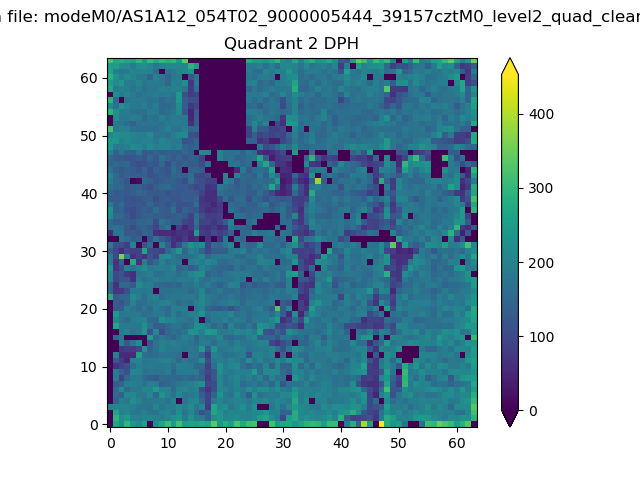
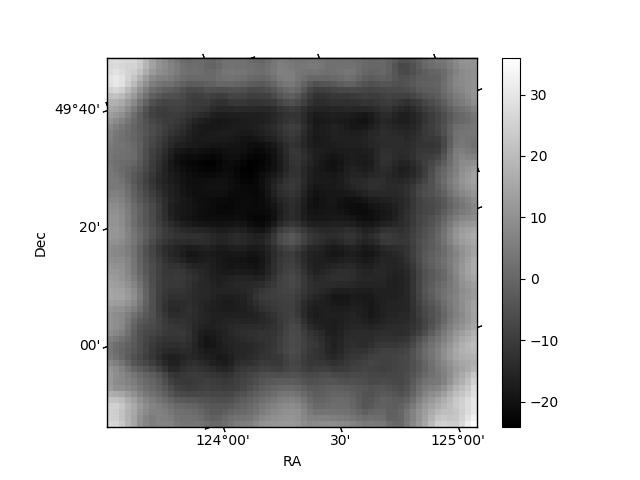
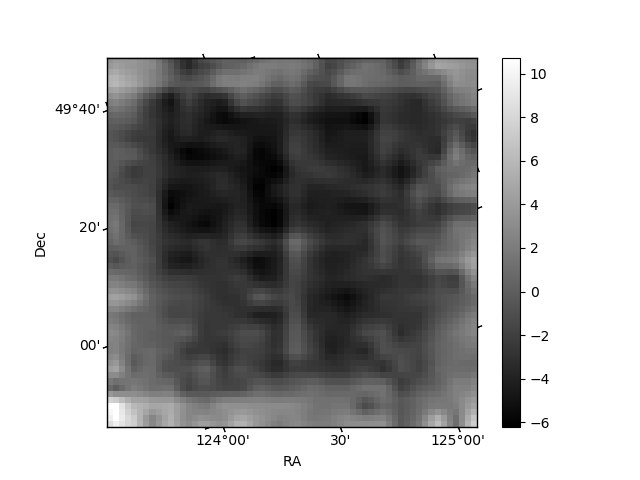
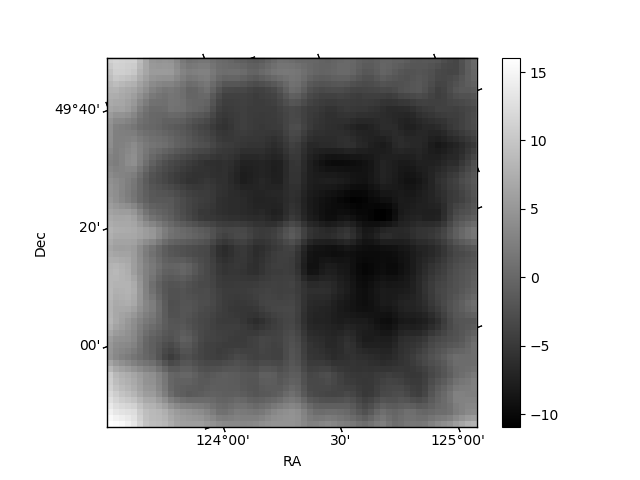
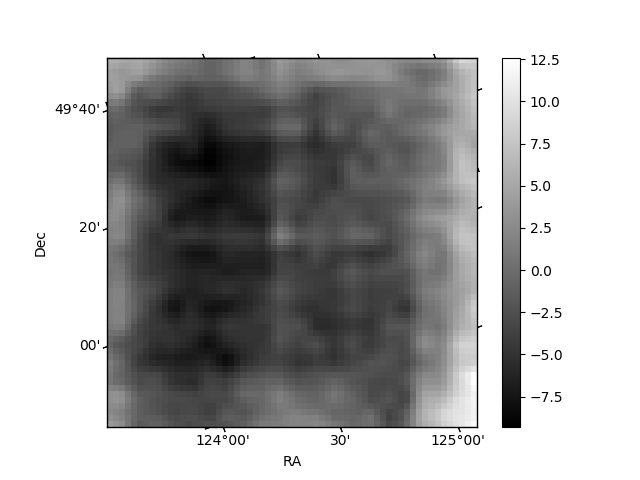
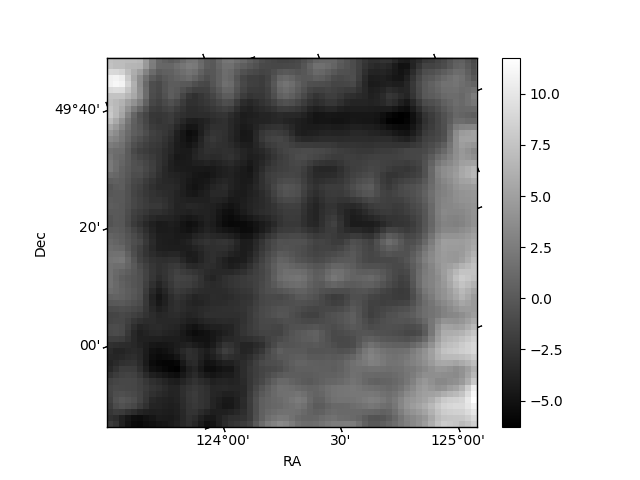
Histogram calculated using DETX and DETY for each event in the final _common_clean file
| Quadrant A | 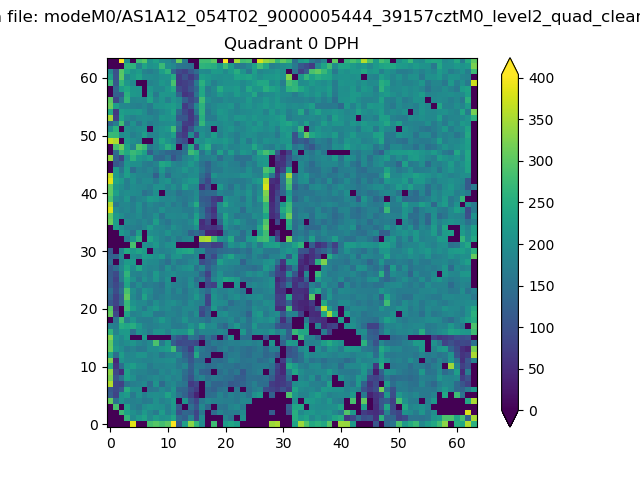 |
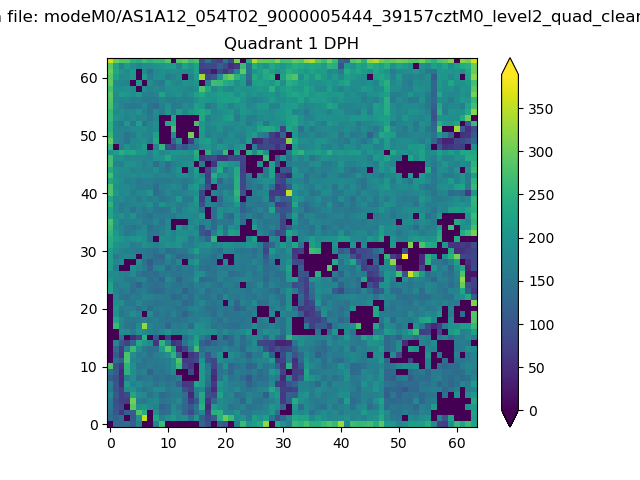 |
Quadrant B |
|---|---|---|---|
| Quadrant D | 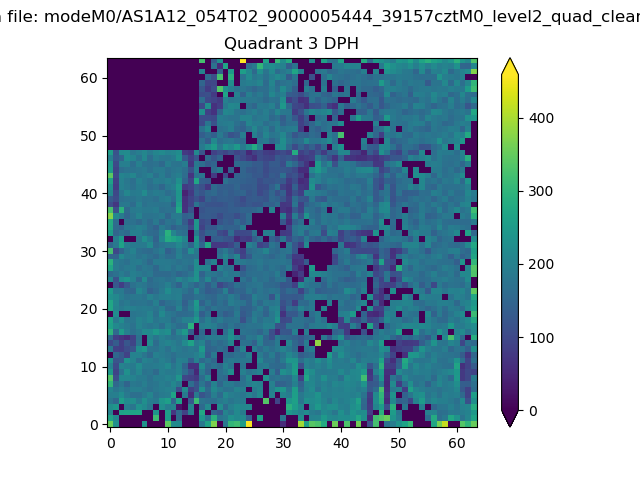 |
 |
Quadrant C |
| Plot type | Count rate plots | Images |
|---|---|---|
| Comparison with Poisson distribution Blue bars denote a histogram of data divided into 1 sec bins. Red curve is a Poisson curve with rate = median count rate of data. |
 |
 |
| Quadrant-wise count rates Data is divided into 100 sec bins |
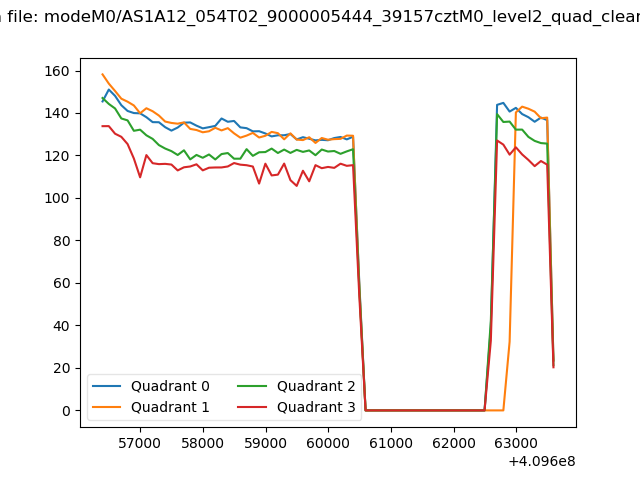 |
|
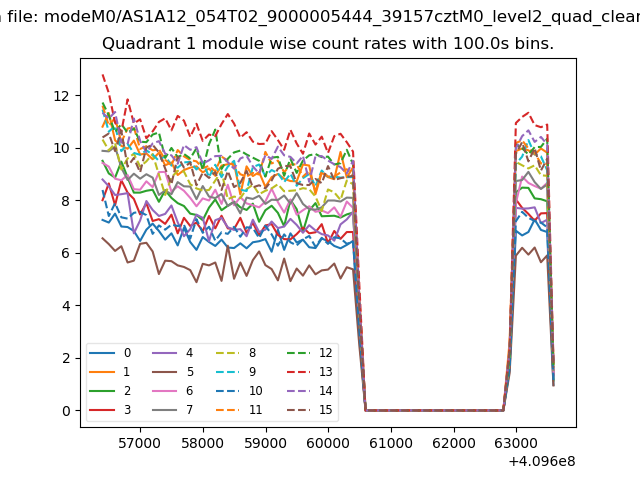
| Module-wise count rates for Quadrant A Data is divided into 100 sec bins |
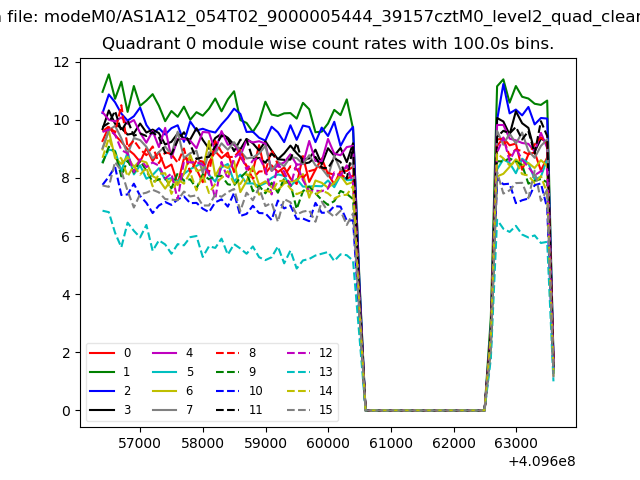 |
 |
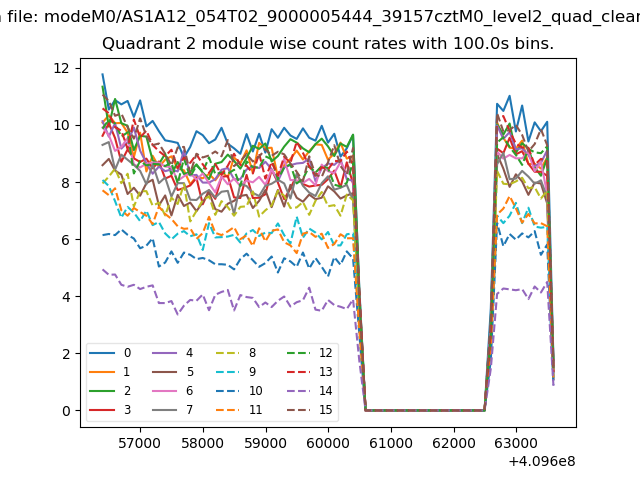
| Module-wise count rates for Quadrant B Data is divided into 100 sec bins |
 |
 |
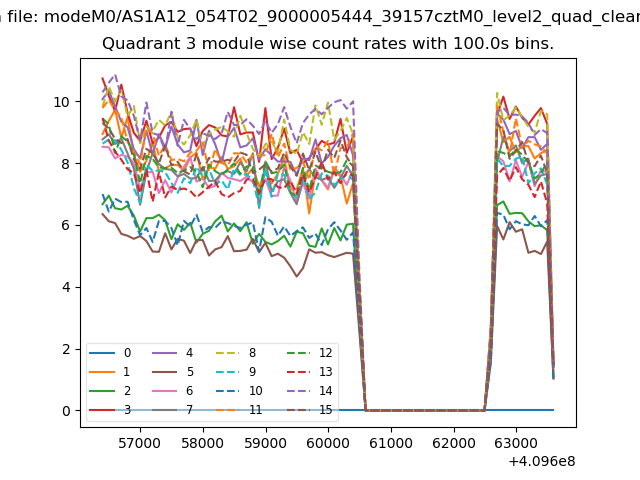
| Module-wise count rates for Quadrant C Data is divided into 100 sec bins |
 |
 |
| Module-wise count rates for Quadrant D Data is divided into 100 sec bins |
 |
 |
| Parameter | Plot |
|---|---|
| CZT HV Monitor | 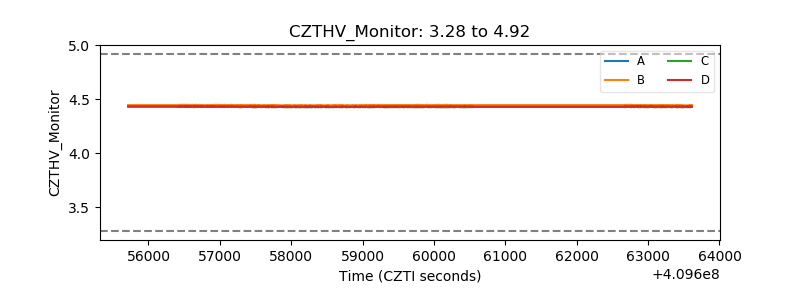 |
| D_VDD | 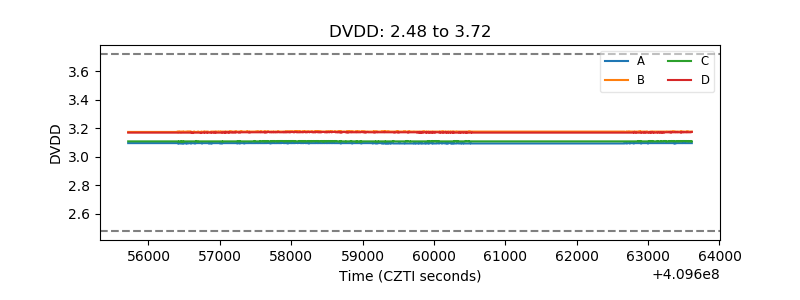 |
| Temperature 1 | 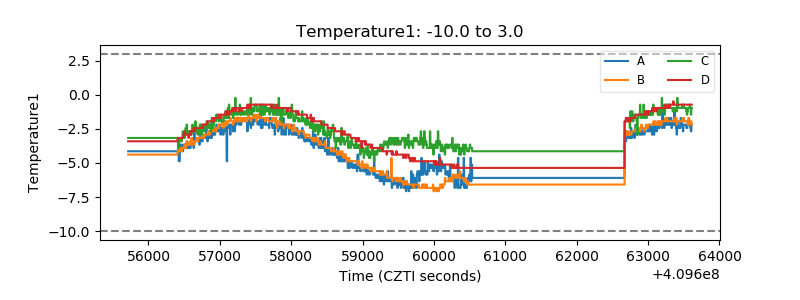 |
| Veto HV Monitor | 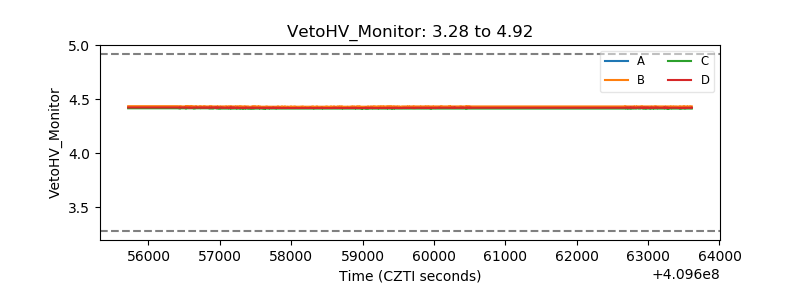 |
| Veto LLD | 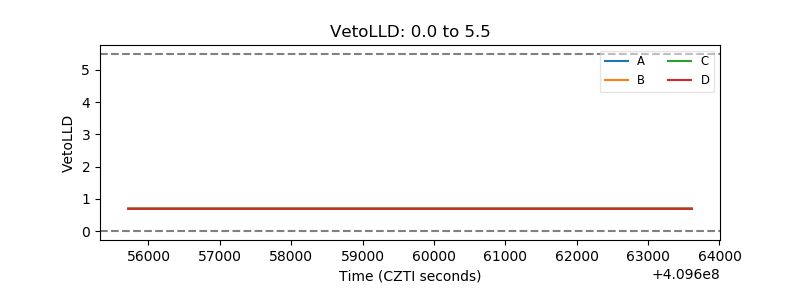 |
| Alpha Counter | 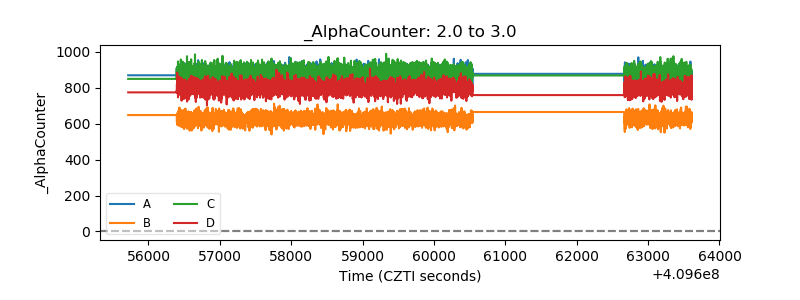 |
| _CPM_Rate | 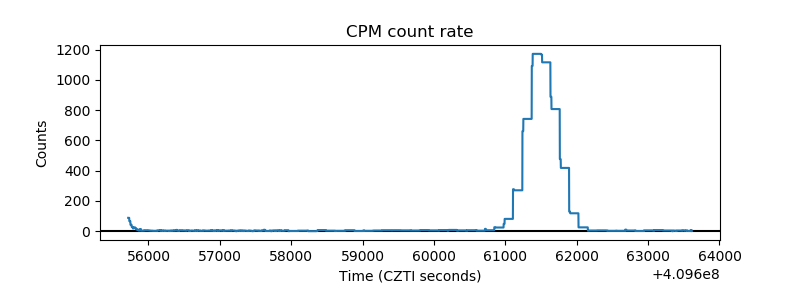 |
| CZT Counter | 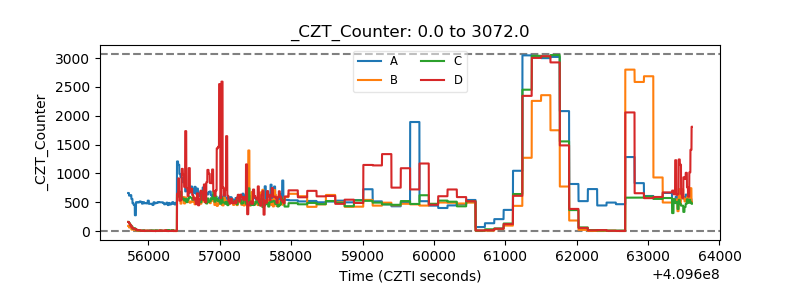 |
| +2.5 Volts monitor | 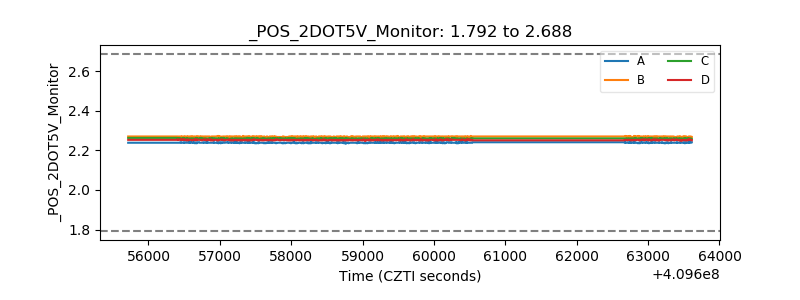 |
| +5 Volts monitor | 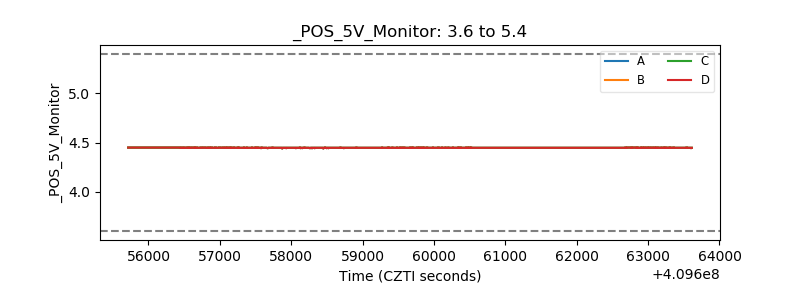 |
| _ROLL_ROT | 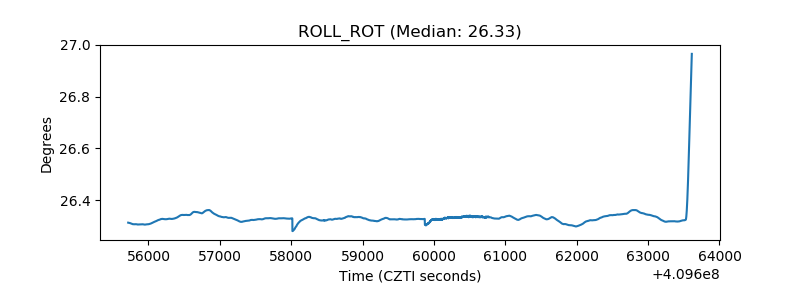 |
| _Roll_DEC | 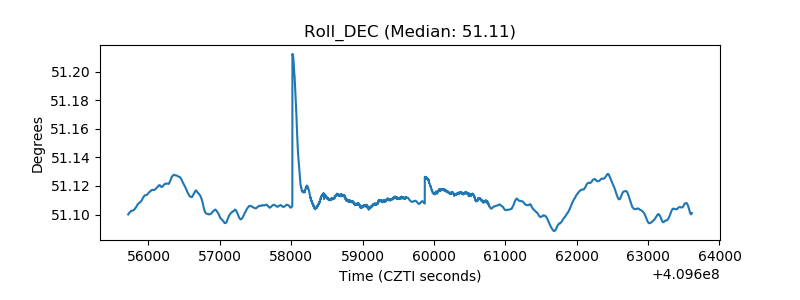 |
| _Roll_RA | 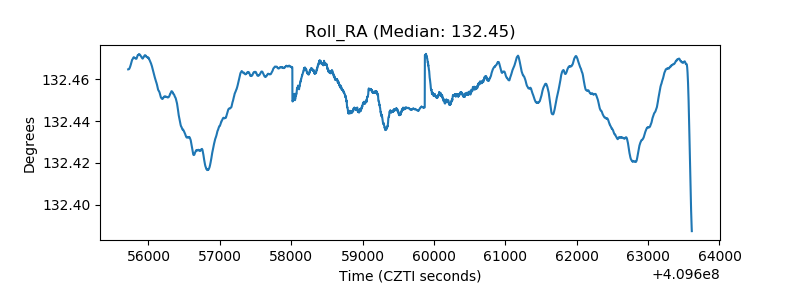 |
| Veto Counter | 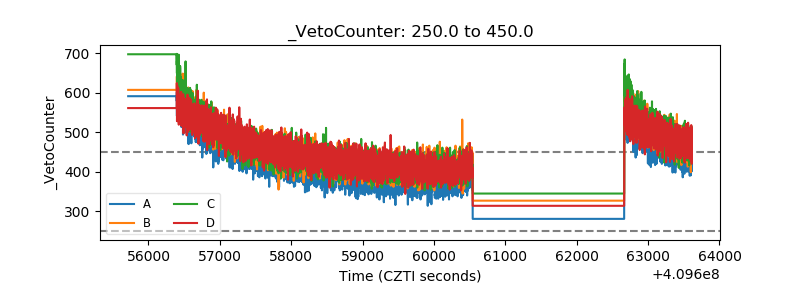 |