| Param | Original file | Final file |
|---|---|---|
| Filename | modeM0/AS1A12_054T02_9000005444_39158cztM0_level2.fits | modeM0/AS1A12_054T02_9000005444_39158cztM0_level2_quad_clean.evt |
| Size (bytes) | 389,856,960 | 93,216,960 |
| Size | 371.8 MB | 88.9 MB |
| Events in quadrant A | 2,872,944 | 669,217 |
| Events in quadrant B | 3,224,086 | 625,529 |
| Events in quadrant C | 2,741,238 | 620,621 |
| Events in quadrant D | 5,196,148 | 549,950 |
| Mode M9 | |||
|---|---|---|---|
| Quadrant | BADHDUFLAG | Total packets | Discarded packets |
| A | 0 | 26 | 0 |
| B | 0 | 26 | 0 |
| C | 0 | 26 | 0 |
| D | 0 | 27 | 0 |
| Mode M0 | |||
|---|---|---|---|
| Quadrant | BADHDUFLAG | Total packets | Discarded packets |
| A | 0 | 11635 | 3 |
| B | 0 | 12797 | 2 |
| C | 0 | 11007 | 2 |
| D | 0 | 18966 | 2 |
| Mode SS | |||
|---|---|---|---|
| Quadrant | BADHDUFLAG | Total packets | Discarded packets |
| A | 0 | 104 | 0 |
| B | 0 | 104 | 0 |
| C | 0 | 104 | 0 |
| D | 0 | 104 | 0 |
| Quadrant | Total seconds | Saturated seconds | Saturation percentage |
|---|---|---|---|
| A | 5101 | 15 | 0.294060% |
| B | 5101 | 335 | 6.567340% |
| C | 5101 | 62 | 1.215448% |
| D | 5101 | 500 | 9.802000% |
Noise dominated data is calculated using 1-second bins in cleaned event files. If a bin has >2000 counts, and if more than 50% of those come from <1% of pixels, then it is considered to be noise-dominated and hence unusable.
| Quadrant | # 1 sec bins | Bins with >0 counts | Bins with >2000 counts | High rate bins dominated by noise | Noise dominated (total time) | Noise dominated (detector-on time) | Marked lightcurve |
|---|---|---|---|---|---|---|---|
| A | 7253 | 5102 | 4 | 4 | 0.06% | 0.08% | 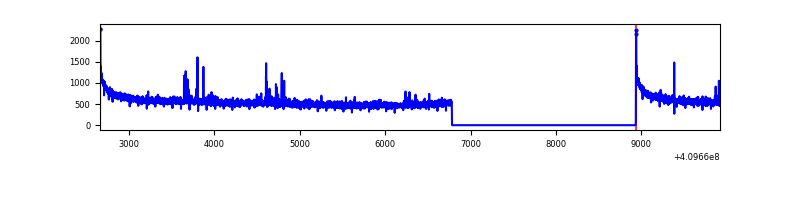 |
| B | 7253 | 5102 | 303 | 303 | 4.18% | 5.94% | 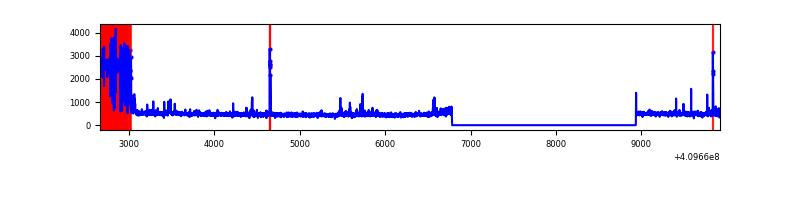 |
| C | 7253 | 5102 | 48 | 48 | 0.66% | 0.94% | 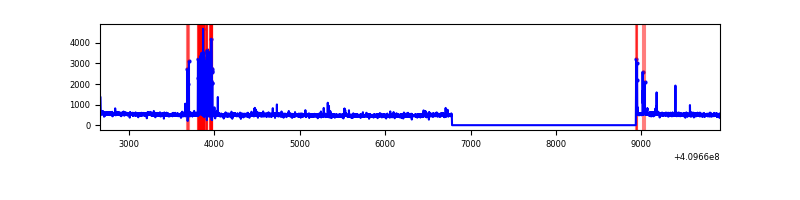 |
| D | 7253 | 5102 | 454 | 454 | 6.26% | 8.90% | 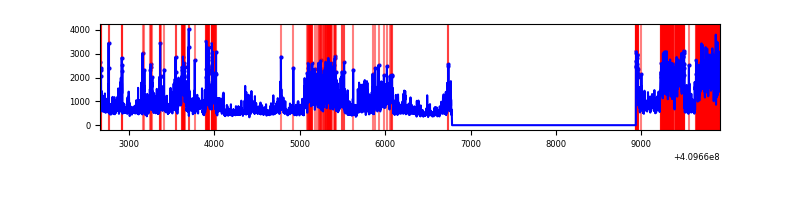 |
Top three noisy pixels from each quadrant. If the there are fewer than three noisy pixels in the level2.evt file, extra rows are filled as -1
| Pixel properties | Quadrant properties | ||||||
|---|---|---|---|---|---|---|---|
| Quadrant | DetID | PixID | Counts | Sigma | Mean | Median | Sigma |
| A | 10 | 83 | 430376 | 3462.77 | 614 | 603 | 124.1 |
| A | 13 | 248 | 44261 | 351.76 | 614 | 603 | 124.1 |
| A | 15 | 223 | 18386 | 143.28 | 614 | 603 | 124.1 |
| B | 5 | 184 | 858928 | 7765.77 | 578 | 562 | 110.5 |
| B | 5 | 172 | 44640 | 398.78 | 578 | 562 | 110.5 |
| B | 0 | 190 | 26055 | 230.64 | 578 | 562 | 110.5 |
| C | 15 | 214 | 214001 | 1566.4 | 590 | 594 | 136.2 |
| C | 9 | 187 | 211606 | 1548.82 | 590 | 594 | 136.2 |
| C | 0 | 10 | 8245 | 56.16 | 590 | 594 | 136.2 |
| D | 12 | 235 | 2304600 | 16268.13 | 582 | 564 | 141.6 |
| D | 5 | 222 | 247815 | 1745.76 | 582 | 564 | 141.6 |
| D | 2 | 249 | 207935 | 1464.18 | 582 | 564 | 141.6 |
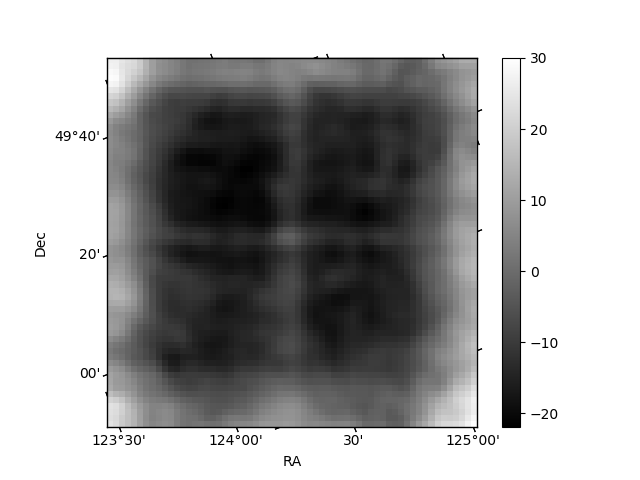
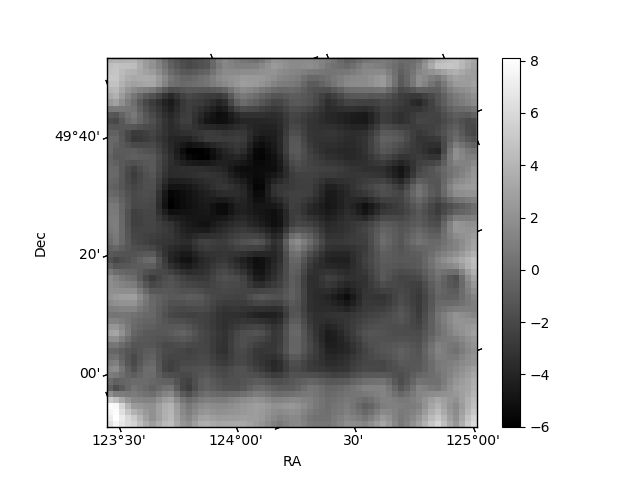
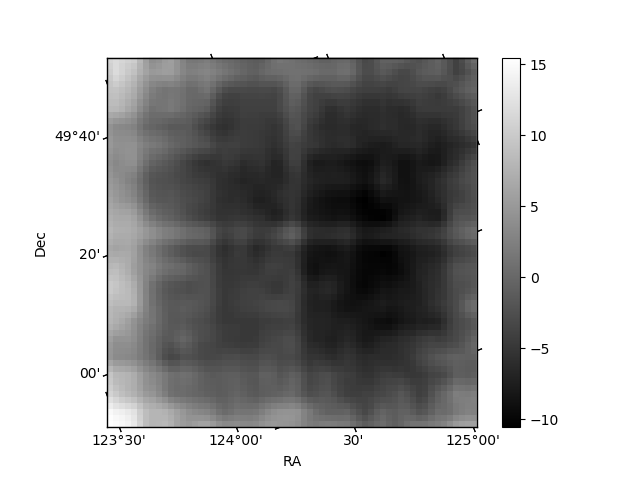
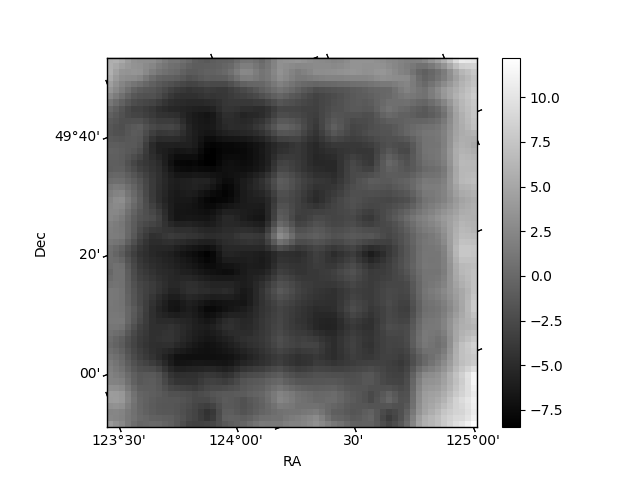
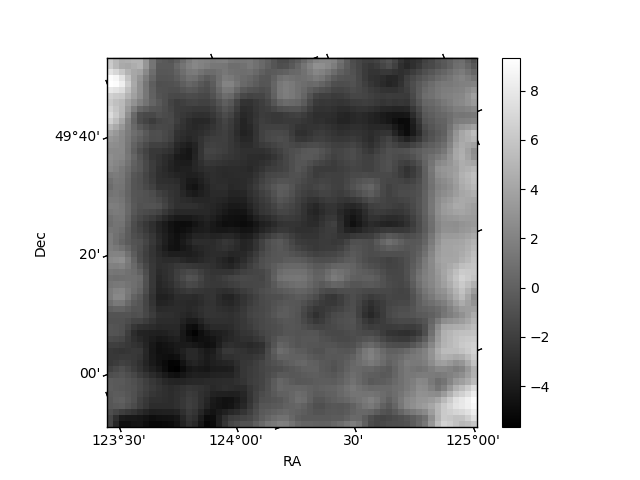
Histogram calculated using DETX and DETY for each event in the final _common_clean file
| Quadrant A | 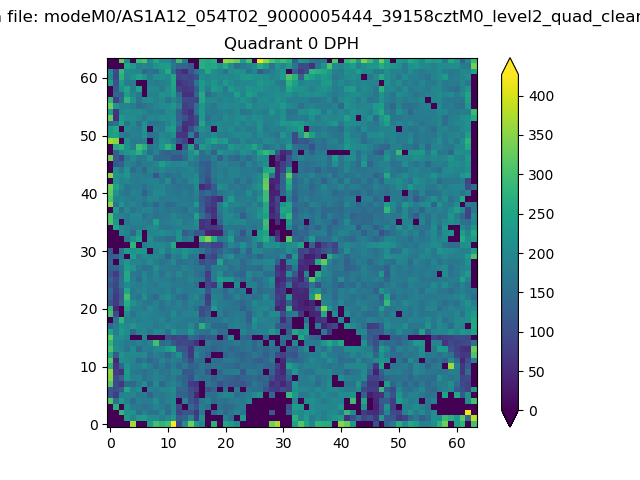 |
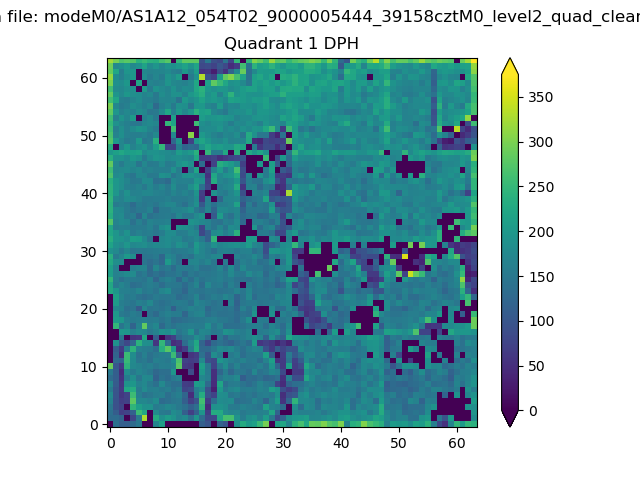 |
Quadrant B |
|---|---|---|---|
| Quadrant D | 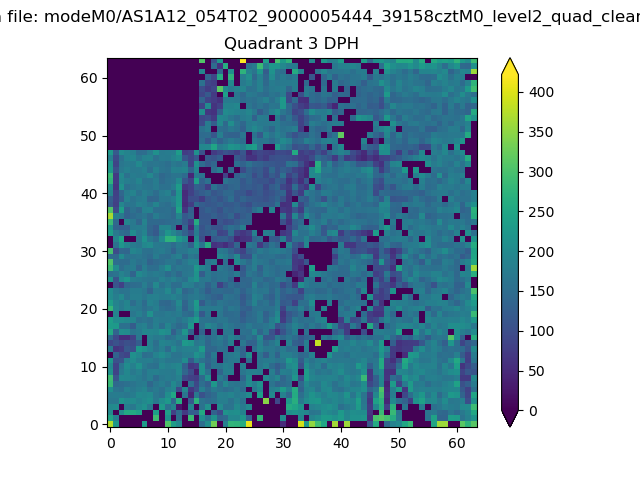 |
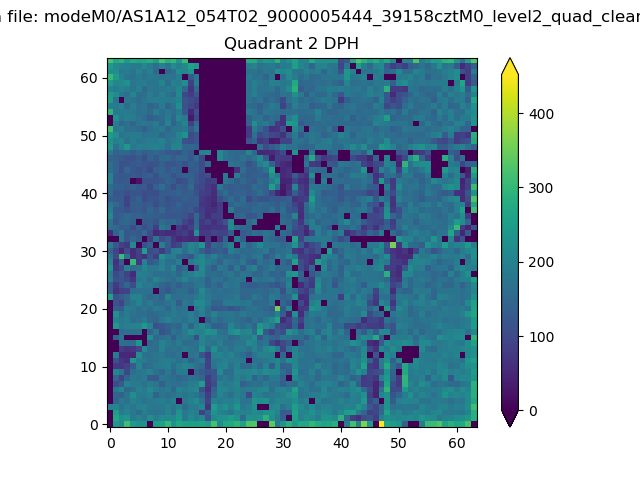 |
Quadrant C |
| Plot type | Count rate plots | Images |
|---|---|---|
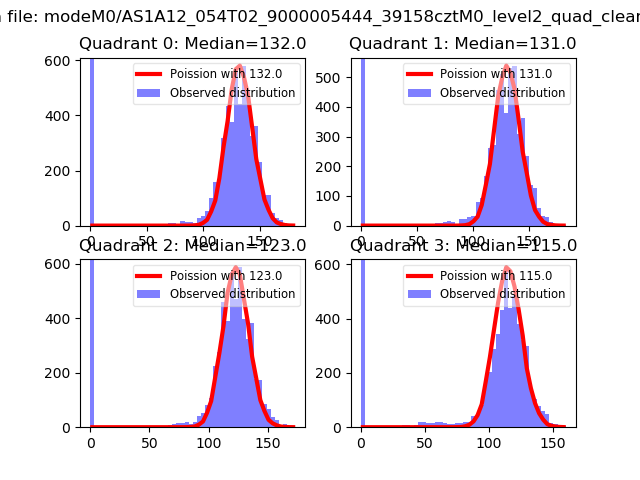
| Comparison with Poisson distribution Blue bars denote a histogram of data divided into 1 sec bins. Red curve is a Poisson curve with rate = median count rate of data. |
 |
 |
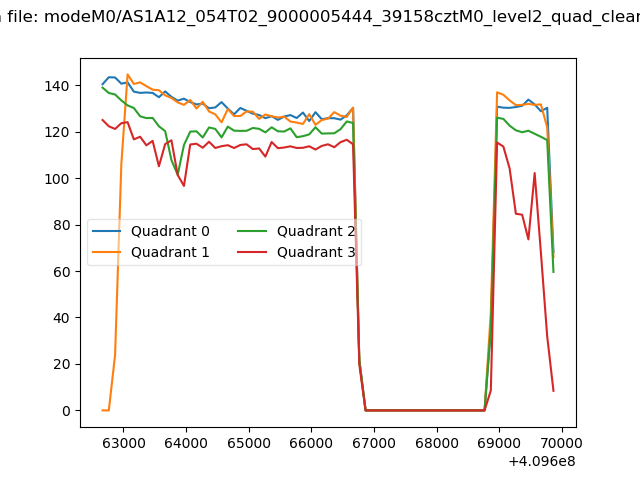
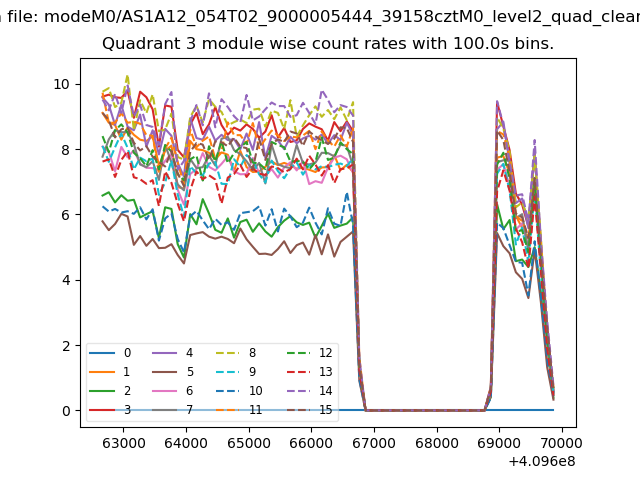
| Quadrant-wise count rates Data is divided into 100 sec bins |
 |
|
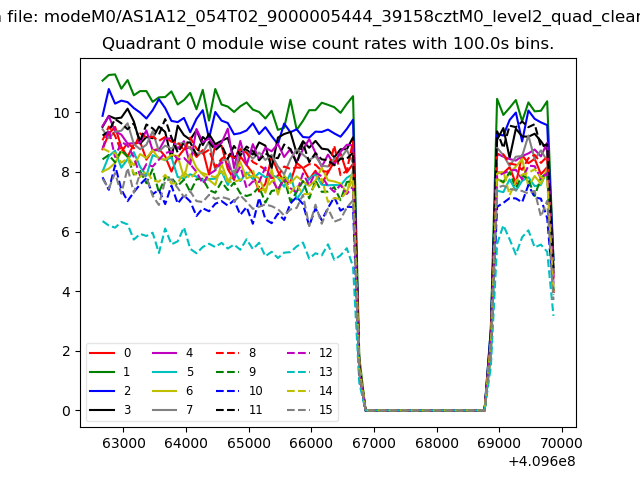
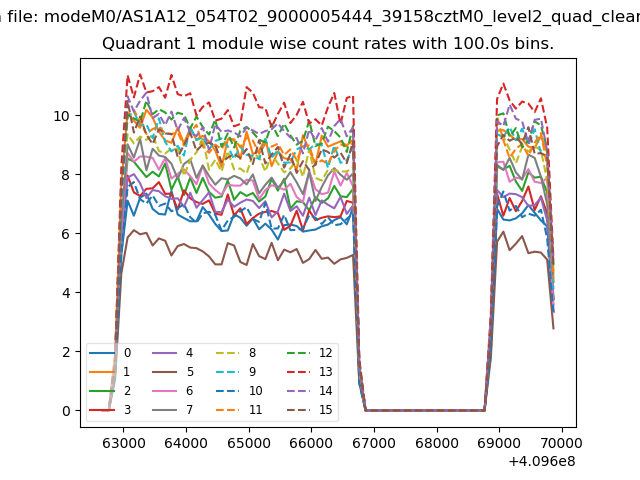
| Module-wise count rates for Quadrant A Data is divided into 100 sec bins |
 |
 |
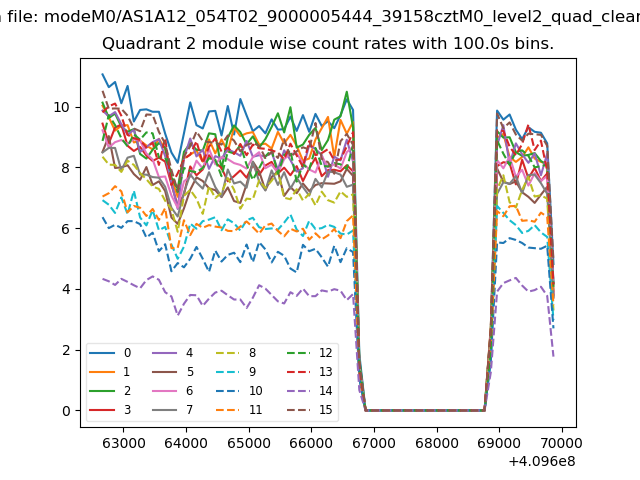
| Module-wise count rates for Quadrant B Data is divided into 100 sec bins |
 |
 |
| Module-wise count rates for Quadrant C Data is divided into 100 sec bins |
 |
 |
| Module-wise count rates for Quadrant D Data is divided into 100 sec bins |
 |
 |
| Parameter | Plot |
|---|---|
| CZT HV Monitor | 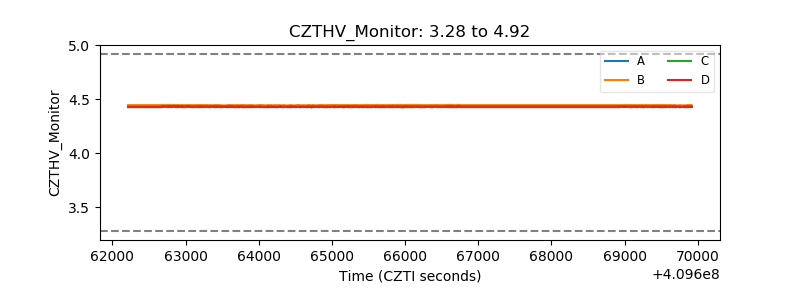 |
| D_VDD | 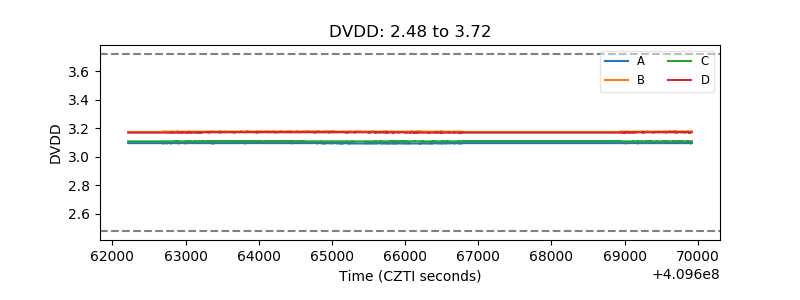 |
| Temperature 1 | 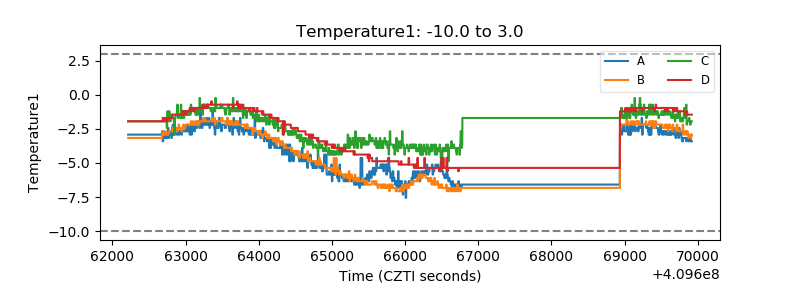 |
| Veto HV Monitor | 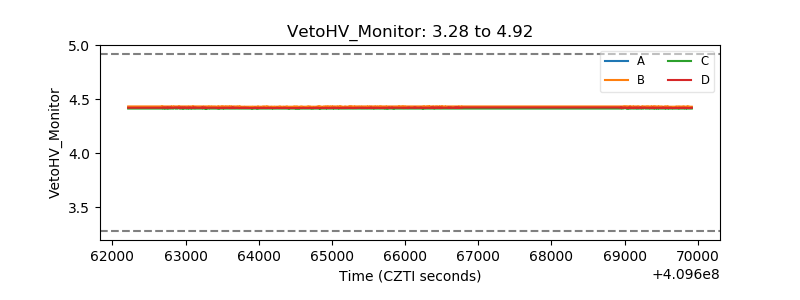 |
| Veto LLD | 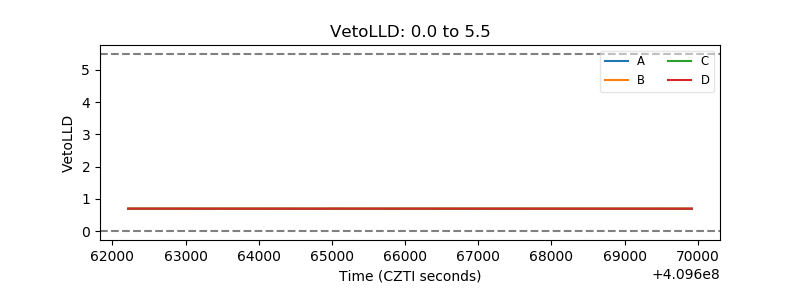 |
| Alpha Counter | 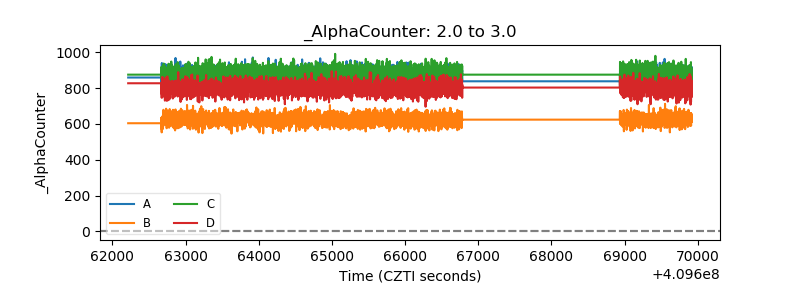 |
| _CPM_Rate | 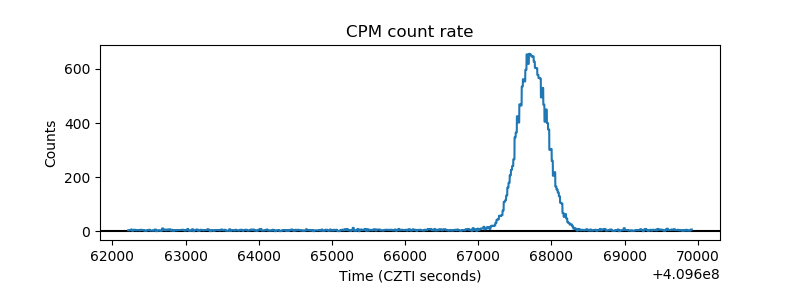 |
| CZT Counter | 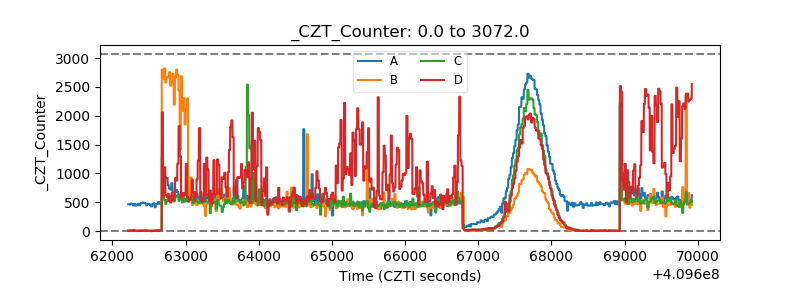 |
| +2.5 Volts monitor |  |
| +5 Volts monitor | 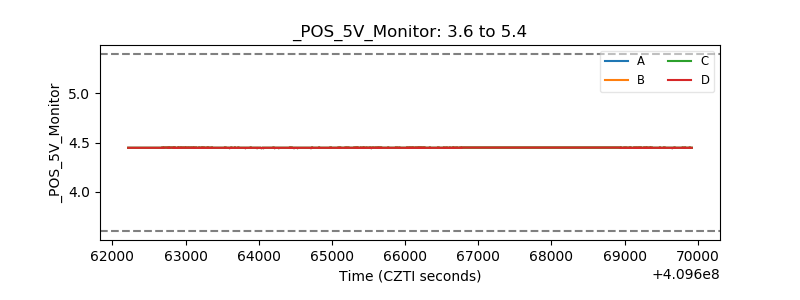 |
| _ROLL_ROT | 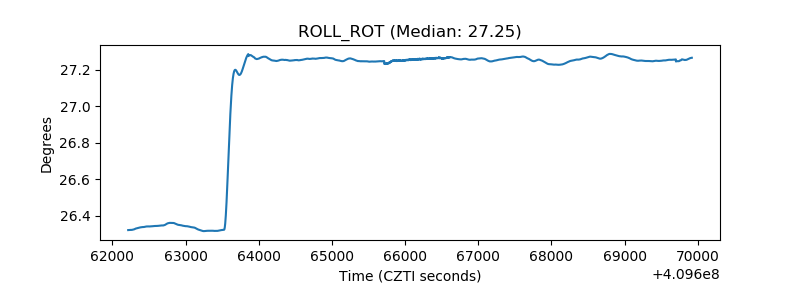 |
| _Roll_DEC | 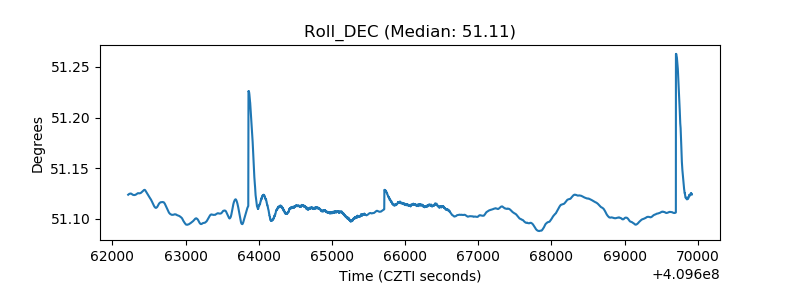 |
| _Roll_RA |  |
| Veto Counter | 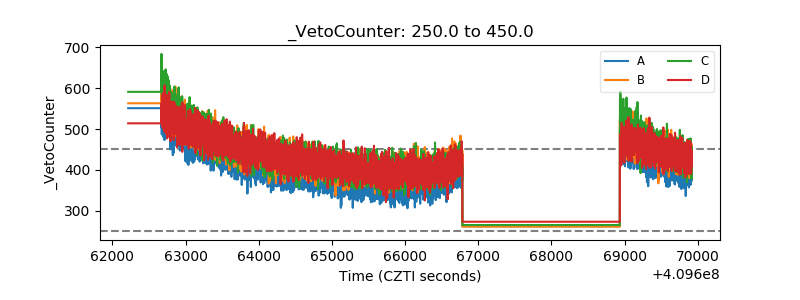 |