| Param | Original file | Final file |
|---|---|---|
| Filename | modeM0/AS1A12_054T02_9000005444_39159cztM0_level2.fits | modeM0/AS1A12_054T02_9000005444_39159cztM0_level2_quad_clean.evt |
| Size (bytes) | 455,103,360 | 86,077,440 |
| Size | 434.0 MB | 82.1 MB |
| Events in quadrant A | 2,837,947 | 635,234 |
| Events in quadrant B | 2,363,496 | 635,126 |
| Events in quadrant C | 2,527,332 | 595,824 |
| Events in quadrant D | 8,720,563 | 382,949 |
| Mode M9 | |||
|---|---|---|---|
| Quadrant | BADHDUFLAG | Total packets | Discarded packets |
| A | 0 | 34 | 0 |
| B | 0 | 34 | 0 |
| C | 0 | 34 | 0 |
| D | 0 | 35 | 0 |
| Mode M0 | |||
|---|---|---|---|
| Quadrant | BADHDUFLAG | Total packets | Discarded packets |
| A | 0 | 11652 | 3 |
| B | 0 | 10434 | 2 |
| C | 0 | 10535 | 2 |
| D | 0 | 29453 | 2 |
| Mode SS | |||
|---|---|---|---|
| Quadrant | BADHDUFLAG | Total packets | Discarded packets |
| A | 0 | 102 | 0 |
| B | 0 | 102 | 0 |
| C | 0 | 102 | 0 |
| D | 0 | 102 | 0 |
| Quadrant | Total seconds | Saturated seconds | Saturation percentage |
|---|---|---|---|
| A | 5104 | 17 | 0.333072% |
| B | 5104 | 14 | 0.274295% |
| C | 5104 | 13 | 0.254702% |
| D | 5104 | 1998 | 39.145768% |
Noise dominated data is calculated using 1-second bins in cleaned event files. If a bin has >2000 counts, and if more than 50% of those come from <1% of pixels, then it is considered to be noise-dominated and hence unusable.
| Quadrant | # 1 sec bins | Bins with >0 counts | Bins with >2000 counts | High rate bins dominated by noise | Noise dominated (total time) | Noise dominated (detector-on time) | Marked lightcurve |
|---|---|---|---|---|---|---|---|
| A | 7166 | 5105 | 5 | 5 | 0.07% | 0.10% | 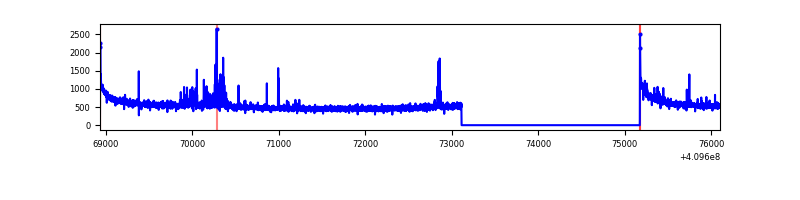 |
| B | 7166 | 5105 | 7 | 7 | 0.10% | 0.14% | 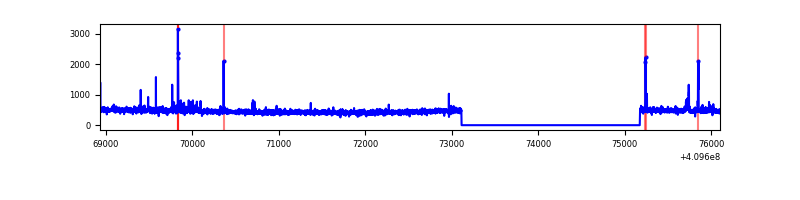 |
| C | 7166 | 5105 | 6 | 6 | 0.08% | 0.12% | 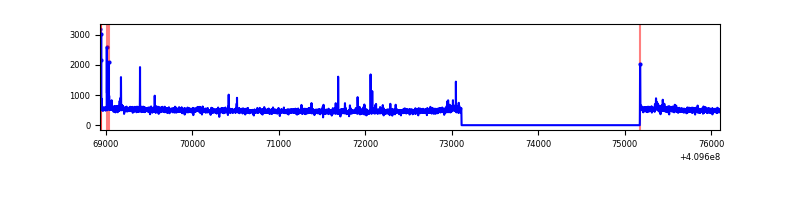 |
| D | 7166 | 5105 | 1857 | 1857 | 25.91% | 36.38% | 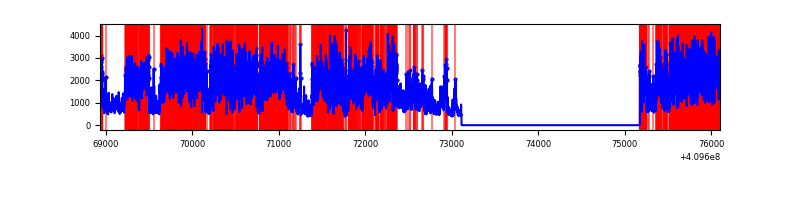 |
Top three noisy pixels from each quadrant. If the there are fewer than three noisy pixels in the level2.evt file, extra rows are filled as -1
| Pixel properties | Quadrant properties | ||||||
|---|---|---|---|---|---|---|---|
| Quadrant | DetID | PixID | Counts | Sigma | Mean | Median | Sigma |
| A | 10 | 83 | 429506 | 3573.64 | 588 | 576 | 120.0 |
| A | 13 | 248 | 87657 | 725.52 | 588 | 576 | 120.0 |
| A | 15 | 223 | 20945 | 169.7 | 588 | 576 | 120.0 |
| B | 5 | 172 | 42167 | 374.5 | 582 | 566 | 111.1 |
| B | 15 | 85 | 25839 | 227.51 | 582 | 566 | 111.1 |
| B | 12 | 111 | 13215 | 113.87 | 582 | 566 | 111.1 |
| C | 15 | 214 | 214367 | 1611.61 | 572 | 574 | 132.7 |
| C | 9 | 187 | 54889 | 409.44 | 572 | 574 | 132.7 |
| C | 14 | 254 | 11608 | 83.18 | 572 | 574 | 132.7 |
| D | 12 | 235 | 5891835 | 48040.16 | 506 | 491 | 122.6 |
| D | 2 | 249 | 615063 | 5011.44 | 506 | 491 | 122.6 |
| D | 2 | 120 | 66546 | 538.64 | 506 | 491 | 122.6 |
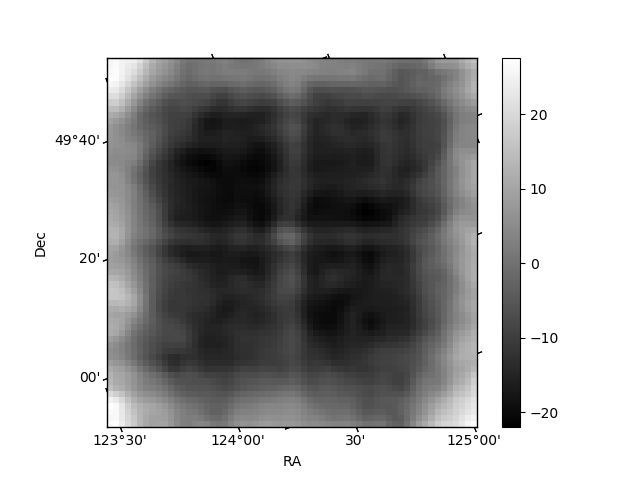
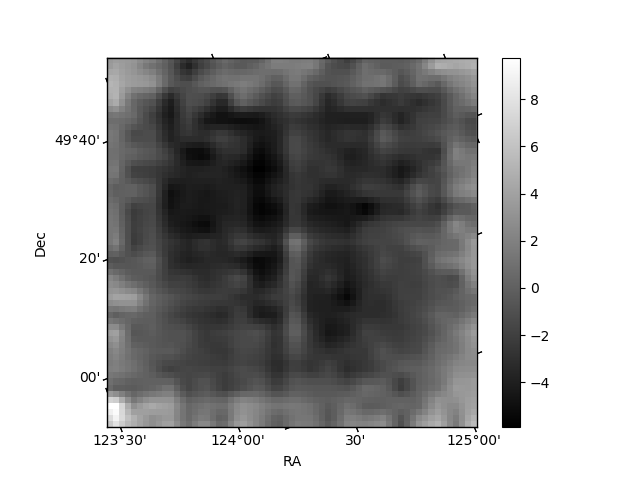
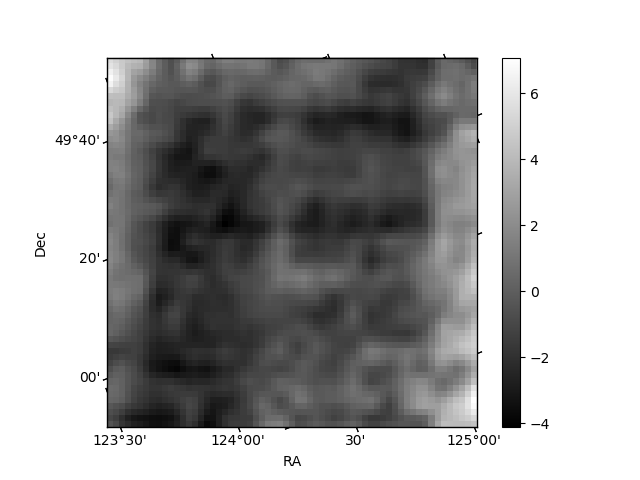
Histogram calculated using DETX and DETY for each event in the final _common_clean file
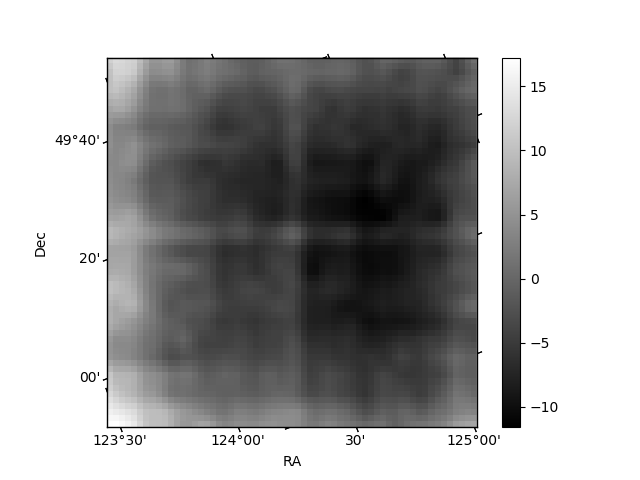
| Quadrant A | 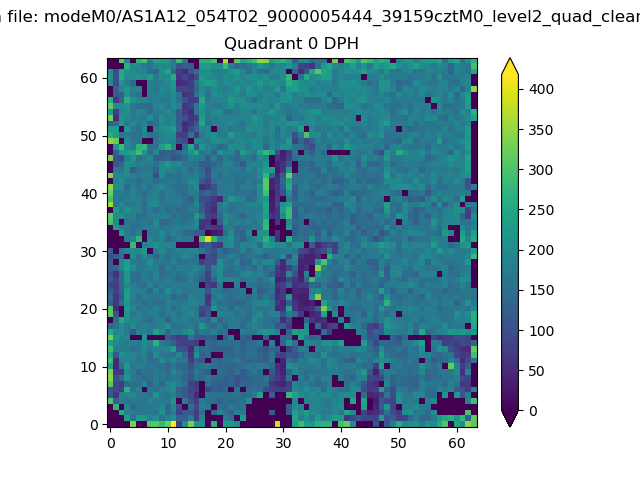 |
 |
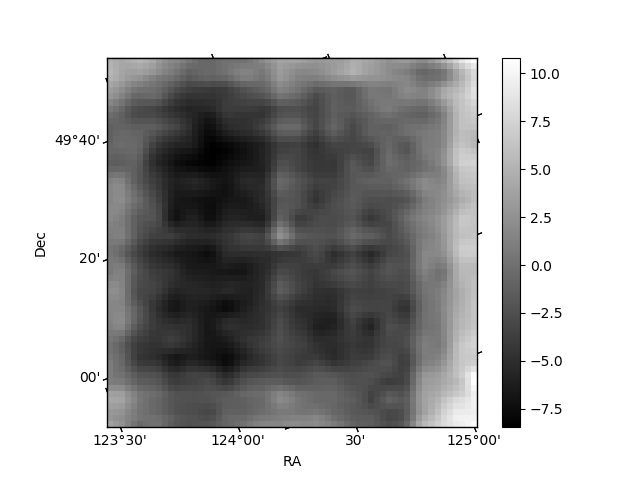
Quadrant B |
|---|---|---|---|
| Quadrant D | 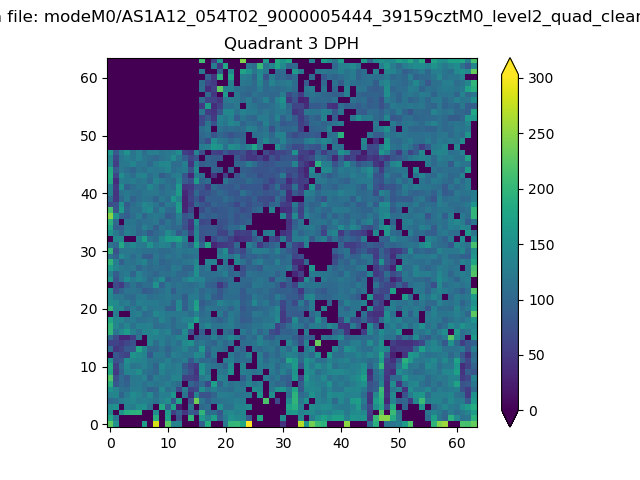 |
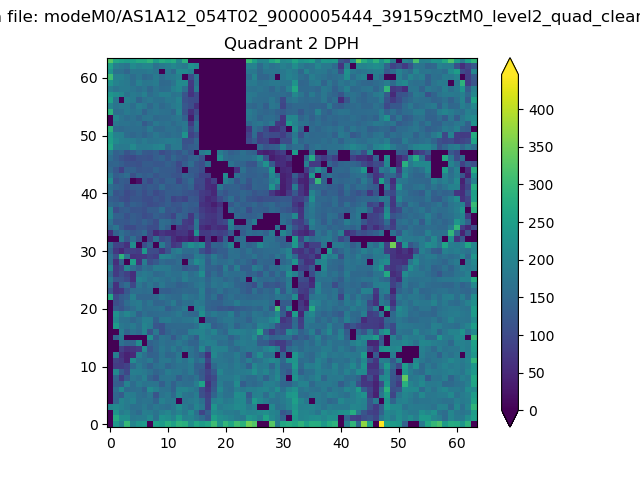 |
Quadrant C |
| Plot type | Count rate plots | Images |
|---|---|---|
| Comparison with Poisson distribution Blue bars denote a histogram of data divided into 1 sec bins. Red curve is a Poisson curve with rate = median count rate of data. |
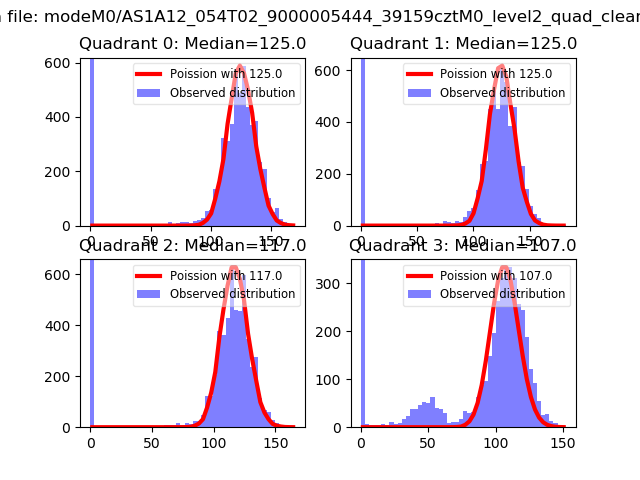 |
 |
| Quadrant-wise count rates Data is divided into 100 sec bins |
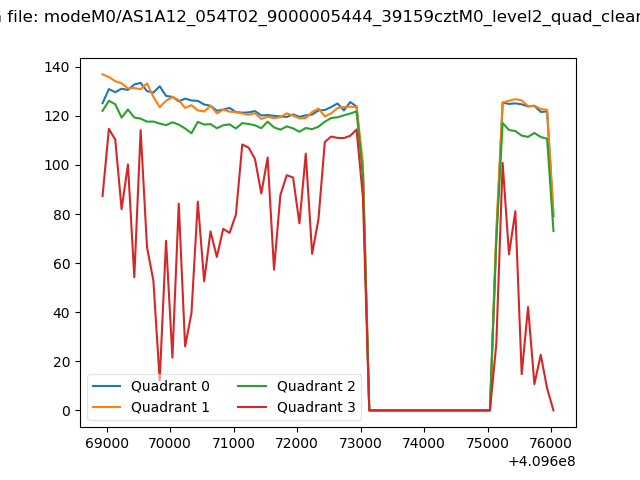 |
|
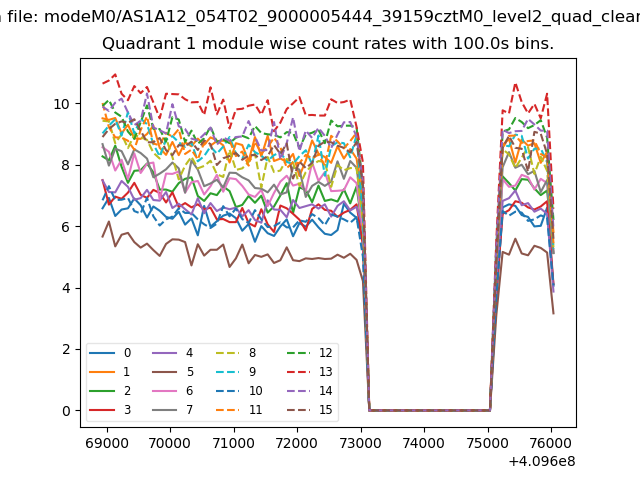
| Module-wise count rates for Quadrant A Data is divided into 100 sec bins |
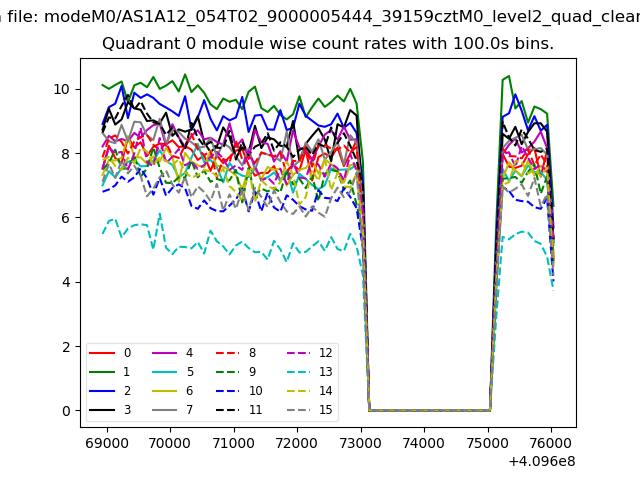 |
 |
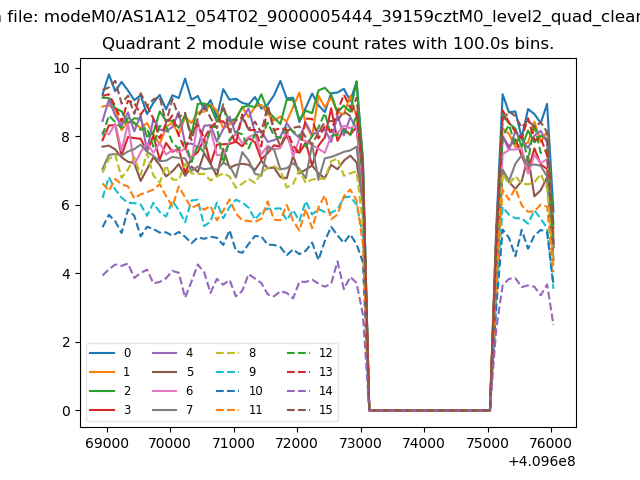
| Module-wise count rates for Quadrant B Data is divided into 100 sec bins |
 |
 |
| Module-wise count rates for Quadrant C Data is divided into 100 sec bins |
 |
 |
| Module-wise count rates for Quadrant D Data is divided into 100 sec bins |
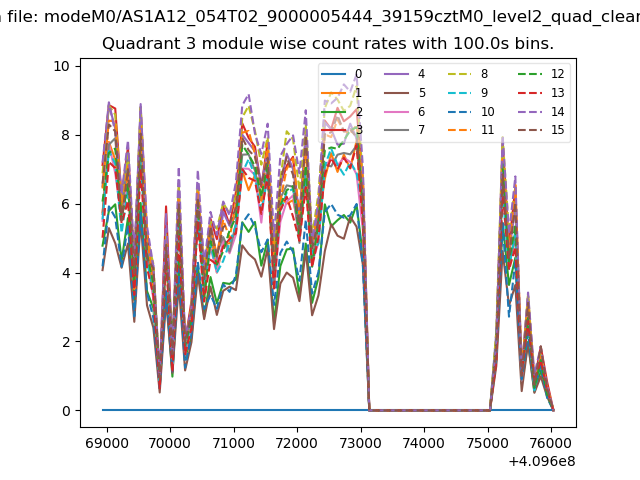 |
 |
| Parameter | Plot |
|---|---|
| CZT HV Monitor | 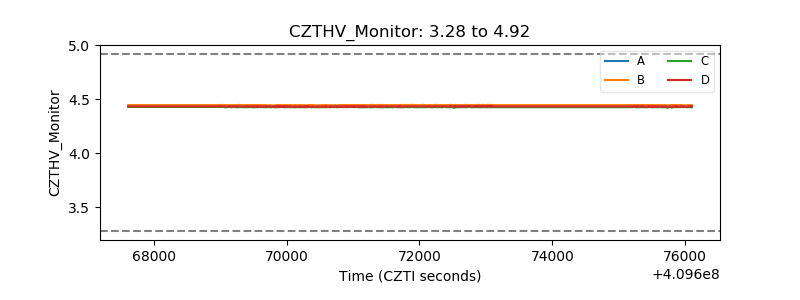 |
| D_VDD | 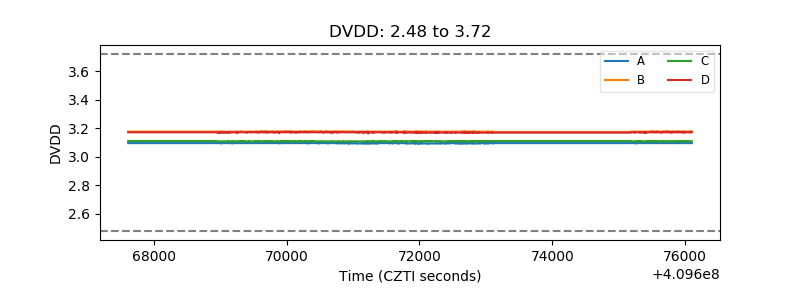 |
| Temperature 1 | 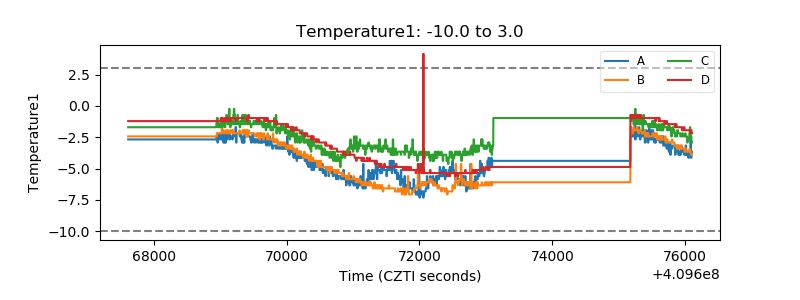 |
| Veto HV Monitor | 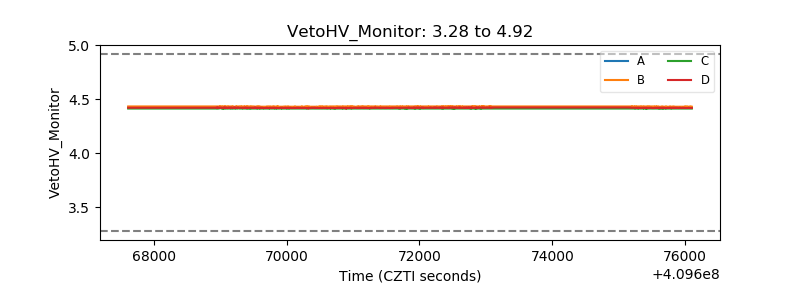 |
| Veto LLD | 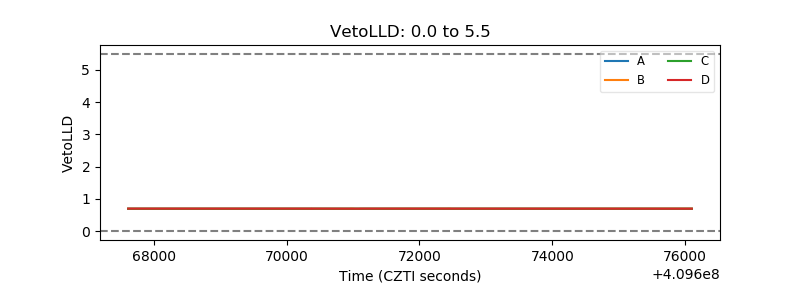 |
| Alpha Counter | 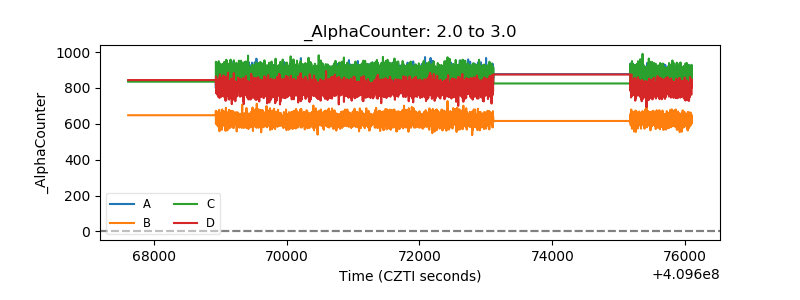 |
| _CPM_Rate | 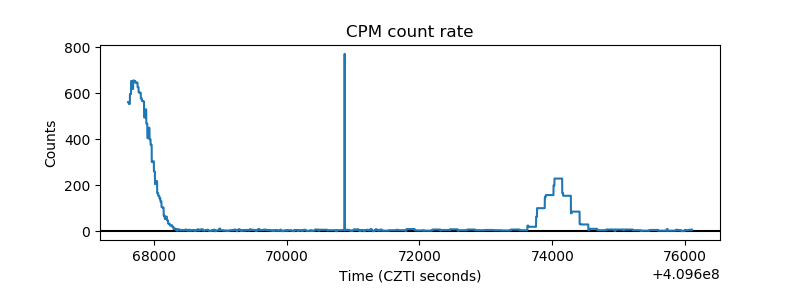 |
| CZT Counter |  |
| +2.5 Volts monitor | 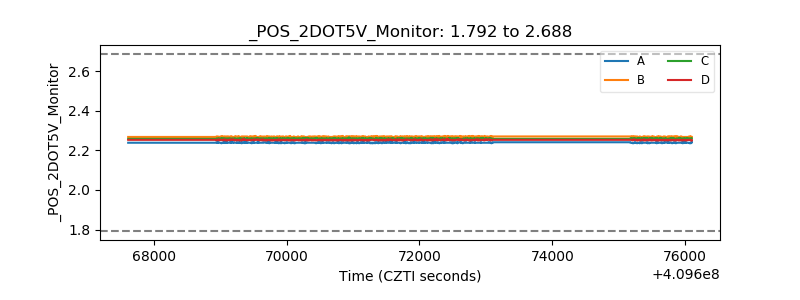 |
| +5 Volts monitor | 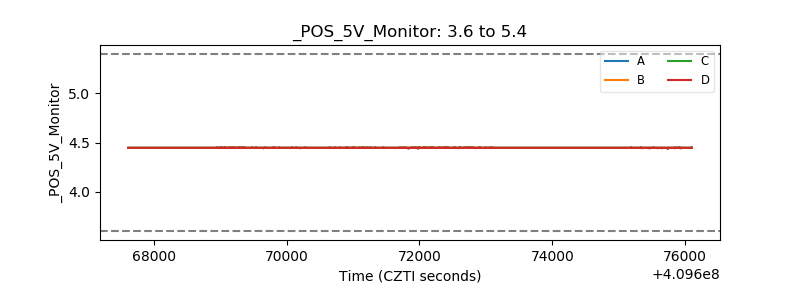 |
| _ROLL_ROT | 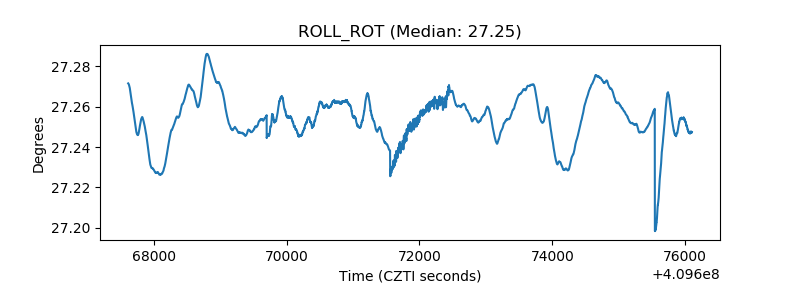 |
| _Roll_DEC | 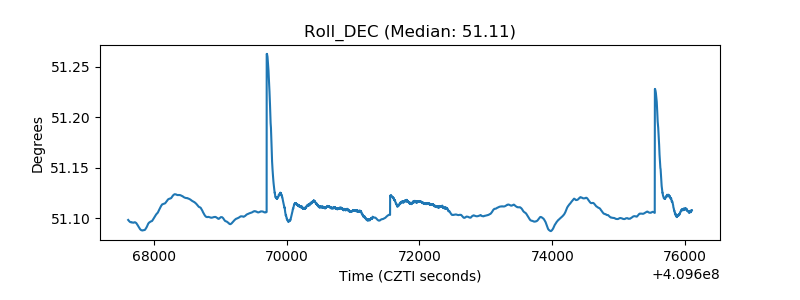 |
| _Roll_RA | 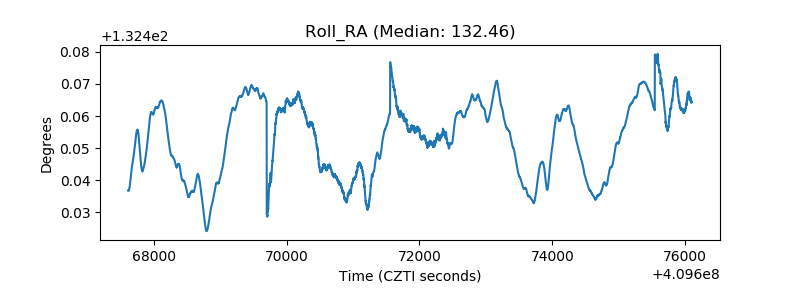 |
| Veto Counter | 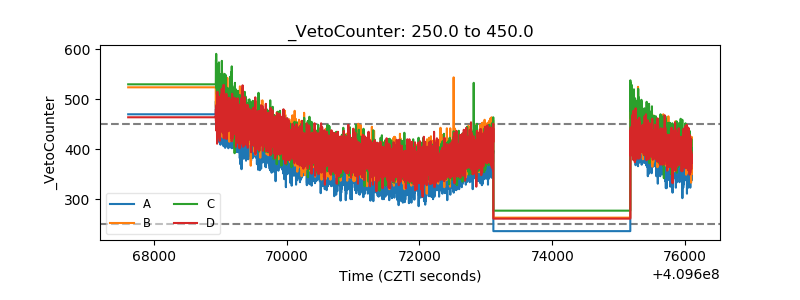 |