| Param | Original file | Final file |
|---|---|---|
| Filename | modeM0/AS1A12_054T02_9000005444_39160cztM0_level2.fits | modeM0/AS1A12_054T02_9000005444_39160cztM0_level2_quad_clean.evt |
| Size (bytes) | 436,377,600 | 84,493,440 |
| Size | 416.2 MB | 80.6 MB |
| Events in quadrant A | 2,784,365 | 616,147 |
| Events in quadrant B | 2,394,754 | 617,223 |
| Events in quadrant C | 2,503,644 | 584,390 |
| Events in quadrant D | 8,062,931 | 373,520 |
| Mode M9 | |||
|---|---|---|---|
| Quadrant | BADHDUFLAG | Total packets | Discarded packets |
| A | 0 | 32 | 0 |
| B | 0 | 32 | 0 |
| C | 0 | 32 | 0 |
| D | 0 | 33 | 0 |
| Mode M0 | |||
|---|---|---|---|
| Quadrant | BADHDUFLAG | Total packets | Discarded packets |
| A | 0 | 11557 | 3 |
| B | 0 | 10793 | 2 |
| C | 0 | 10704 | 2 |
| D | 0 | 27592 | 2 |
| Mode SS | |||
|---|---|---|---|
| Quadrant | BADHDUFLAG | Total packets | Discarded packets |
| A | 0 | 108 | 0 |
| B | 0 | 108 | 0 |
| C | 0 | 108 | 0 |
| D | 0 | 108 | 0 |
| Quadrant | Total seconds | Saturated seconds | Saturation percentage |
|---|---|---|---|
| A | 5237 | 25 | 0.477373% |
| B | 5237 | 34 | 0.649227% |
| C | 5237 | 9 | 0.171854% |
| D | 5237 | 1904 | 36.356693% |
Noise dominated data is calculated using 1-second bins in cleaned event files. If a bin has >2000 counts, and if more than 50% of those come from <1% of pixels, then it is considered to be noise-dominated and hence unusable.
| Quadrant | # 1 sec bins | Bins with >0 counts | Bins with >2000 counts | High rate bins dominated by noise | Noise dominated (total time) | Noise dominated (detector-on time) | Marked lightcurve |
|---|---|---|---|---|---|---|---|
| A | 7061 | 5238 | 9 | 9 | 0.13% | 0.17% | 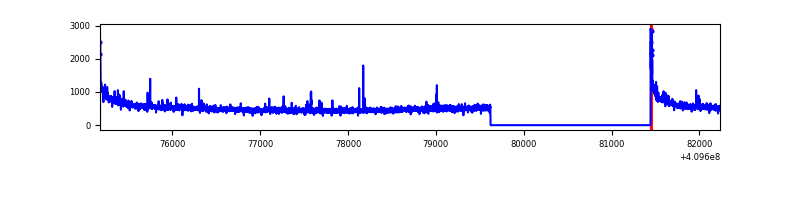 |
| B | 7061 | 5238 | 13 | 13 | 0.18% | 0.25% | 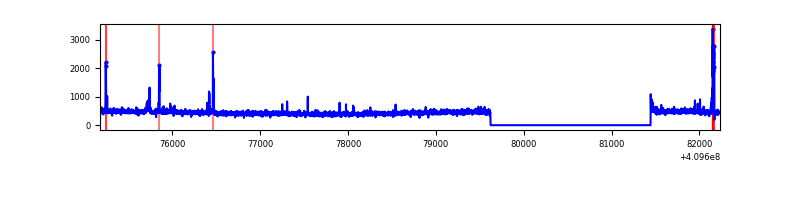 |
| C | 7061 | 5238 | 5 | 5 | 0.07% | 0.10% | 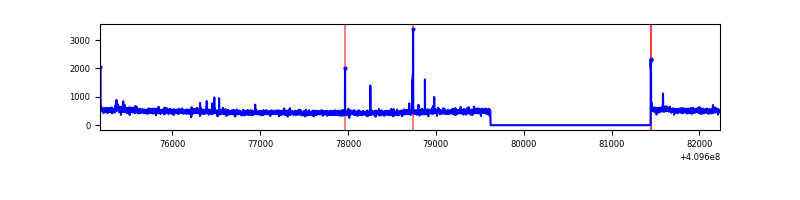 |
| D | 7061 | 5238 | 1639 | 1639 | 23.21% | 31.29% | 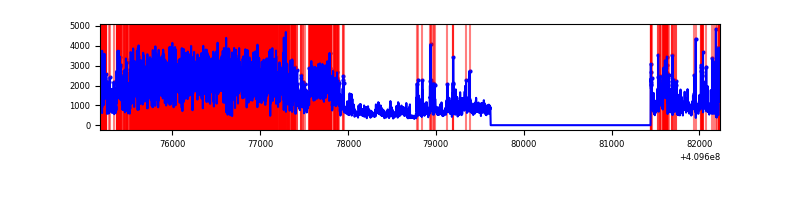 |
Top three noisy pixels from each quadrant. If the there are fewer than three noisy pixels in the level2.evt file, extra rows are filled as -1
| Pixel properties | Quadrant properties | ||||||
|---|---|---|---|---|---|---|---|
| Quadrant | DetID | PixID | Counts | Sigma | Mean | Median | Sigma |
| A | 10 | 83 | 433159 | 3625.52 | 584 | 574 | 119.3 |
| A | 13 | 248 | 45905 | 379.92 | 584 | 574 | 119.3 |
| A | 15 | 223 | 25881 | 212.1 | 584 | 574 | 119.3 |
| B | 5 | 172 | 104064 | 926.65 | 579 | 563 | 111.7 |
| B | 0 | 213 | 14368 | 123.6 | 579 | 563 | 111.7 |
| B | 12 | 111 | 13695 | 117.57 | 579 | 563 | 111.7 |
| C | 15 | 214 | 219478 | 1672.53 | 568 | 571 | 130.9 |
| C | 3 | 233 | 19507 | 144.67 | 568 | 571 | 130.9 |
| C | 9 | 187 | 18447 | 136.58 | 568 | 571 | 130.9 |
| D | 12 | 235 | 5275551 | 43321.83 | 494 | 481 | 121.8 |
| D | 2 | 249 | 296157 | 2428.26 | 494 | 481 | 121.8 |
| D | 2 | 120 | 197569 | 1618.6 | 494 | 481 | 121.8 |
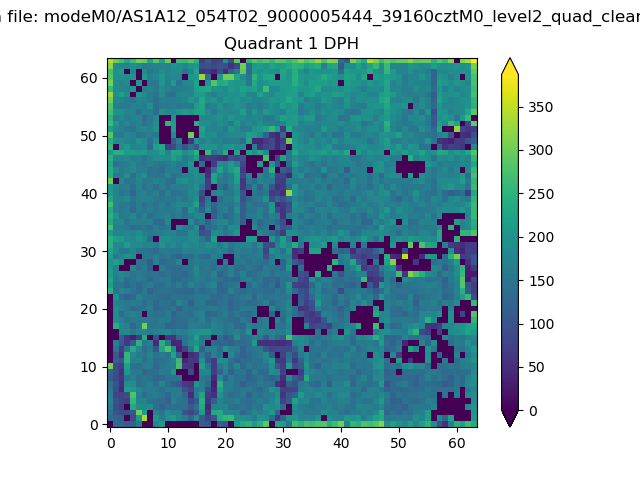
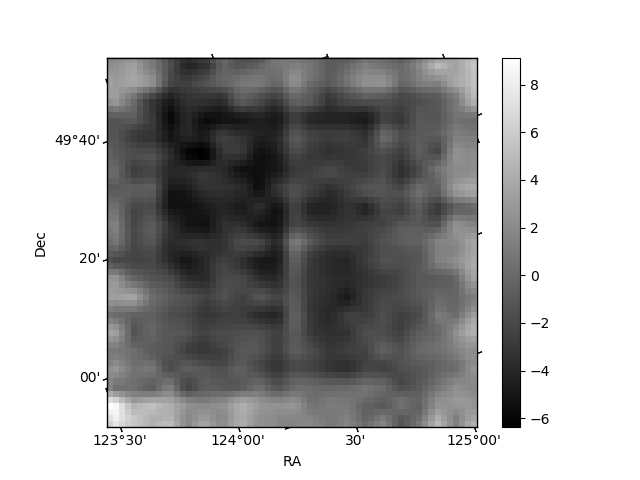
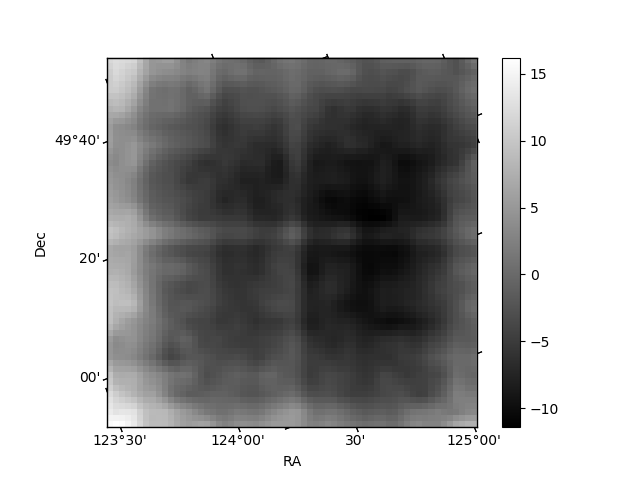
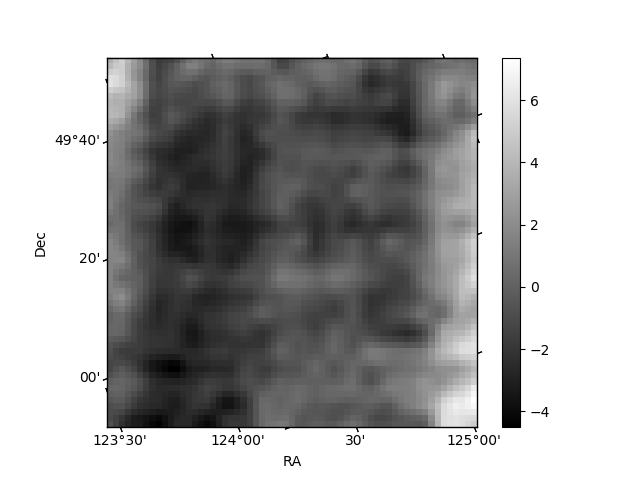
Histogram calculated using DETX and DETY for each event in the final _common_clean file
| Quadrant A |  |
 |
Quadrant B |
|---|---|---|---|
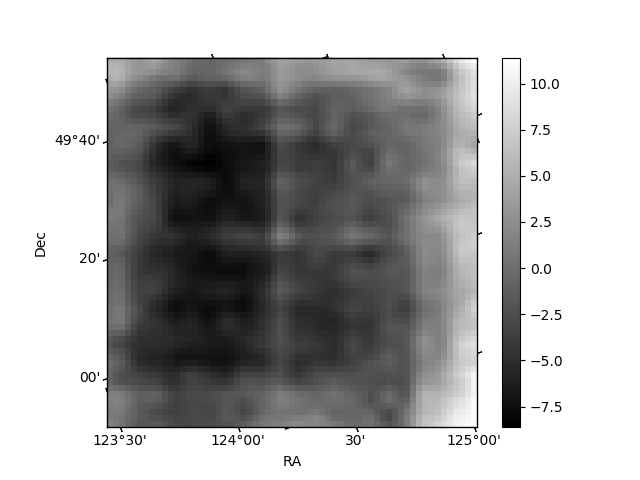
| Quadrant D | 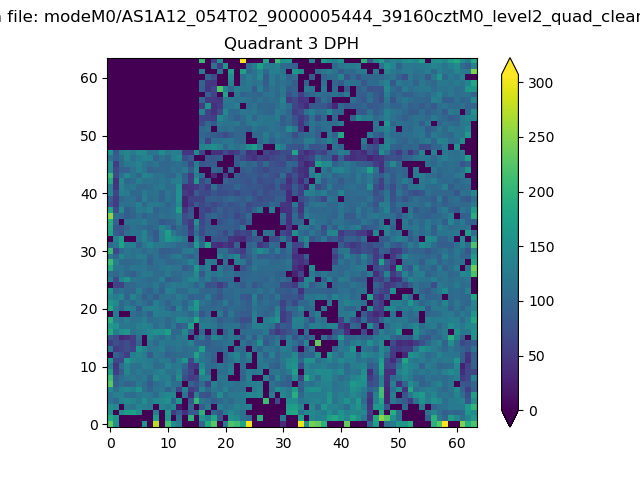 |
 |
Quadrant C |
| Plot type | Count rate plots | Images |
|---|---|---|
| Comparison with Poisson distribution Blue bars denote a histogram of data divided into 1 sec bins. Red curve is a Poisson curve with rate = median count rate of data. |
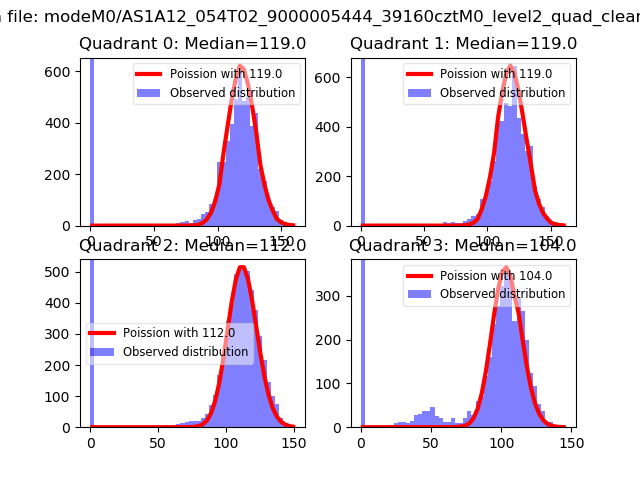 |
 |
| Quadrant-wise count rates Data is divided into 100 sec bins |
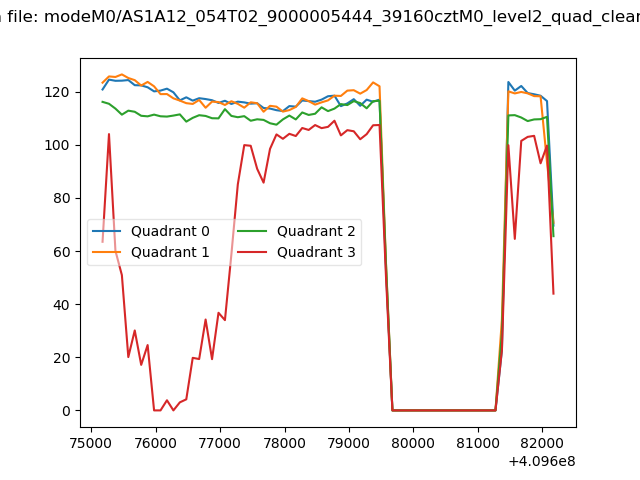 |
|
| Module-wise count rates for Quadrant A Data is divided into 100 sec bins |
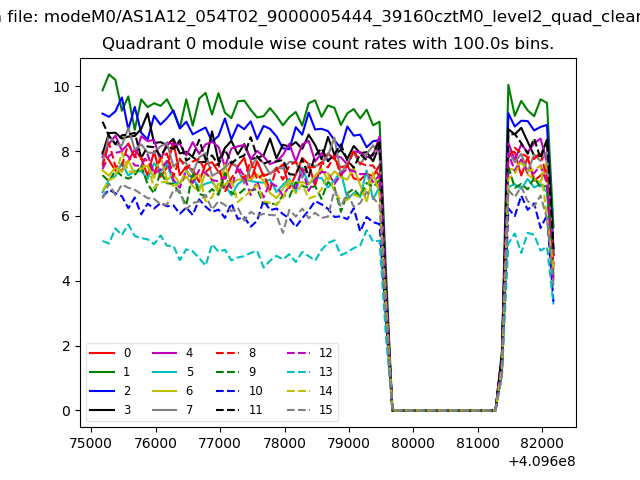 |
 |
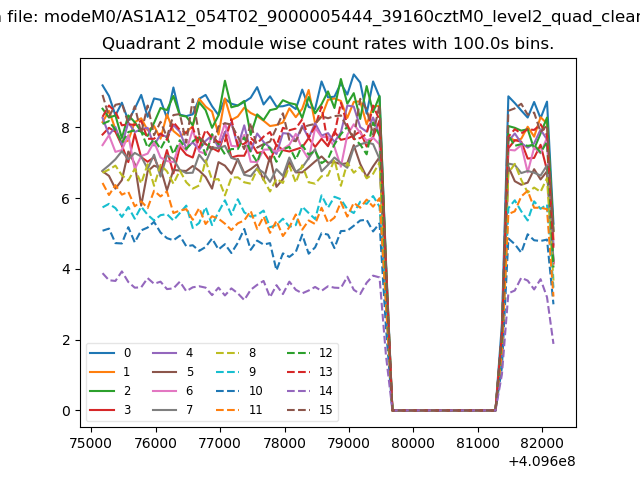
| Module-wise count rates for Quadrant B Data is divided into 100 sec bins |
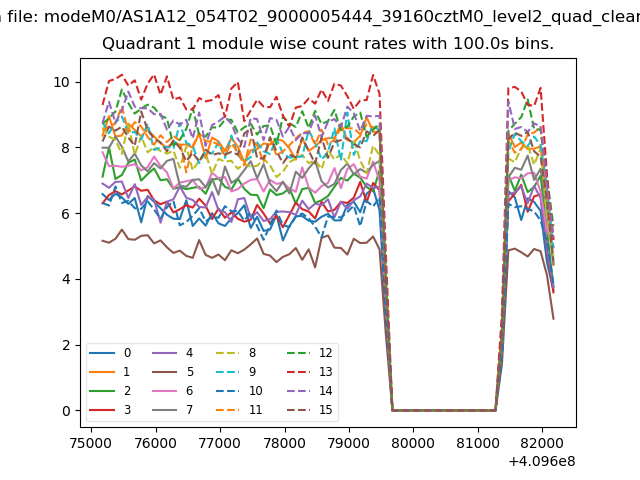 |
 |
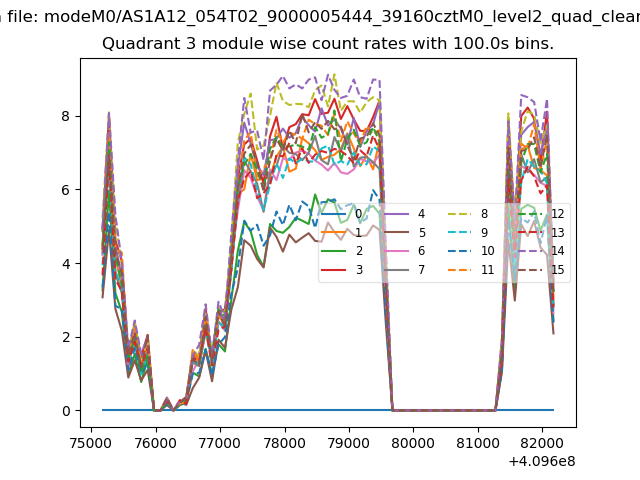
| Module-wise count rates for Quadrant C Data is divided into 100 sec bins |
 |
 |
| Module-wise count rates for Quadrant D Data is divided into 100 sec bins |
 |
 |
| Parameter | Plot |
|---|---|
| CZT HV Monitor | 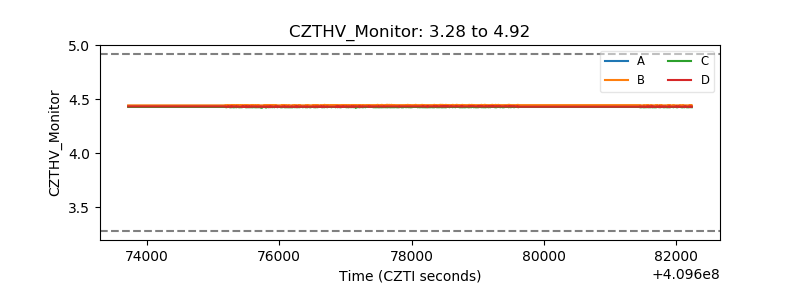 |
| D_VDD | 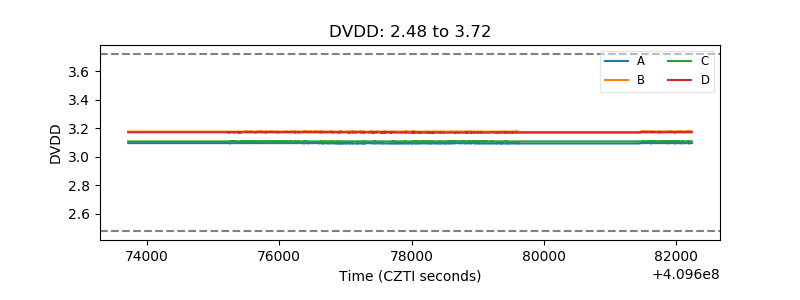 |
| Temperature 1 | 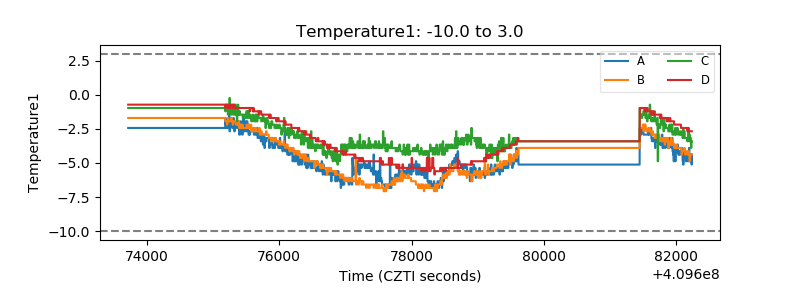 |
| Veto HV Monitor | 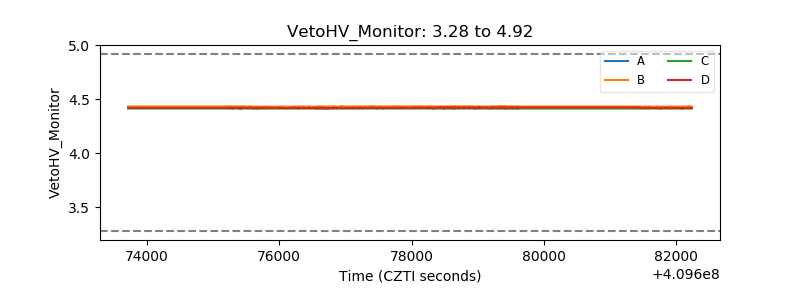 |
| Veto LLD | 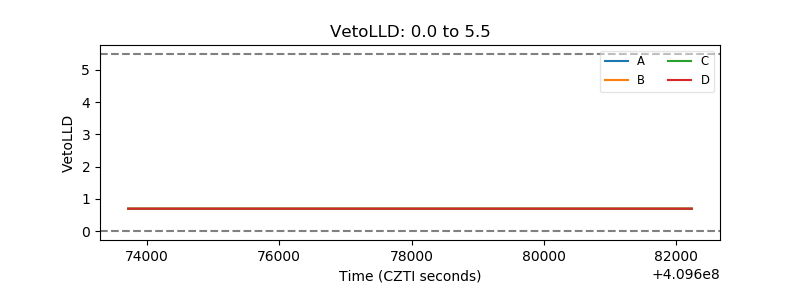 |
| Alpha Counter | 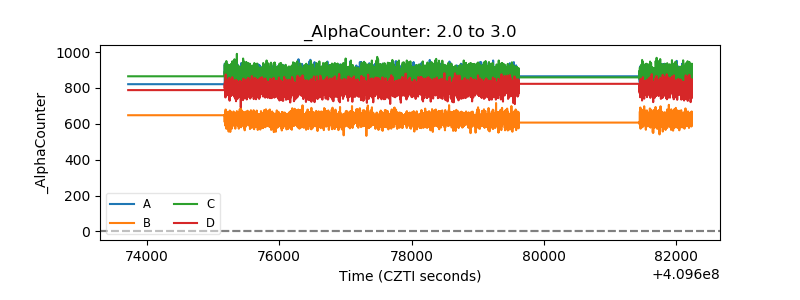 |
| _CPM_Rate | 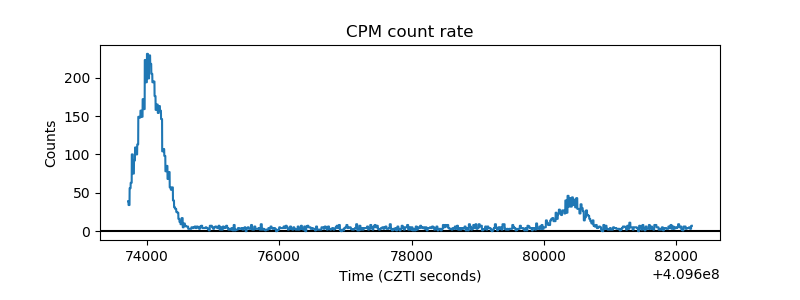 |
| CZT Counter | 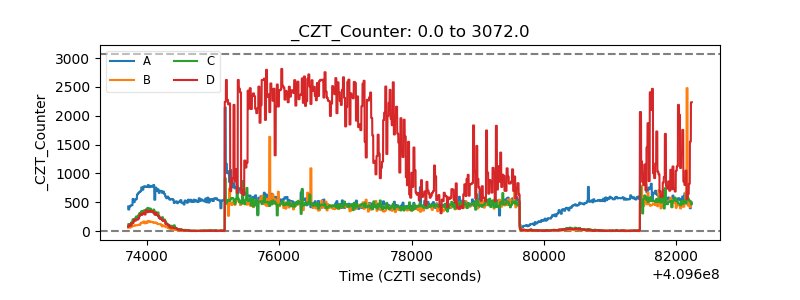 |
| +2.5 Volts monitor |  |
| +5 Volts monitor | 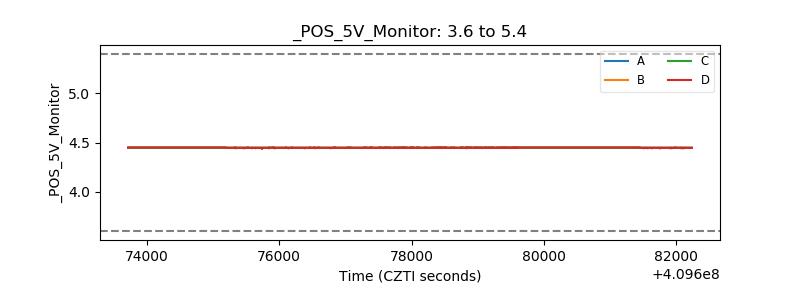 |
| _ROLL_ROT | 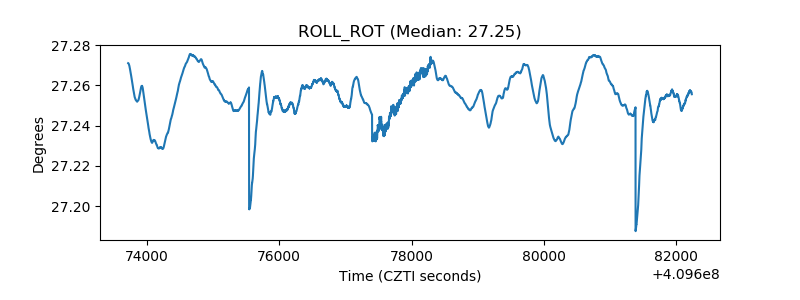 |
| _Roll_DEC | 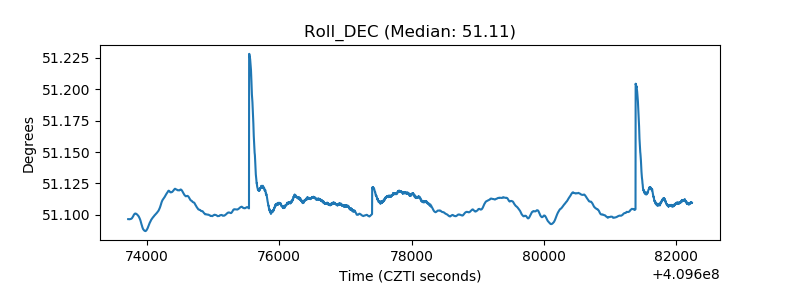 |
| _Roll_RA | 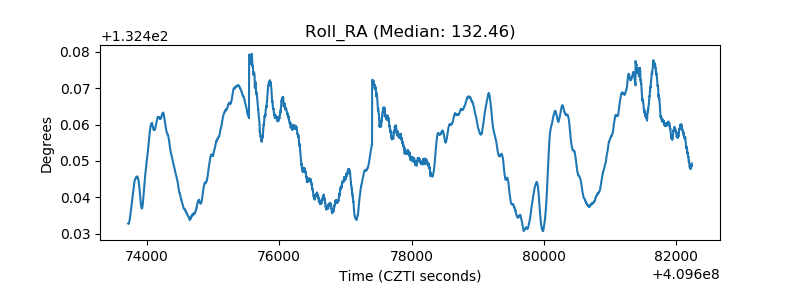 |
| Veto Counter | 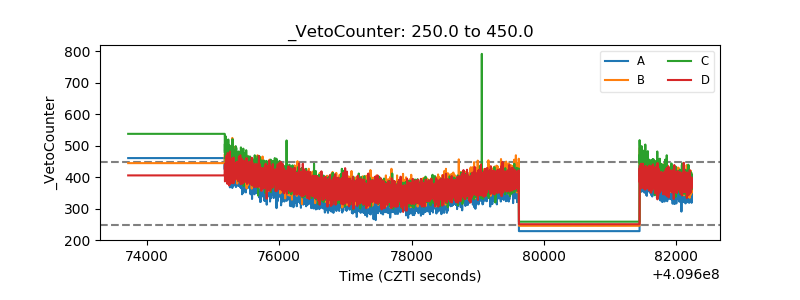 |