| Param | Original file | Final file |
|---|---|---|
| Filename | modeM0/AS1A12_054T02_9000005444_39161cztM0_level2.fits | modeM0/AS1A12_054T02_9000005444_39161cztM0_level2_quad_clean.evt |
| Size (bytes) | 478,681,920 | 89,933,760 |
| Size | 456.5 MB | 85.8 MB |
| Events in quadrant A | 2,903,659 | 638,985 |
| Events in quadrant B | 2,511,110 | 641,205 |
| Events in quadrant C | 2,636,253 | 612,733 |
| Events in quadrant D | 9,235,275 | 440,407 |
| Mode M9 | |||
|---|---|---|---|
| Quadrant | BADHDUFLAG | Total packets | Discarded packets |
| A | 0 | 31 | 0 |
| B | 0 | 31 | 0 |
| C | 0 | 31 | 0 |
| D | 0 | 32 | 0 |
| Mode M0 | |||
|---|---|---|---|
| Quadrant | BADHDUFLAG | Total packets | Discarded packets |
| A | 0 | 12148 | 2 |
| B | 0 | 11464 | 1 |
| C | 0 | 11350 | 1 |
| D | 0 | 31280 | 1 |
| Mode SS | |||
|---|---|---|---|
| Quadrant | BADHDUFLAG | Total packets | Discarded packets |
| A | 0 | 112 | 0 |
| B | 0 | 112 | 0 |
| C | 0 | 112 | 0 |
| D | 0 | 112 | 0 |
| Quadrant | Total seconds | Saturated seconds | Saturation percentage |
|---|---|---|---|
| A | 5574 | 23 | 0.412630% |
| B | 5574 | 36 | 0.645856% |
| C | 5574 | 7 | 0.125583% |
| D | 5574 | 1690 | 30.319340% |
Noise dominated data is calculated using 1-second bins in cleaned event files. If a bin has >2000 counts, and if more than 50% of those come from <1% of pixels, then it is considered to be noise-dominated and hence unusable.
| Quadrant | # 1 sec bins | Bins with >0 counts | Bins with >2000 counts | High rate bins dominated by noise | Noise dominated (total time) | Noise dominated (detector-on time) | Marked lightcurve |
|---|---|---|---|---|---|---|---|
| A | 7066 | 5575 | 11 | 11 | 0.16% | 0.20% | 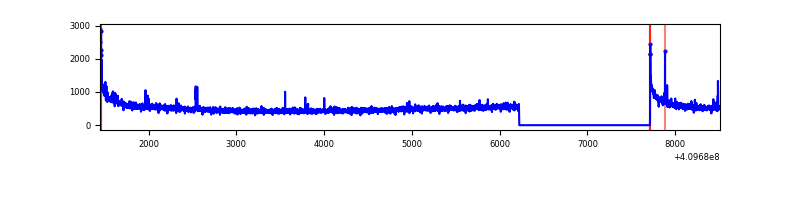 |
| B | 7066 | 5575 | 21 | 21 | 0.30% | 0.38% | 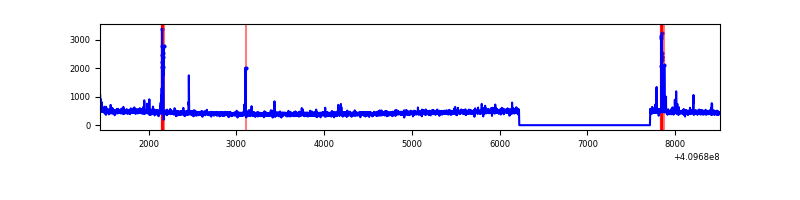 |
| C | 7066 | 5575 | 3 | 3 | 0.04% | 0.05% | 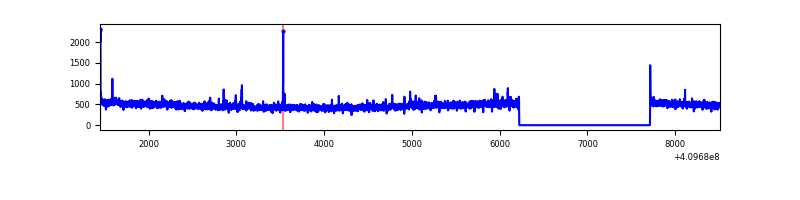 |
| D | 7066 | 5575 | 1680 | 1680 | 23.78% | 30.13% | 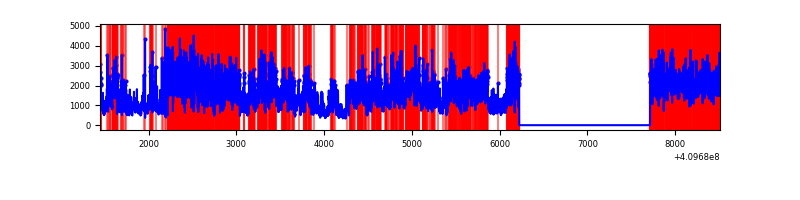 |
Top three noisy pixels from each quadrant. If the there are fewer than three noisy pixels in the level2.evt file, extra rows are filled as -1
| Pixel properties | Quadrant properties | ||||||
|---|---|---|---|---|---|---|---|
| Quadrant | DetID | PixID | Counts | Sigma | Mean | Median | Sigma |
| A | 10 | 83 | 448397 | 3606.46 | 615 | 603 | 124.2 |
| A | 13 | 248 | 49179 | 391.22 | 615 | 603 | 124.2 |
| A | 15 | 223 | 22803 | 178.8 | 615 | 603 | 124.2 |
| B | 5 | 172 | 100356 | 853.03 | 609 | 592 | 117.0 |
| B | 12 | 111 | 14496 | 118.89 | 609 | 592 | 117.0 |
| B | 11 | 111 | 13411 | 109.61 | 609 | 592 | 117.0 |
| C | 15 | 214 | 231815 | 1665.02 | 600 | 601 | 138.9 |
| C | 9 | 187 | 36509 | 258.58 | 600 | 601 | 138.9 |
| C | 3 | 233 | 18595 | 129.58 | 600 | 601 | 138.9 |
| D | 12 | 235 | 6282553 | 46759.91 | 551 | 535 | 134.3 |
| D | 2 | 249 | 326772 | 2428.33 | 551 | 535 | 134.3 |
| D | 12 | 233 | 222380 | 1651.29 | 551 | 535 | 134.3 |
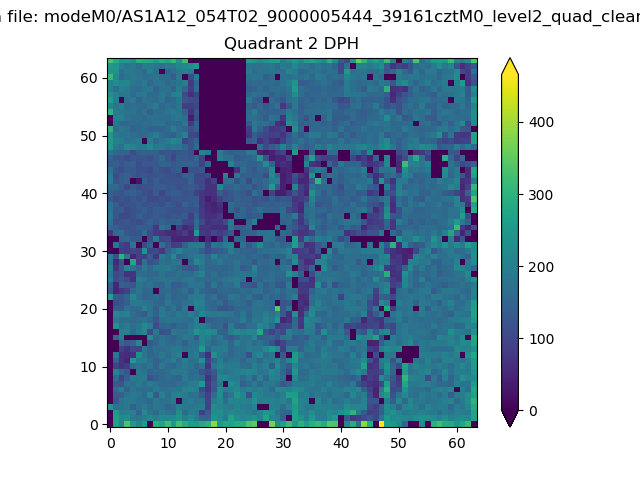
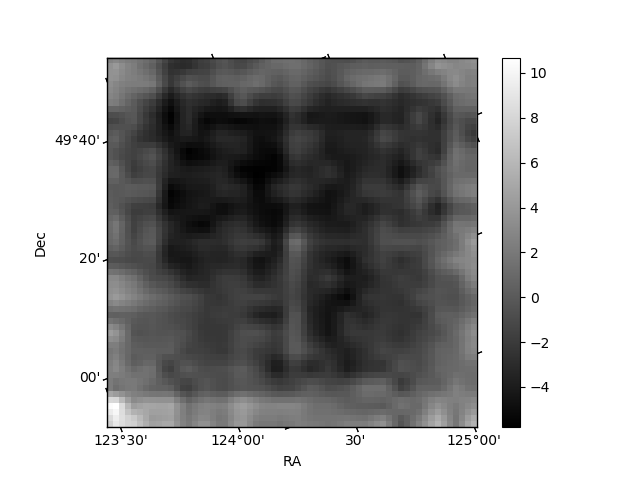
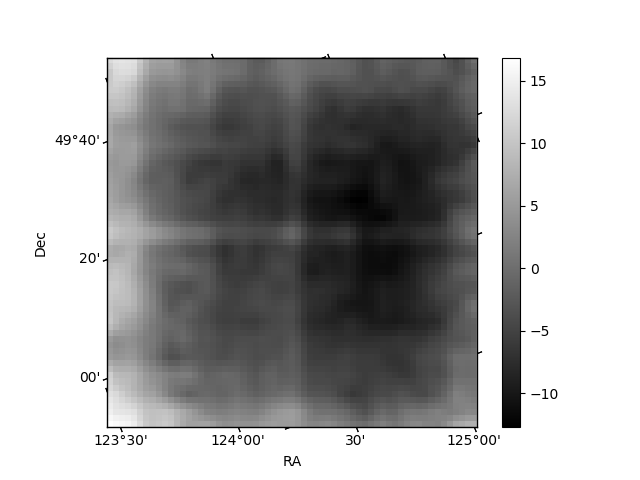
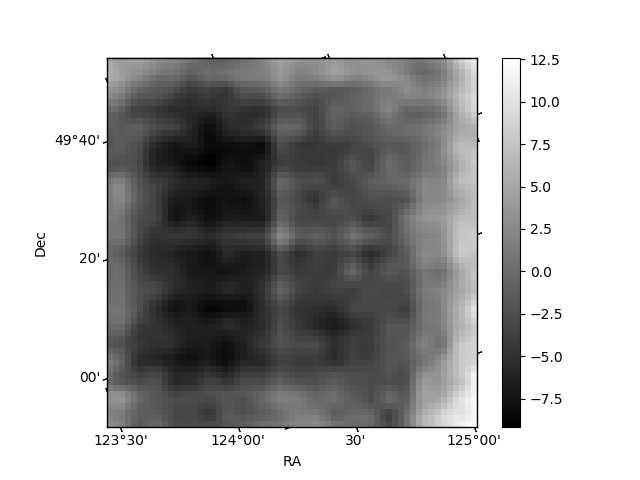
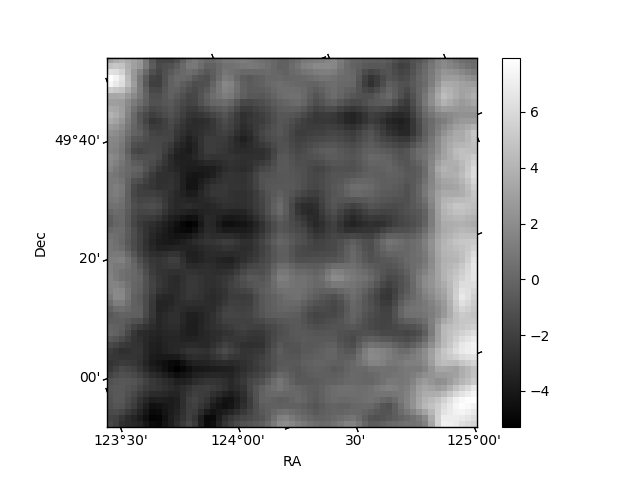
Histogram calculated using DETX and DETY for each event in the final _common_clean file
| Quadrant A | 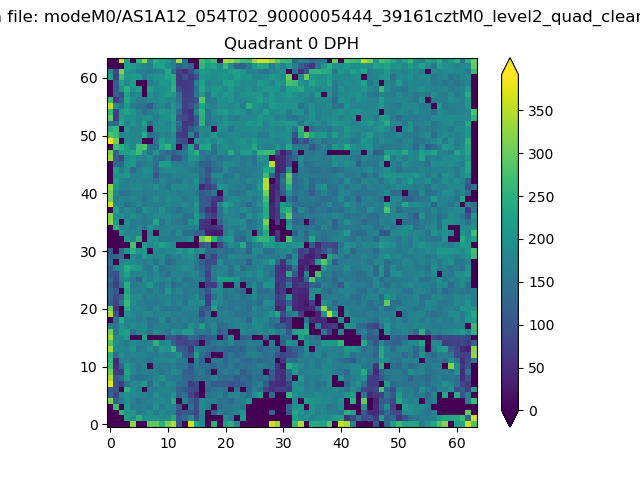 |
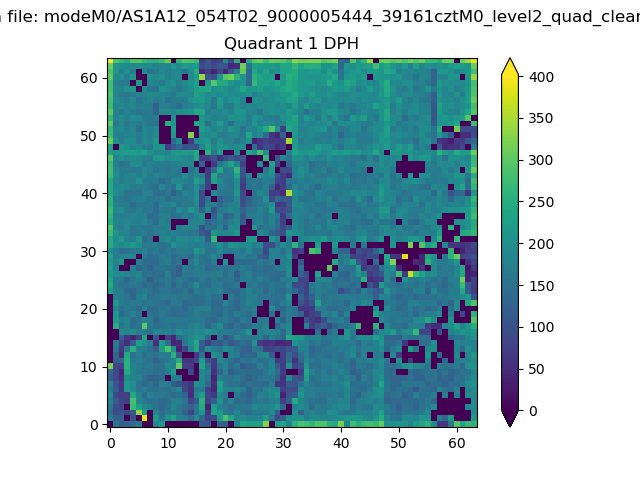 |
Quadrant B |
|---|---|---|---|
| Quadrant D | 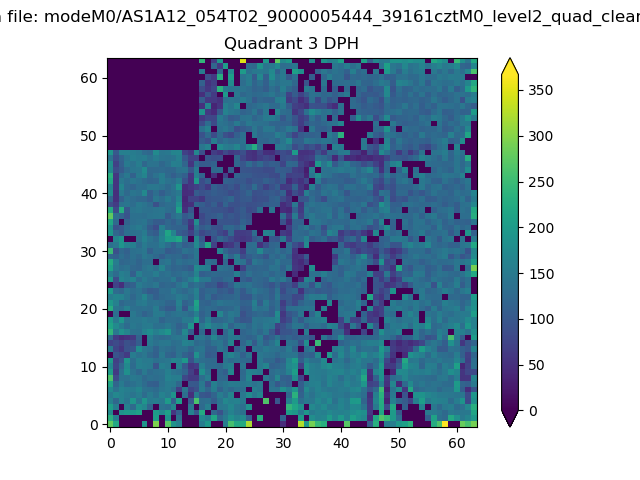 |
 |
Quadrant C |
| Plot type | Count rate plots | Images |
|---|---|---|
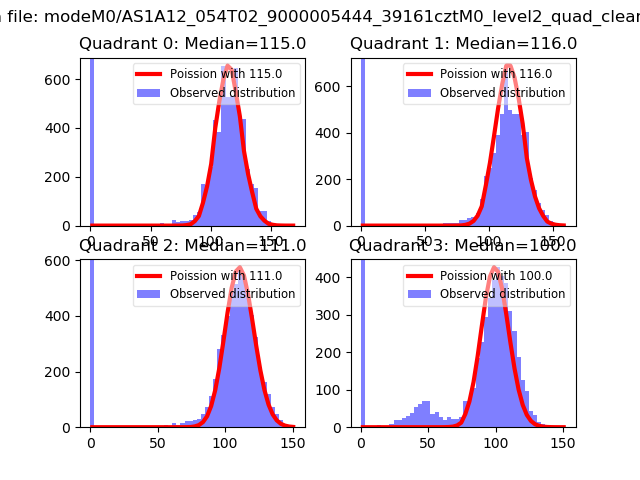
| Comparison with Poisson distribution Blue bars denote a histogram of data divided into 1 sec bins. Red curve is a Poisson curve with rate = median count rate of data. |
 |
 |
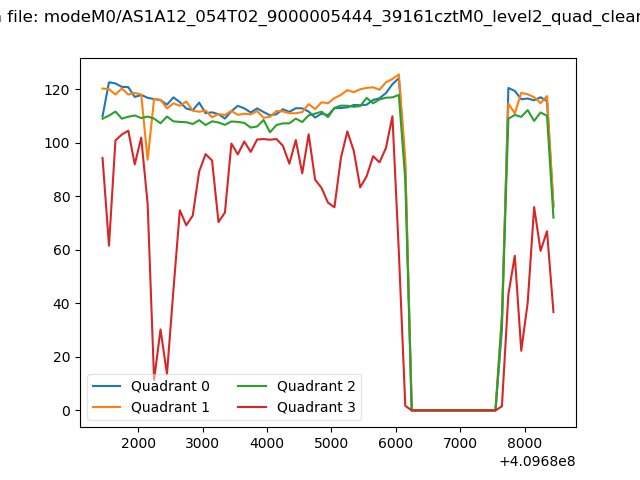
| Quadrant-wise count rates Data is divided into 100 sec bins |
 |
|
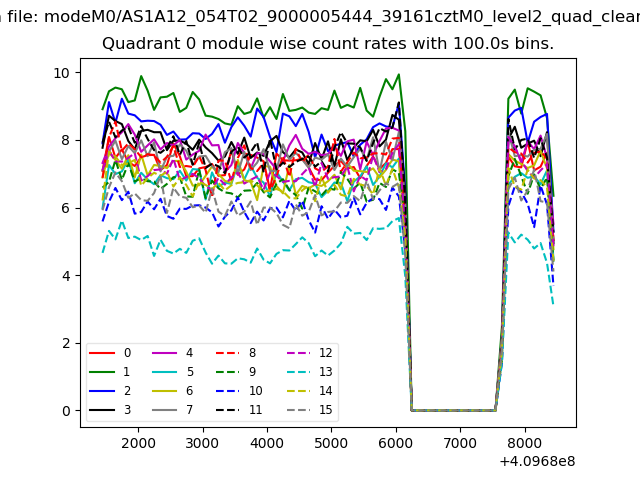
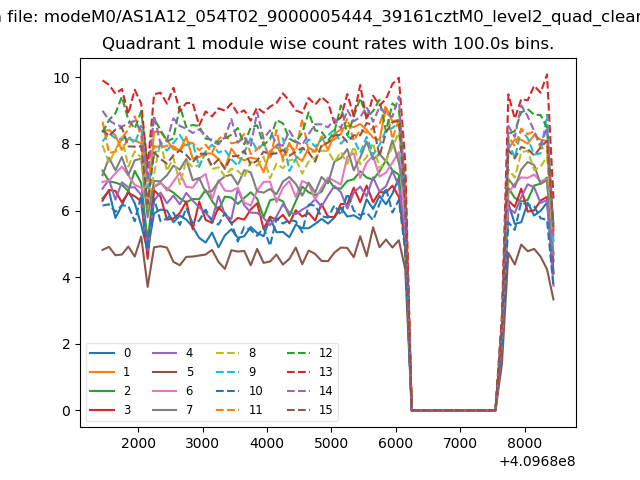
| Module-wise count rates for Quadrant A Data is divided into 100 sec bins |
 |
 |
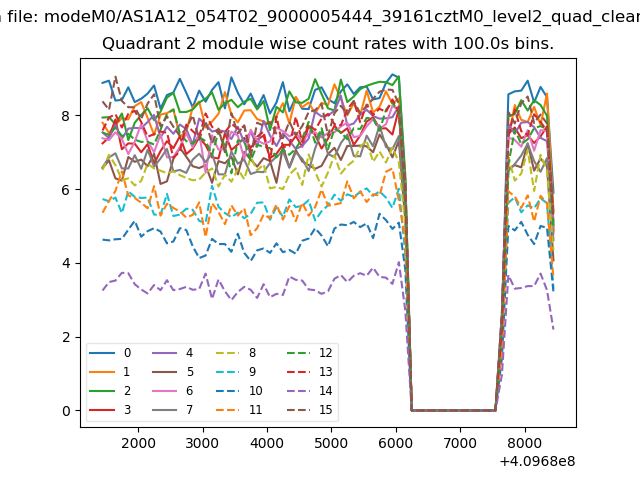
| Module-wise count rates for Quadrant B Data is divided into 100 sec bins |
 |
 |
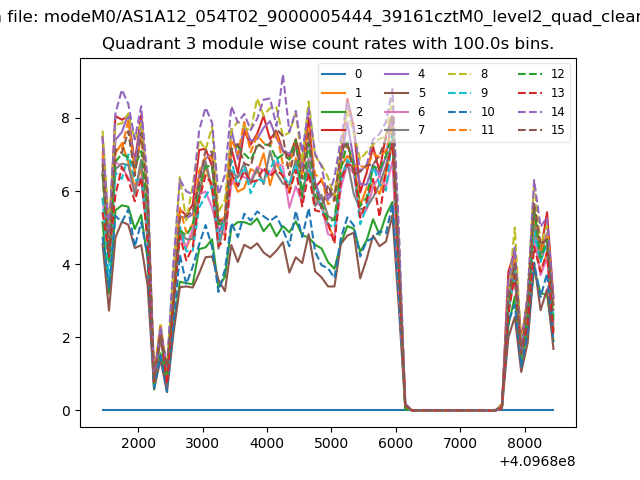
| Module-wise count rates for Quadrant C Data is divided into 100 sec bins |
 |
 |
| Module-wise count rates for Quadrant D Data is divided into 100 sec bins |
 |
 |
| Parameter | Plot |
|---|---|
| CZT HV Monitor | 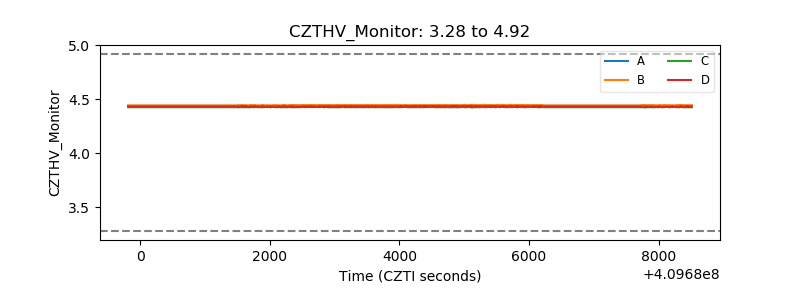 |
| D_VDD | 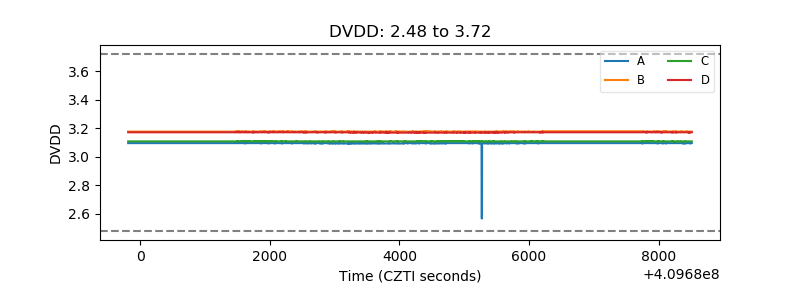 |
| Temperature 1 | 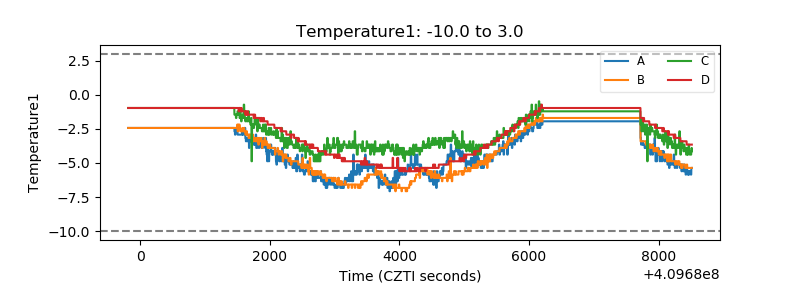 |
| Veto HV Monitor | 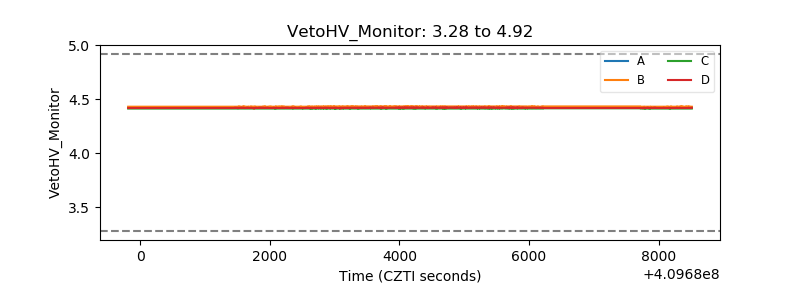 |
| Veto LLD | 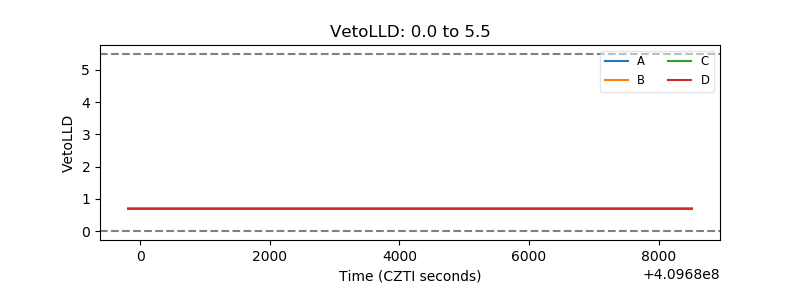 |
| Alpha Counter | 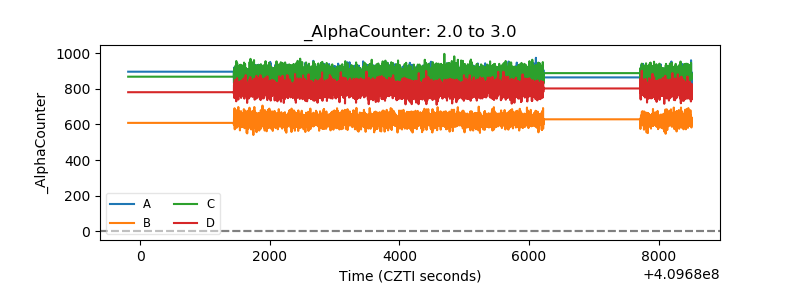 |
| _CPM_Rate | 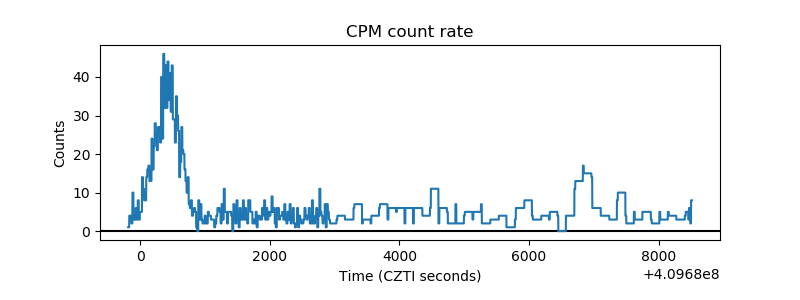 |
| CZT Counter | 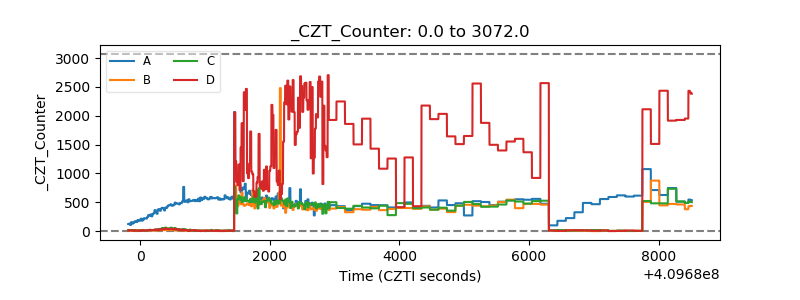 |
| +2.5 Volts monitor | 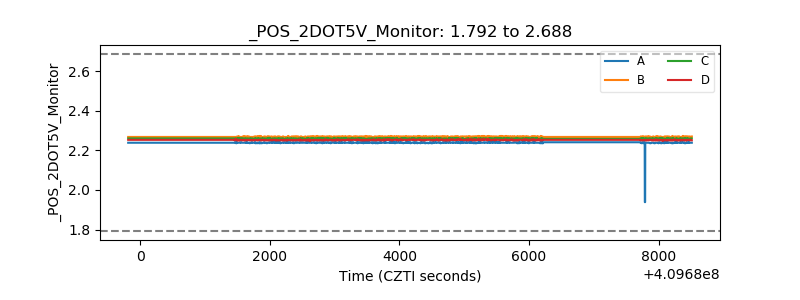 |
| +5 Volts monitor | 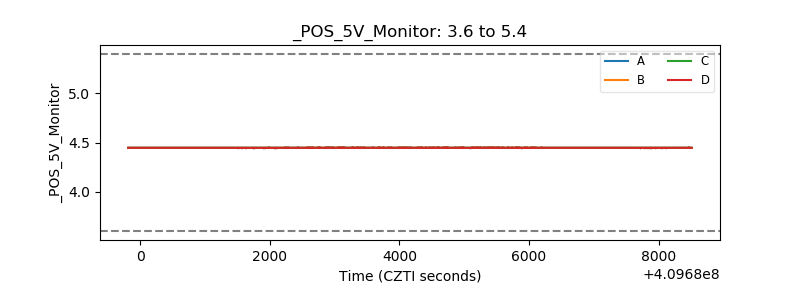 |
| _ROLL_ROT | 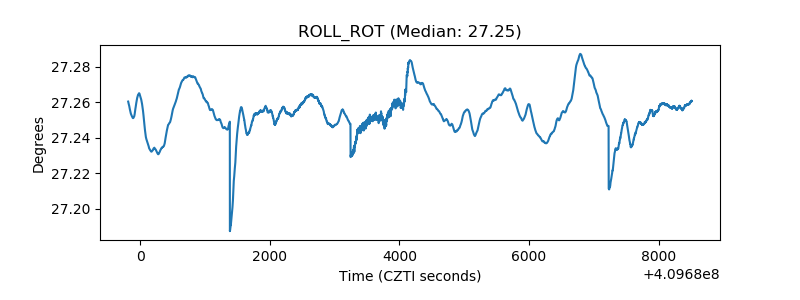 |
| _Roll_DEC | 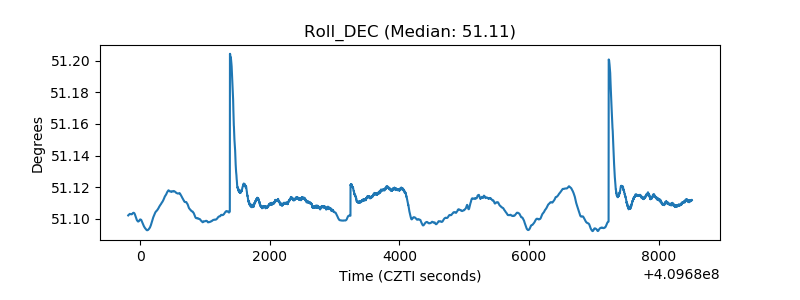 |
| _Roll_RA | 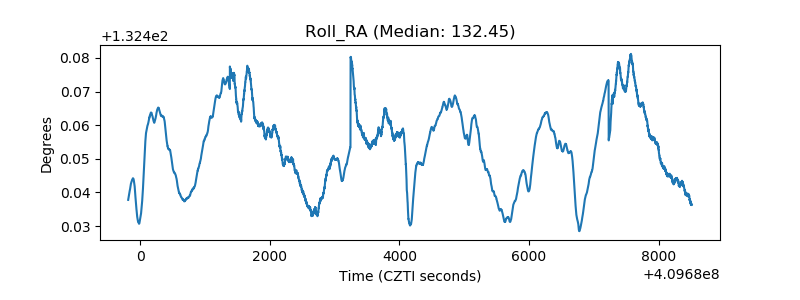 |
| Veto Counter | 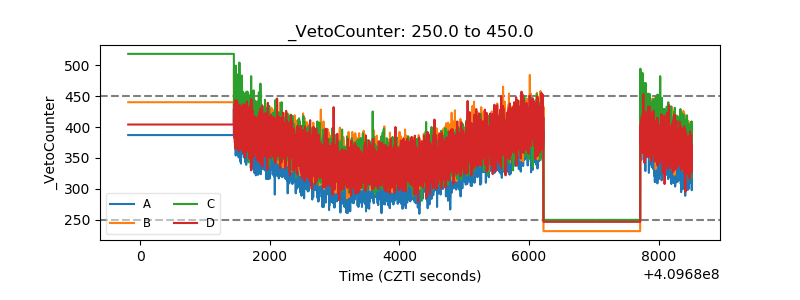 |