| Param | Original file | Final file |
|---|---|---|
| Filename | modeM0/AS1A12_054T02_9000005444_39162cztM0_level2.fits | modeM0/AS1A12_054T02_9000005444_39162cztM0_level2_quad_clean.evt |
| Size (bytes) | 574,617,600 | 96,744,960 |
| Size | 548.0 MB | 92.3 MB |
| Events in quadrant A | 3,512,581 | 699,702 |
| Events in quadrant B | 2,835,093 | 707,866 |
| Events in quadrant C | 2,924,771 | 678,869 |
| Events in quadrant D | 11,517,496 | 410,440 |
| Mode M9 | |||
|---|---|---|---|
| Quadrant | BADHDUFLAG | Total packets | Discarded packets |
| A | 0 | 28 | 0 |
| B | 0 | 28 | 0 |
| C | 0 | 28 | 0 |
| D | 0 | 28 | 0 |
| Mode M0 | |||
|---|---|---|---|
| Quadrant | BADHDUFLAG | Total packets | Discarded packets |
| A | 0 | 14380 | 2 |
| B | 0 | 12838 | 1 |
| C | 0 | 12637 | 1 |
| D | 0 | 38509 | 1 |
| Mode SS | |||
|---|---|---|---|
| Quadrant | BADHDUFLAG | Total packets | Discarded packets |
| A | 0 | 128 | 0 |
| B | 0 | 128 | 0 |
| C | 0 | 128 | 0 |
| D | 0 | 128 | 0 |
| Quadrant | Total seconds | Saturated seconds | Saturation percentage |
|---|---|---|---|
| A | 6190 | 88 | 1.421648% |
| B | 6190 | 47 | 0.759289% |
| C | 6190 | 5 | 0.080775% |
| D | 6190 | 2734 | 44.168013% |
Noise dominated data is calculated using 1-second bins in cleaned event files. If a bin has >2000 counts, and if more than 50% of those come from <1% of pixels, then it is considered to be noise-dominated and hence unusable.
| Quadrant | # 1 sec bins | Bins with >0 counts | Bins with >2000 counts | High rate bins dominated by noise | Noise dominated (total time) | Noise dominated (detector-on time) | Marked lightcurve |
|---|---|---|---|---|---|---|---|
| A | 8995 | 6192 | 61 | 61 | 0.68% | 0.99% | 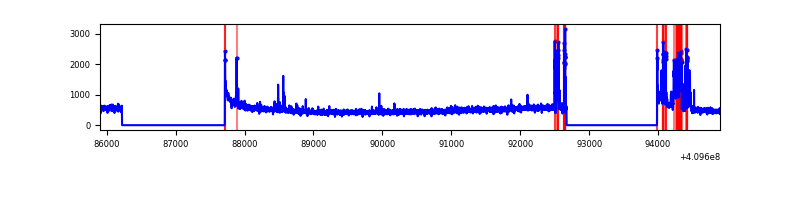 |
| B | 8995 | 6192 | 26 | 26 | 0.29% | 0.42% | 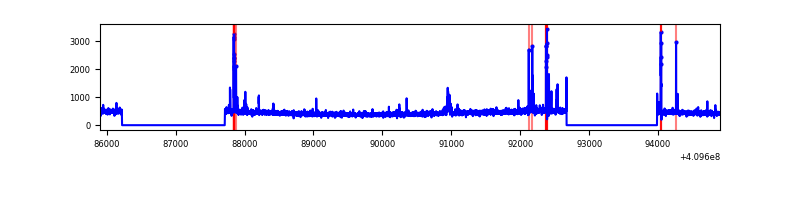 |
| C | 8995 | 6192 | 0 | 0 | 0.00% | 0.00% | 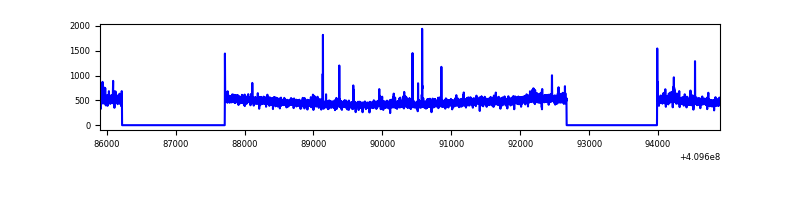 |
| D | 8995 | 6192 | 2561 | 2561 | 28.47% | 41.36% | 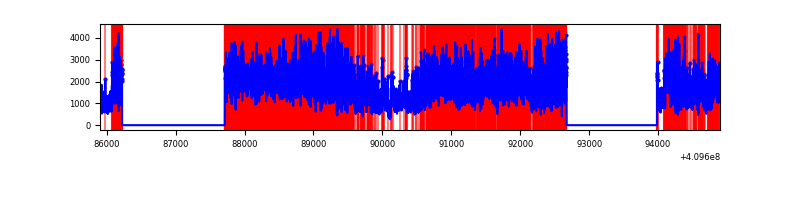 |
Top three noisy pixels from each quadrant. If the there are fewer than three noisy pixels in the level2.evt file, extra rows are filled as -1
| Pixel properties | Quadrant properties | ||||||
|---|---|---|---|---|---|---|---|
| Quadrant | DetID | PixID | Counts | Sigma | Mean | Median | Sigma |
| A | 10 | 83 | 478884 | 3445.33 | 686 | 672 | 138.8 |
| A | 2 | 79 | 254363 | 1827.74 | 686 | 672 | 138.8 |
| A | 13 | 248 | 108988 | 780.37 | 686 | 672 | 138.8 |
| B | 5 | 172 | 145401 | 1109.23 | 678 | 660 | 130.5 |
| B | 12 | 111 | 16253 | 119.5 | 678 | 660 | 130.5 |
| B | 11 | 111 | 15003 | 109.92 | 678 | 660 | 130.5 |
| C | 15 | 214 | 257043 | 1646.83 | 667 | 672 | 155.7 |
| C | 9 | 187 | 54047 | 342.86 | 667 | 672 | 155.7 |
| C | 0 | 10 | 6128 | 35.05 | 667 | 672 | 155.7 |
| D | 12 | 235 | 8841352 | 61999.29 | 584 | 568 | 142.6 |
| D | 12 | 233 | 129858 | 906.69 | 584 | 568 | 142.6 |
| D | 2 | 249 | 73803 | 513.59 | 584 | 568 | 142.6 |
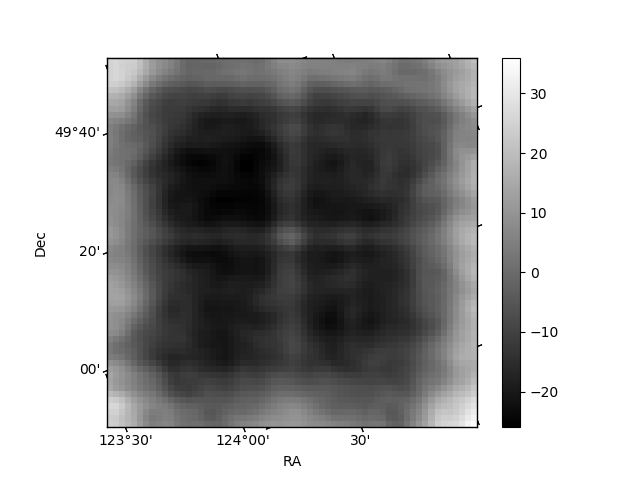
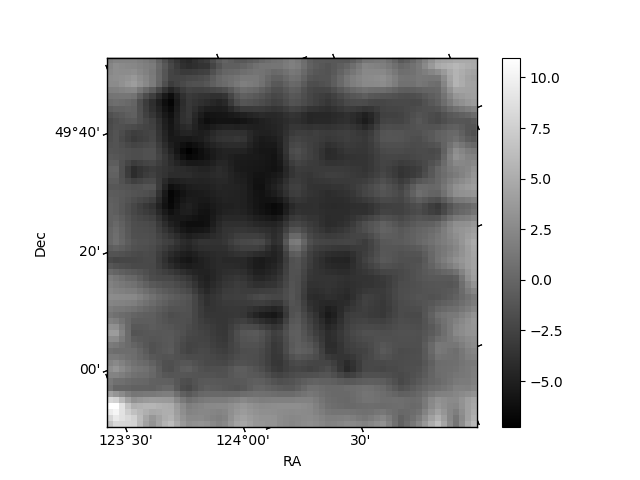
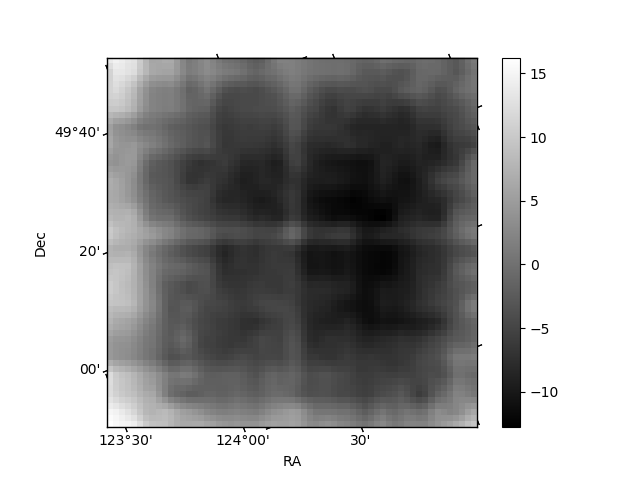
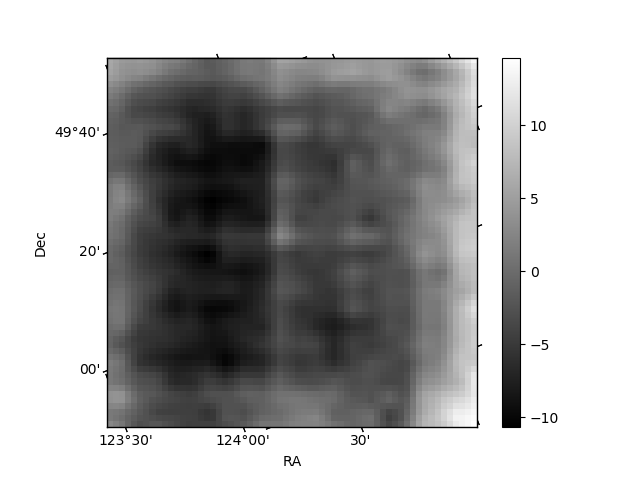
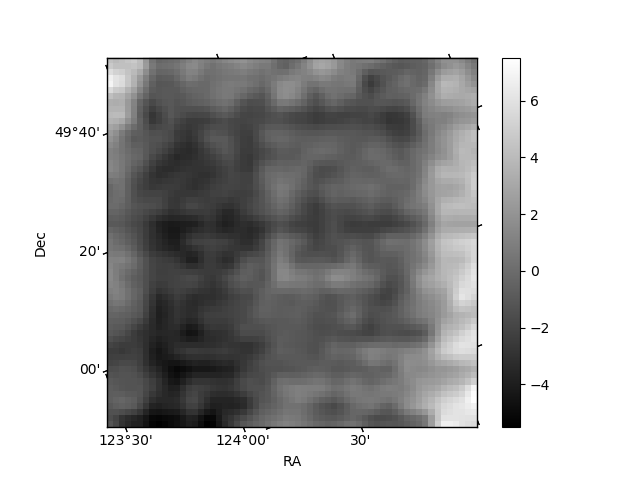
Histogram calculated using DETX and DETY for each event in the final _common_clean file
| Quadrant A | 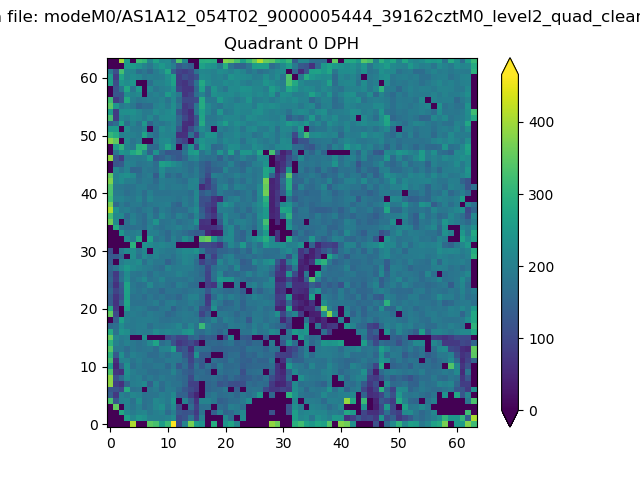 |
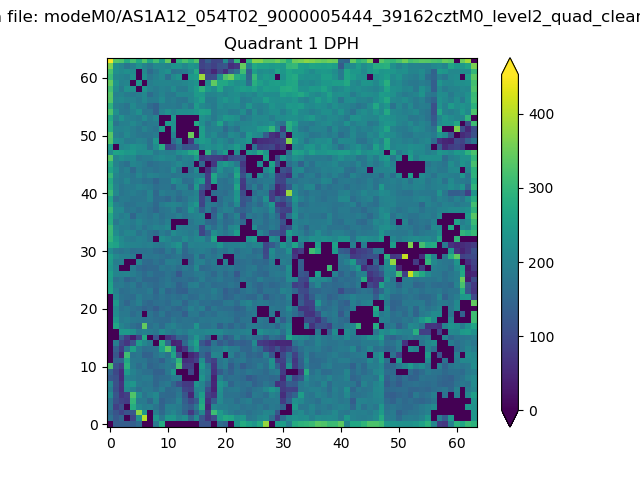 |
Quadrant B |
|---|---|---|---|
| Quadrant D | 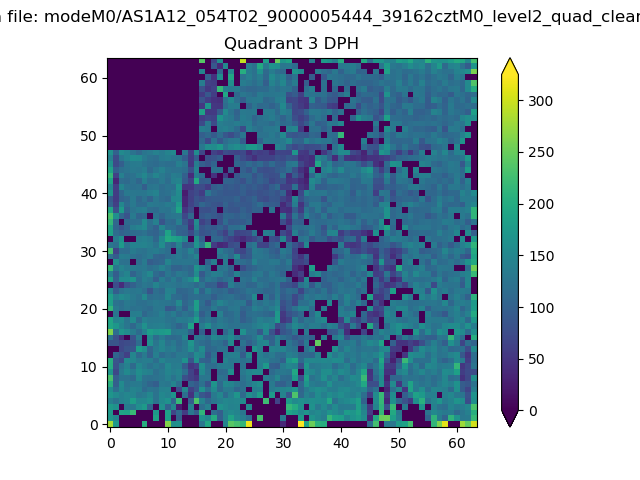 |
 |
Quadrant C |
| Plot type | Count rate plots | Images |
|---|---|---|
| Comparison with Poisson distribution Blue bars denote a histogram of data divided into 1 sec bins. Red curve is a Poisson curve with rate = median count rate of data. |
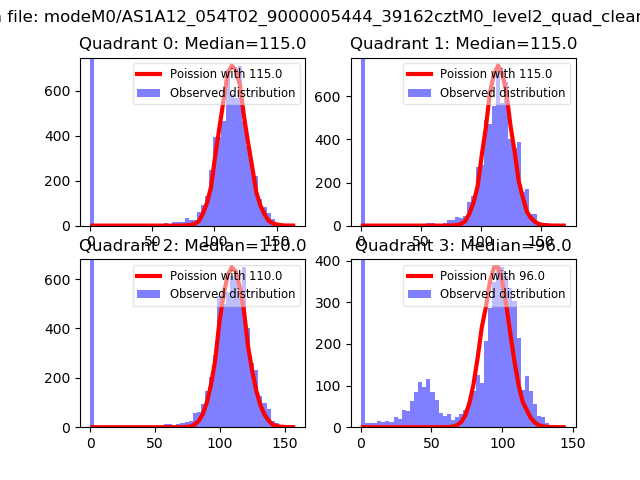 |
 |
| Quadrant-wise count rates Data is divided into 100 sec bins |
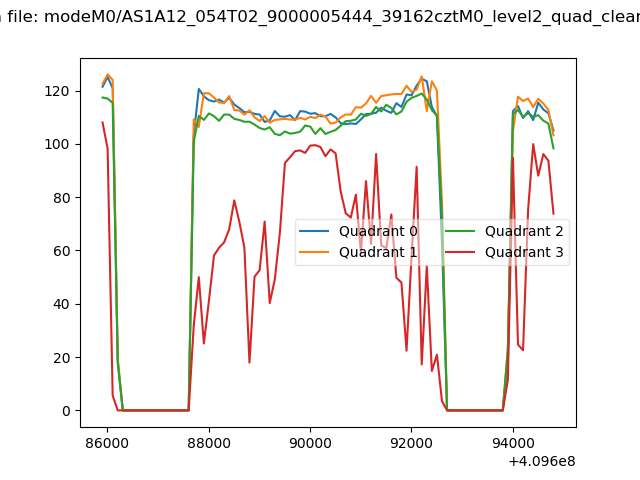 |
|
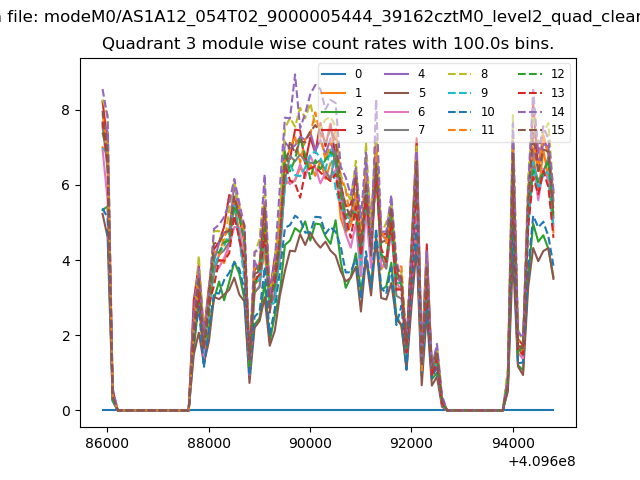
| Module-wise count rates for Quadrant A Data is divided into 100 sec bins |
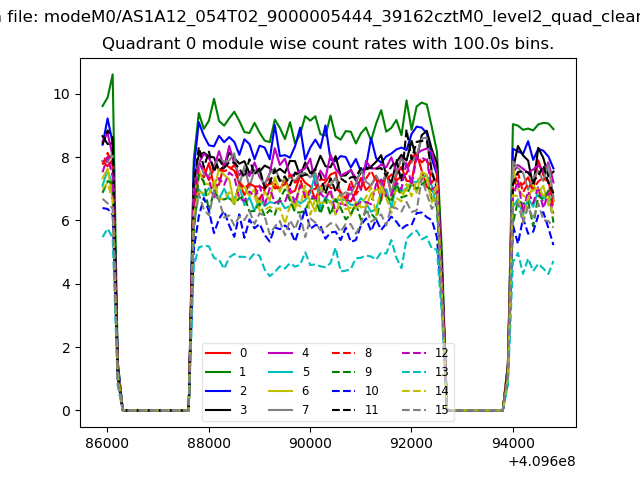 |
 |
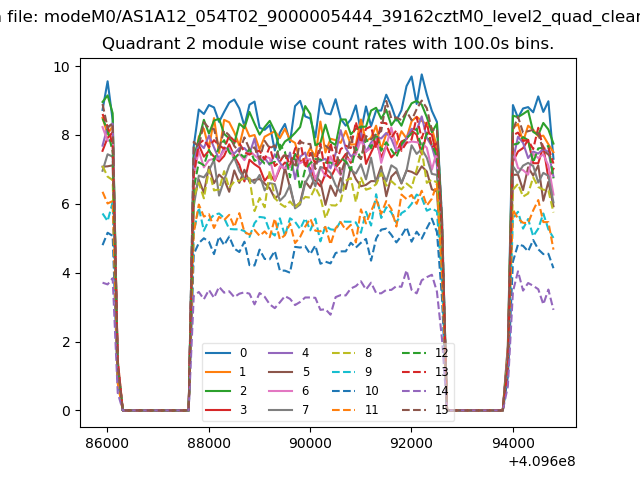
| Module-wise count rates for Quadrant B Data is divided into 100 sec bins |
 |
 |
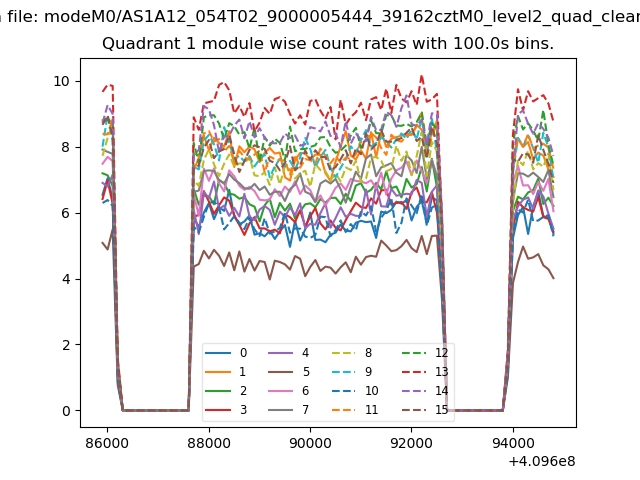
| Module-wise count rates for Quadrant C Data is divided into 100 sec bins |
 |
 |
| Module-wise count rates for Quadrant D Data is divided into 100 sec bins |
 |
 |
| Parameter | Plot |
|---|---|
| CZT HV Monitor | 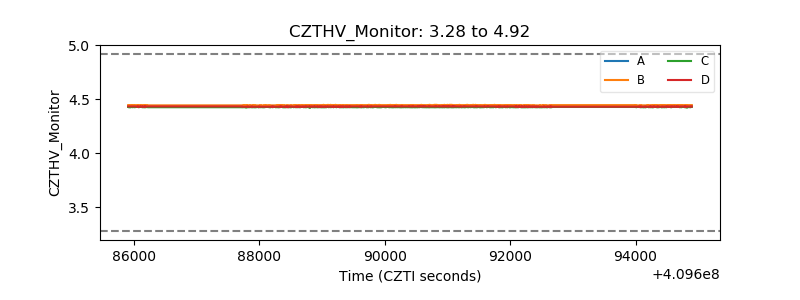 |
| D_VDD | 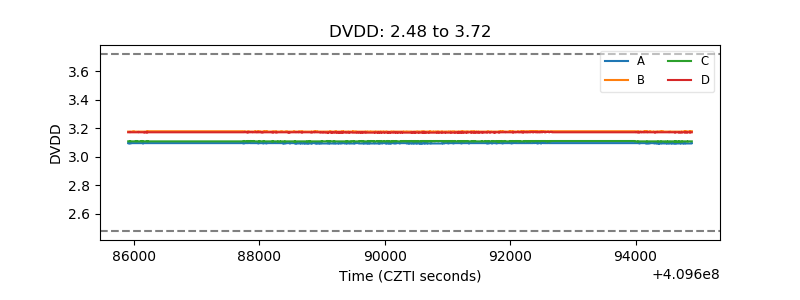 |
| Temperature 1 | 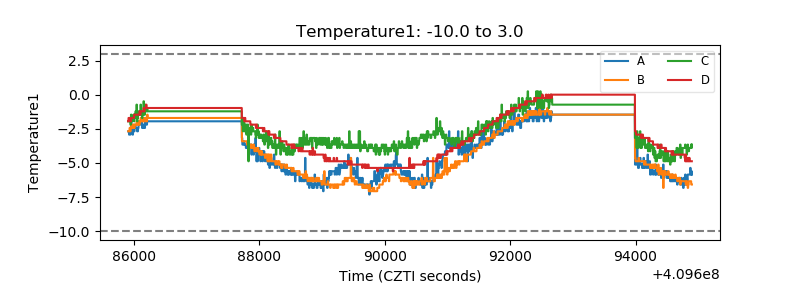 |
| Veto HV Monitor | 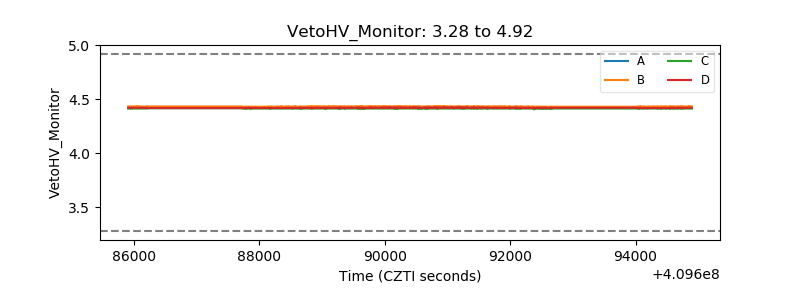 |
| Veto LLD | 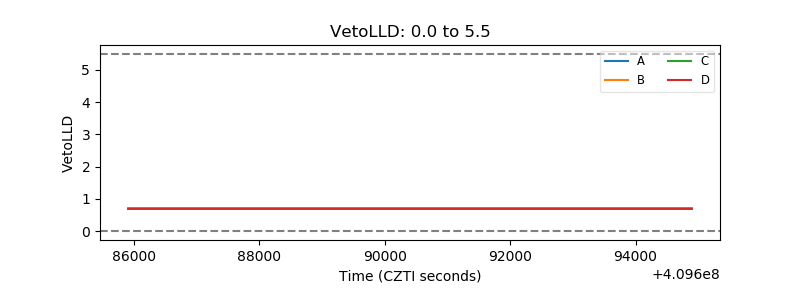 |
| Alpha Counter | 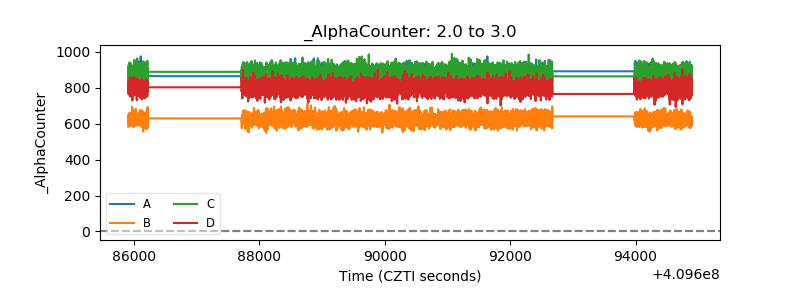 |
| _CPM_Rate | 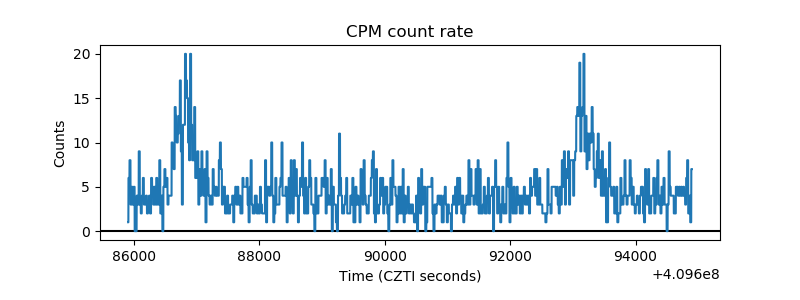 |
| CZT Counter | 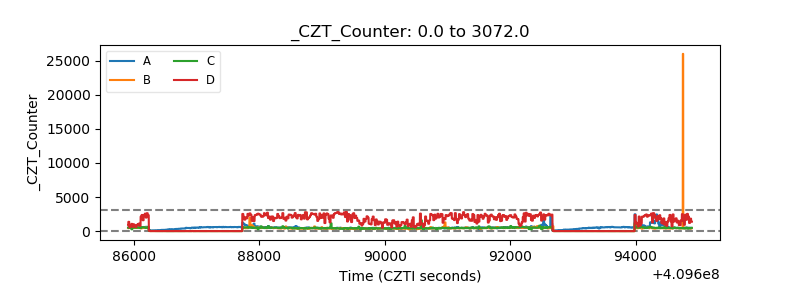 |
| +2.5 Volts monitor |  |
| +5 Volts monitor | 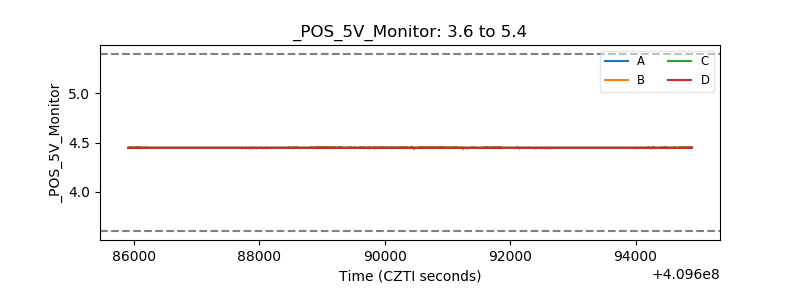 |
| _ROLL_ROT | 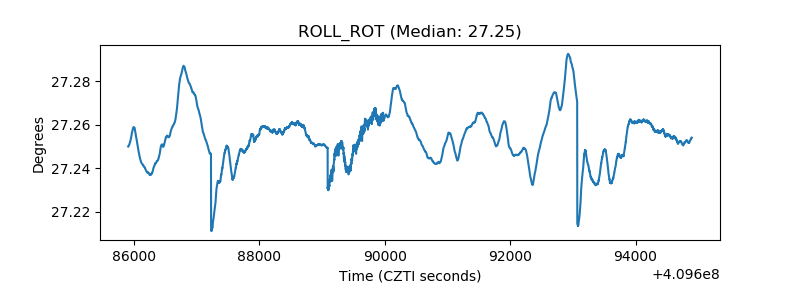 |
| _Roll_DEC |  |
| _Roll_RA | 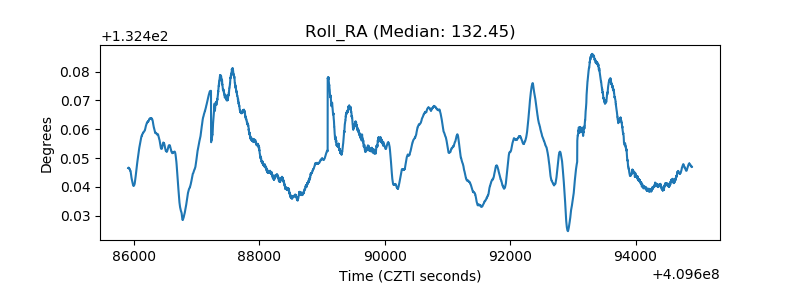 |
| Veto Counter | 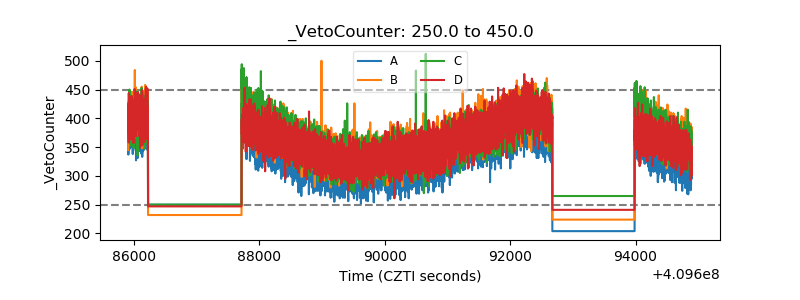 |