| Param | Original file | Final file |
|---|---|---|
| Filename | modeM0/AS1A12_054T02_9000005444_39163cztM0_level2.fits | modeM0/AS1A12_054T02_9000005444_39163cztM0_level2_quad_clean.evt |
| Size (bytes) | 524,649,600 | 90,921,600 |
| Size | 500.3 MB | 86.7 MB |
| Events in quadrant A | 3,371,660 | 655,534 |
| Events in quadrant B | 2,823,292 | 663,073 |
| Events in quadrant C | 2,797,989 | 637,728 |
| Events in quadrant D | 9,974,601 | 388,208 |
| Mode M9 | |||
|---|---|---|---|
| Quadrant | BADHDUFLAG | Total packets | Discarded packets |
| A | 0 | 26 | 0 |
| B | 0 | 26 | 0 |
| C | 0 | 26 | 0 |
| D | 0 | 26 | 0 |
| Mode M0 | |||
|---|---|---|---|
| Quadrant | BADHDUFLAG | Total packets | Discarded packets |
| A | 0 | 13849 | 3 |
| B | 0 | 12543 | 2 |
| C | 0 | 12057 | 2 |
| D | 0 | 33686 | 2 |
| Mode SS | |||
|---|---|---|---|
| Quadrant | BADHDUFLAG | Total packets | Discarded packets |
| A | 0 | 122 | 0 |
| B | 0 | 122 | 0 |
| C | 0 | 122 | 0 |
| D | 0 | 122 | 0 |
| Quadrant | Total seconds | Saturated seconds | Saturation percentage |
|---|---|---|---|
| A | 5836 | 97 | 1.662097% |
| B | 5836 | 87 | 1.490747% |
| C | 5836 | 7 | 0.119945% |
| D | 5836 | 2227 | 38.159698% |
Noise dominated data is calculated using 1-second bins in cleaned event files. If a bin has >2000 counts, and if more than 50% of those come from <1% of pixels, then it is considered to be noise-dominated and hence unusable.
| Quadrant | # 1 sec bins | Bins with >0 counts | Bins with >2000 counts | High rate bins dominated by noise | Noise dominated (total time) | Noise dominated (detector-on time) | Marked lightcurve |
|---|---|---|---|---|---|---|---|
| A | 8462 | 5838 | 66 | 66 | 0.78% | 1.13% | 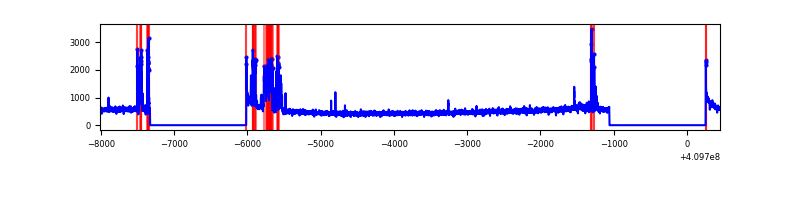 |
| B | 8462 | 5838 | 40 | 40 | 0.47% | 0.69% | 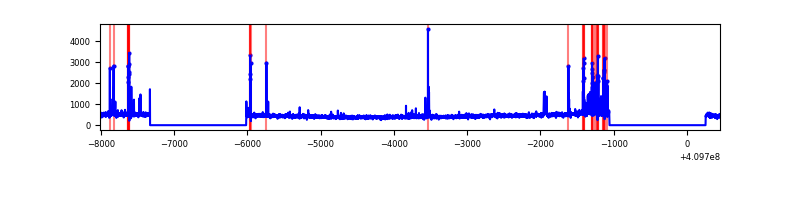 |
| C | 8462 | 5838 | 1 | 1 | 0.01% | 0.02% | 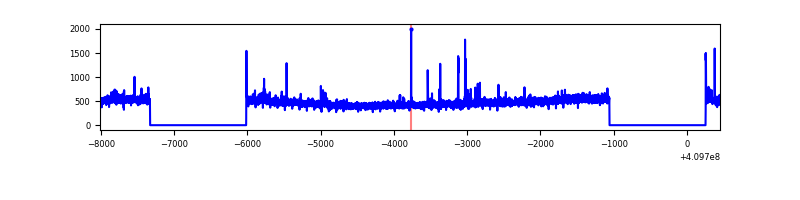 |
| D | 8462 | 5838 | 1859 | 1859 | 21.97% | 31.84% | 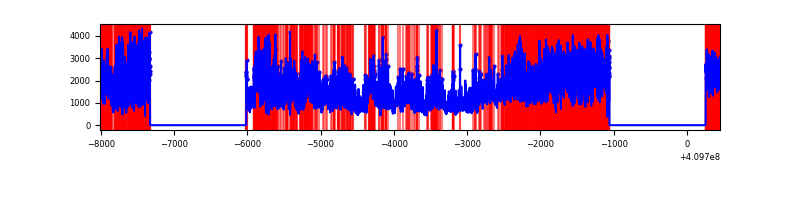 |
Top three noisy pixels from each quadrant. If the there are fewer than three noisy pixels in the level2.evt file, extra rows are filled as -1
| Pixel properties | Quadrant properties | ||||||
|---|---|---|---|---|---|---|---|
| Quadrant | DetID | PixID | Counts | Sigma | Mean | Median | Sigma |
| A | 10 | 83 | 438162 | 3279.66 | 655 | 642 | 133.4 |
| A | 2 | 79 | 247423 | 1849.88 | 655 | 642 | 133.4 |
| A | 13 | 248 | 143483 | 1070.74 | 655 | 642 | 133.4 |
| B | 5 | 172 | 262045 | 2086.14 | 645 | 626 | 125.3 |
| B | 12 | 111 | 15804 | 121.12 | 645 | 626 | 125.3 |
| B | 11 | 111 | 14281 | 108.97 | 645 | 626 | 125.3 |
| C | 15 | 214 | 238984 | 1611.79 | 634 | 636 | 147.9 |
| C | 9 | 187 | 77259 | 518.15 | 634 | 636 | 147.9 |
| C | 0 | 10 | 6043 | 36.56 | 634 | 636 | 147.9 |
| D | 12 | 235 | 7385920 | 55624.9 | 537 | 520 | 132.8 |
| D | 13 | 171 | 179180 | 1345.62 | 537 | 520 | 132.8 |
| D | 2 | 249 | 138057 | 1035.89 | 537 | 520 | 132.8 |
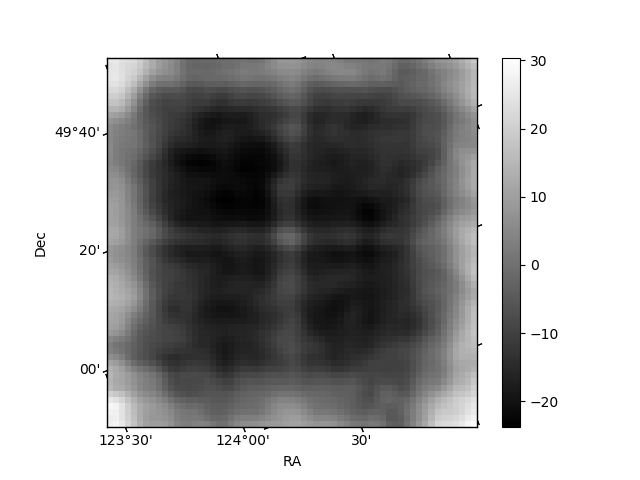
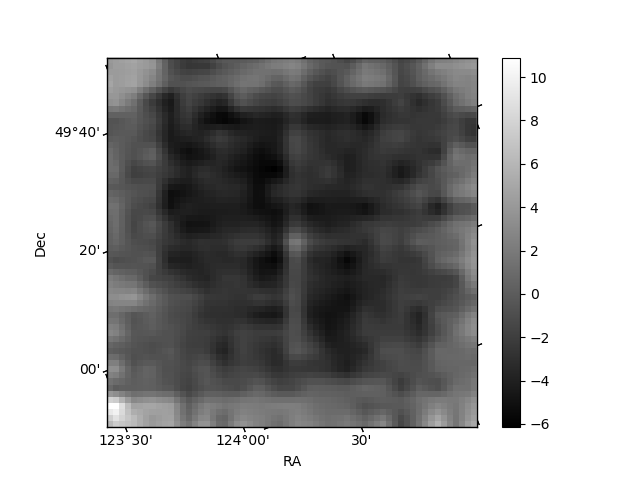
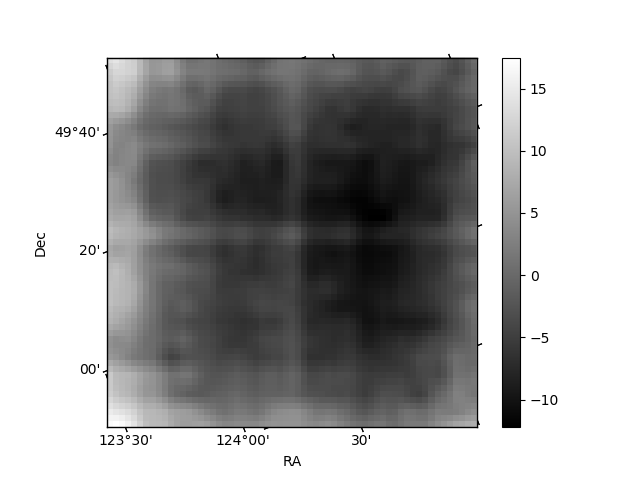
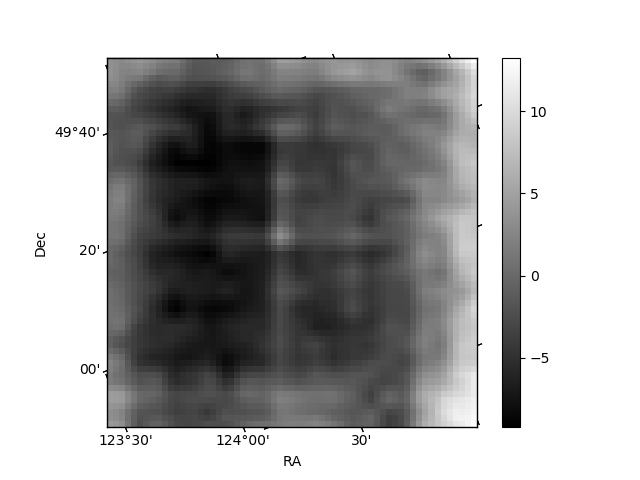
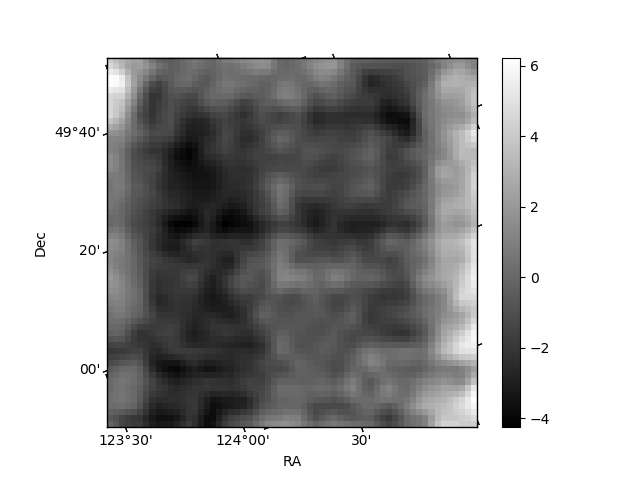
Histogram calculated using DETX and DETY for each event in the final _common_clean file
| Quadrant A | 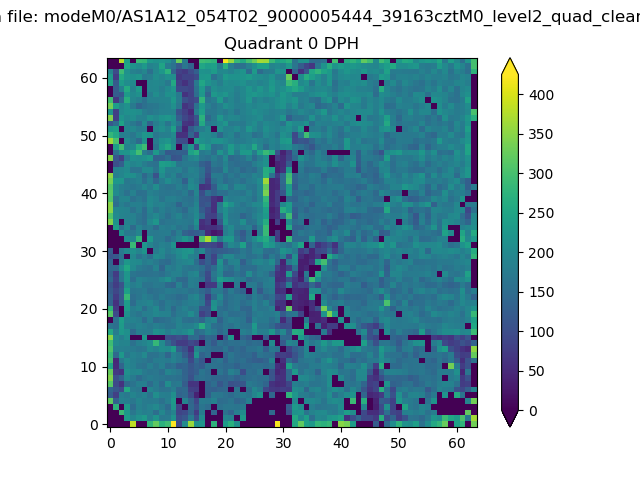 |
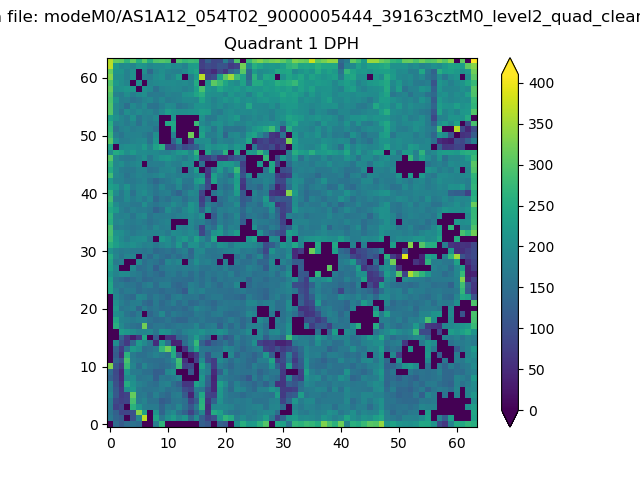 |
Quadrant B |
|---|---|---|---|
| Quadrant D | 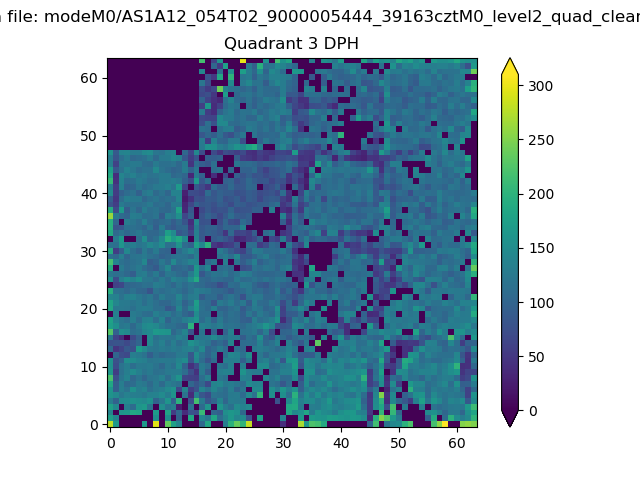 |
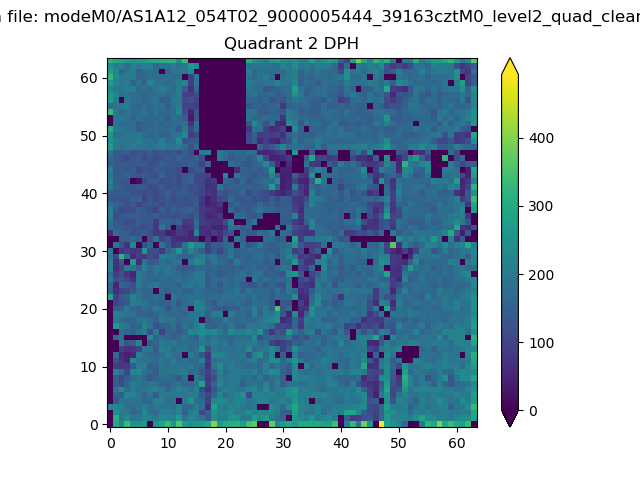 |
Quadrant C |
| Plot type | Count rate plots | Images |
|---|---|---|
| Comparison with Poisson distribution Blue bars denote a histogram of data divided into 1 sec bins. Red curve is a Poisson curve with rate = median count rate of data. |
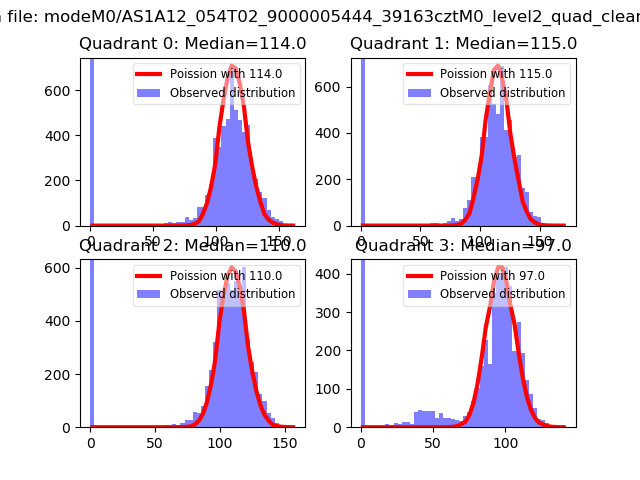 |
 |
| Quadrant-wise count rates Data is divided into 100 sec bins |
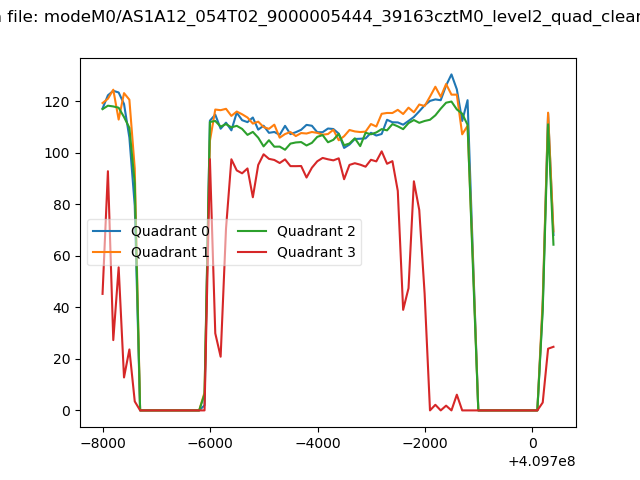 |
|
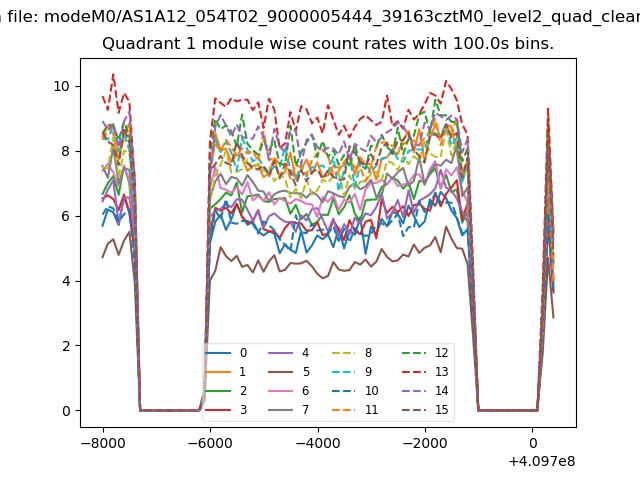
| Module-wise count rates for Quadrant A Data is divided into 100 sec bins |
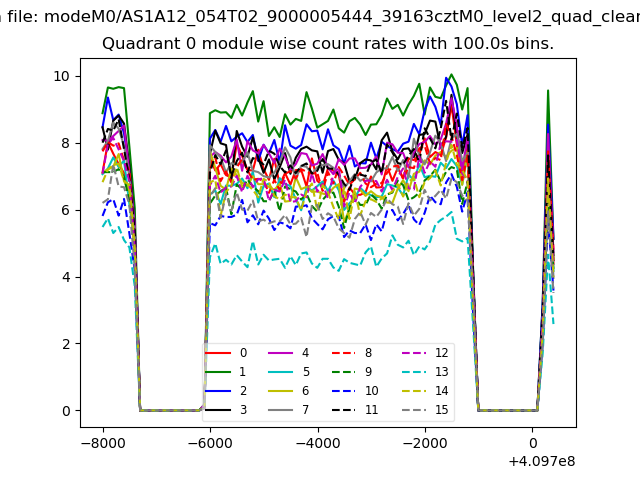 |
 |
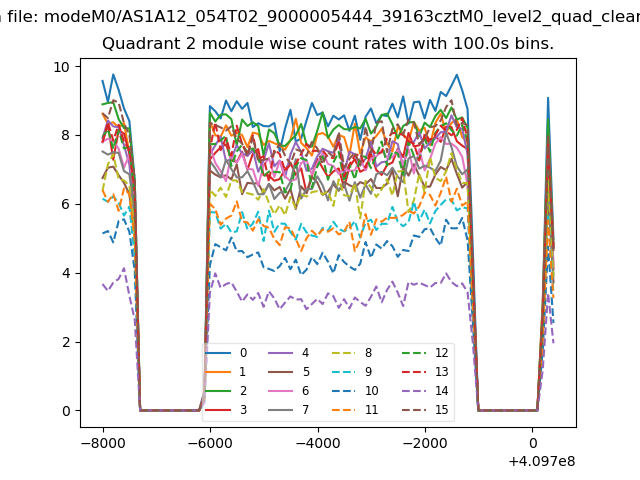
| Module-wise count rates for Quadrant B Data is divided into 100 sec bins |
 |
 |
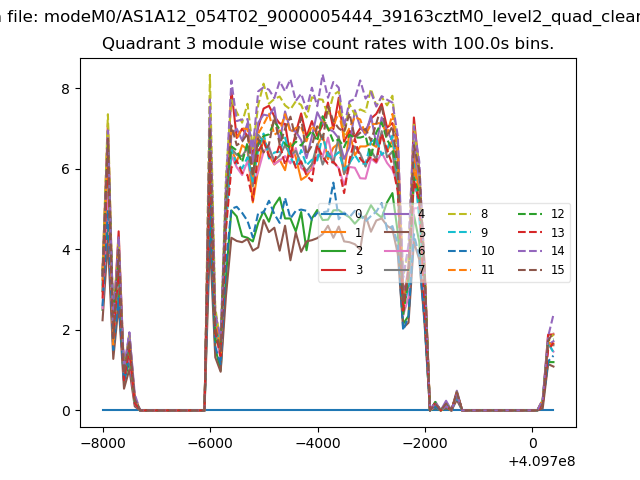
| Module-wise count rates for Quadrant C Data is divided into 100 sec bins |
 |
 |
| Module-wise count rates for Quadrant D Data is divided into 100 sec bins |
 |
 |
| Parameter | Plot |
|---|---|
| CZT HV Monitor | 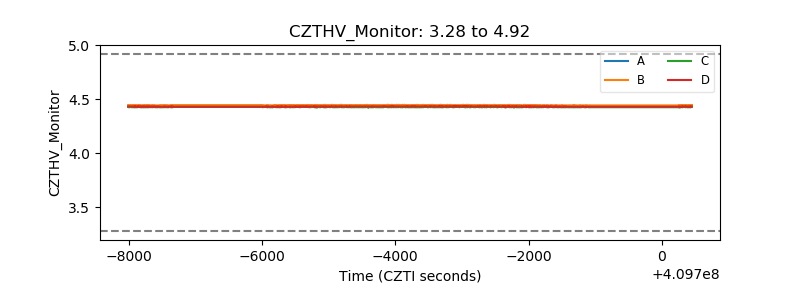 |
| D_VDD | 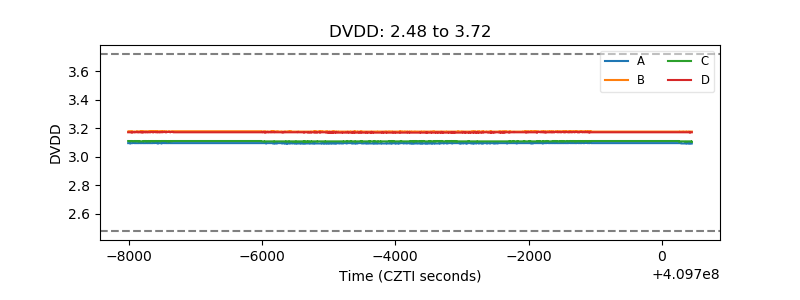 |
| Temperature 1 | 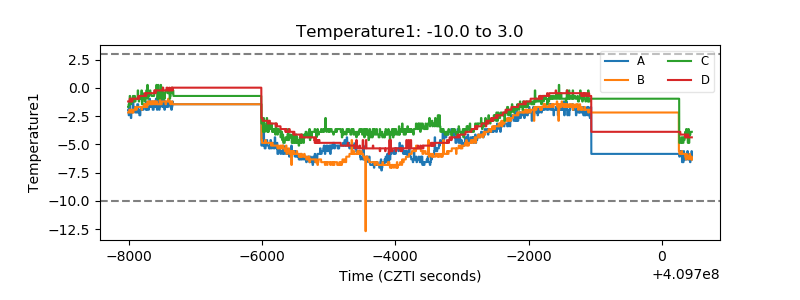 |
| Veto HV Monitor | 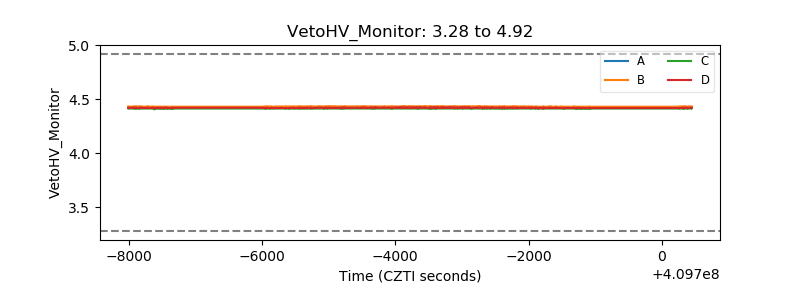 |
| Veto LLD | 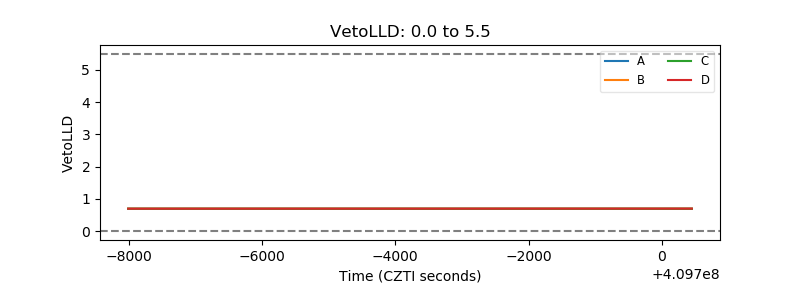 |
| Alpha Counter | 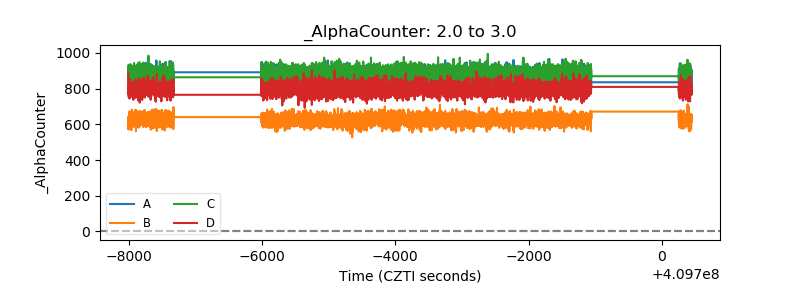 |
| _CPM_Rate | 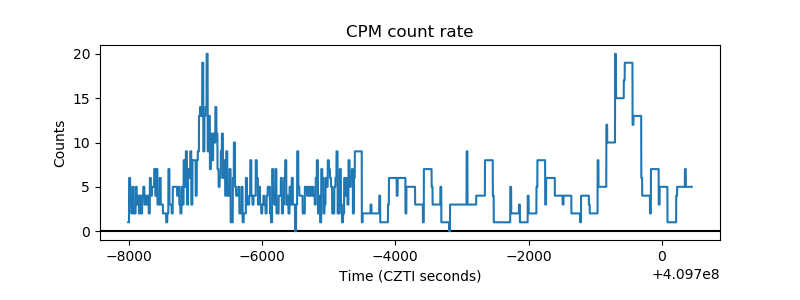 |
| CZT Counter |  |
| +2.5 Volts monitor | 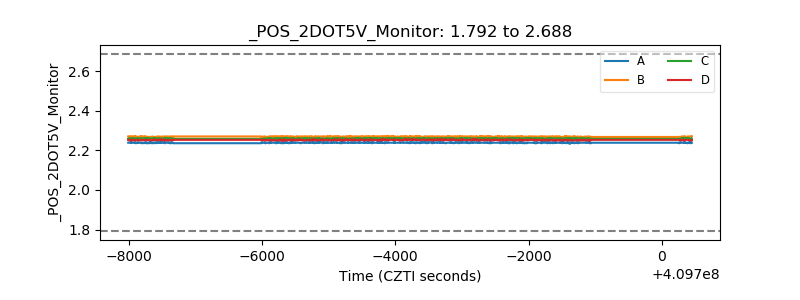 |
| +5 Volts monitor | 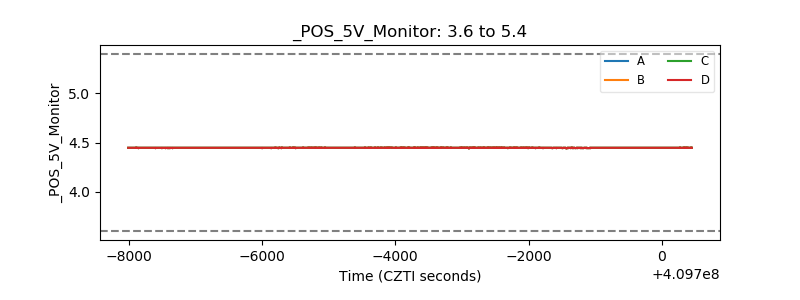 |
| _ROLL_ROT | 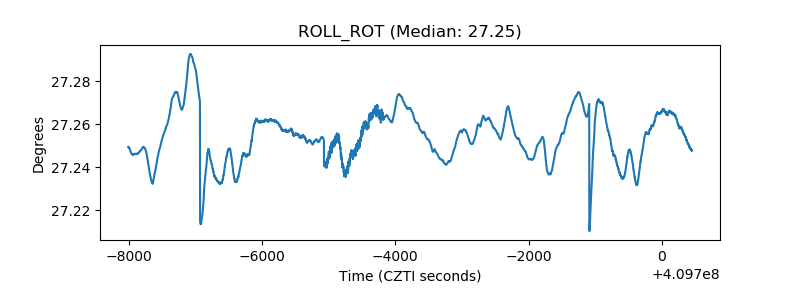 |
| _Roll_DEC |  |
| _Roll_RA | 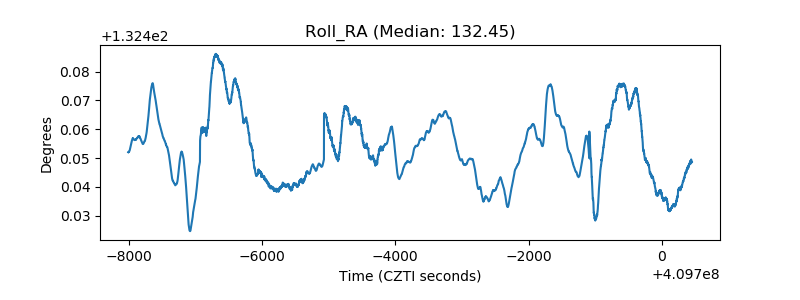 |
| Veto Counter | 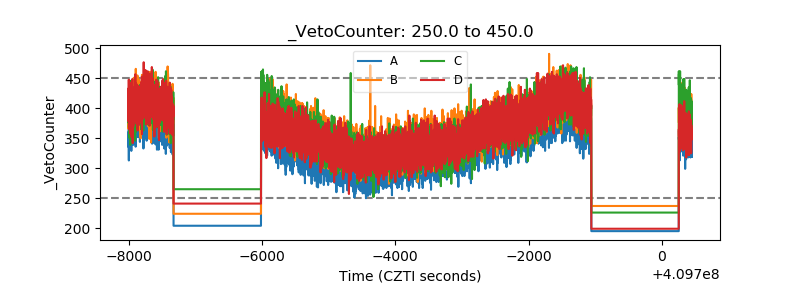 |