| Param | Original file | Final file |
|---|---|---|
| Filename | modeM0/AS1A12_054T02_9000005444_39165cztM0_level2.fits | modeM0/AS1A12_054T02_9000005444_39165cztM0_level2_quad_clean.evt |
| Size (bytes) | 979,214,400 | 162,057,600 |
| Size | 933.9 MB | 154.6 MB |
| Events in quadrant A | 5,652,418 | 1,174,149 |
| Events in quadrant B | 4,728,464 | 1,204,695 |
| Events in quadrant C | 5,266,893 | 1,144,068 |
| Events in quadrant D | 19,770,496 | 642,039 |
| Mode M9 | |||
|---|---|---|---|
| Quadrant | BADHDUFLAG | Total packets | Discarded packets |
| A | 0 | 37 | 0 |
| B | 0 | 37 | 0 |
| C | 0 | 37 | 0 |
| D | 0 | 38 | 0 |
| Mode M0 | |||
|---|---|---|---|
| Quadrant | BADHDUFLAG | Total packets | Discarded packets |
| A | 0 | 23748 | 4 |
| B | 0 | 21922 | 3 |
| C | 0 | 22745 | 3 |
| D | 0 | 66172 | 3 |
| Mode SS | |||
|---|---|---|---|
| Quadrant | BADHDUFLAG | Total packets | Discarded packets |
| A | 0 | 218 | 0 |
| B | 0 | 218 | 0 |
| C | 0 | 218 | 0 |
| D | 0 | 218 | 0 |
| Quadrant | Total seconds | Saturated seconds | Saturation percentage |
|---|---|---|---|
| A | 10708 | 152 | 1.419499% |
| B | 10708 | 36 | 0.336197% |
| C | 10708 | 39 | 0.364214% |
| D | 10708 | 4767 | 44.518117% |
Noise dominated data is calculated using 1-second bins in cleaned event files. If a bin has >2000 counts, and if more than 50% of those come from <1% of pixels, then it is considered to be noise-dominated and hence unusable.
| Quadrant | # 1 sec bins | Bins with >0 counts | Bins with >2000 counts | High rate bins dominated by noise | Noise dominated (total time) | Noise dominated (detector-on time) | Marked lightcurve |
|---|---|---|---|---|---|---|---|
| A | 13544 | 10710 | 78 | 78 | 0.58% | 0.73% | 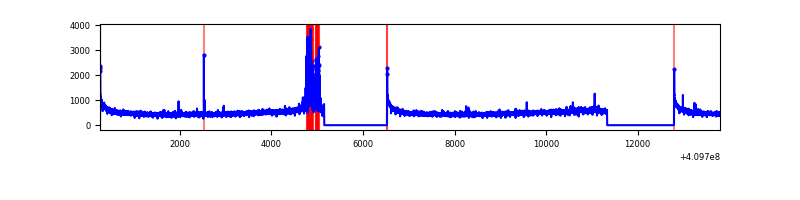 |
| B | 13544 | 10710 | 8 | 8 | 0.06% | 0.07% | 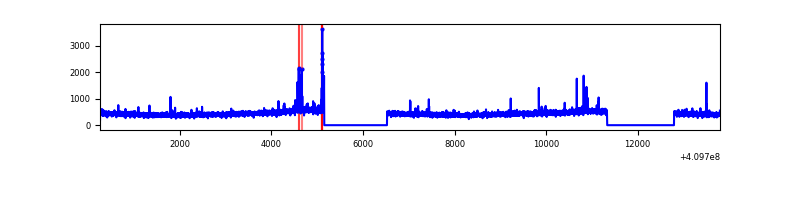 |
| C | 13544 | 10710 | 16 | 16 | 0.12% | 0.15% | 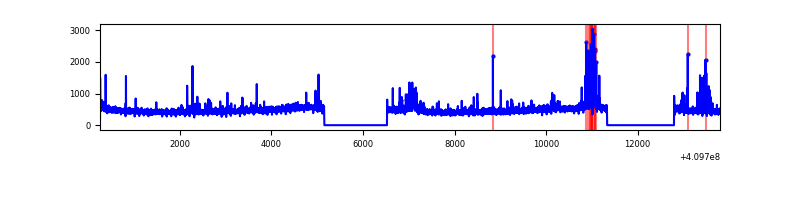 |
| D | 13544 | 10710 | 4423 | 4423 | 32.66% | 41.30% | 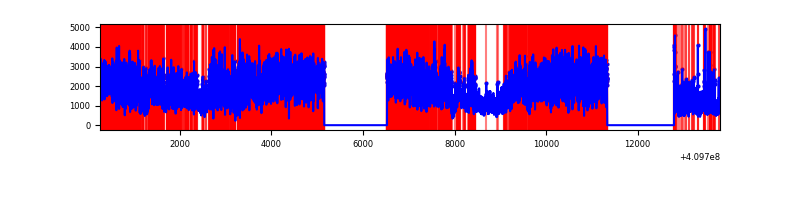 |
Top three noisy pixels from each quadrant. If the there are fewer than three noisy pixels in the level2.evt file, extra rows are filled as -1
| Pixel properties | Quadrant properties | ||||||
|---|---|---|---|---|---|---|---|
| Quadrant | DetID | PixID | Counts | Sigma | Mean | Median | Sigma |
| A | 10 | 83 | 762405 | 3196.77 | 1172 | 1149 | 238.1 |
| A | 13 | 248 | 319650 | 1337.49 | 1172 | 1149 | 238.1 |
| A | 2 | 79 | 19879 | 78.65 | 1172 | 1149 | 238.1 |
| B | 5 | 172 | 96154 | 425.72 | 1165 | 1133 | 223.2 |
| B | 12 | 111 | 28382 | 122.08 | 1165 | 1133 | 223.2 |
| B | 11 | 111 | 26247 | 112.52 | 1165 | 1133 | 223.2 |
| C | 15 | 214 | 443109 | 1669.08 | 1138 | 1144 | 264.8 |
| C | 9 | 187 | 373379 | 1405.74 | 1138 | 1144 | 264.8 |
| C | 13 | 61 | 7848 | 25.32 | 1138 | 1144 | 264.8 |
| D | 12 | 235 | 15178312 | 65635.49 | 943 | 914 | 231.2 |
| D | 2 | 249 | 334636 | 1443.2 | 943 | 914 | 231.2 |
| D | 13 | 171 | 286042 | 1233.05 | 943 | 914 | 231.2 |
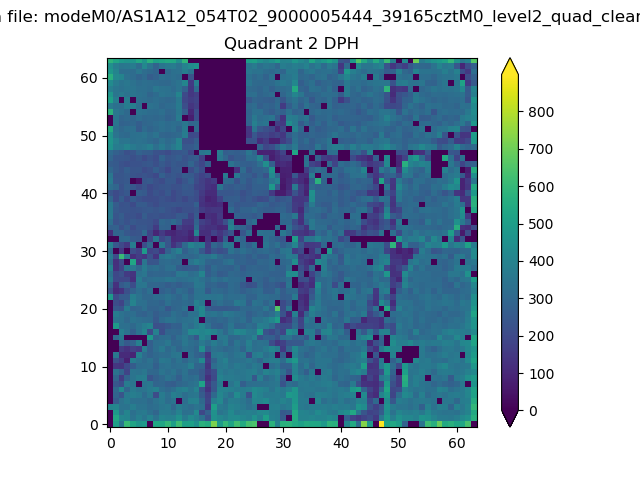
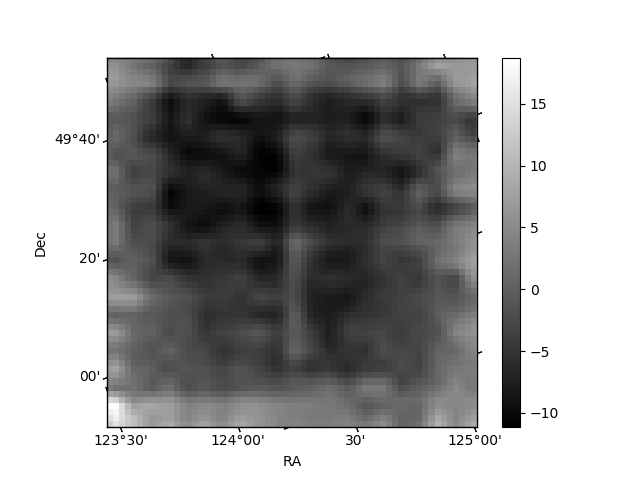
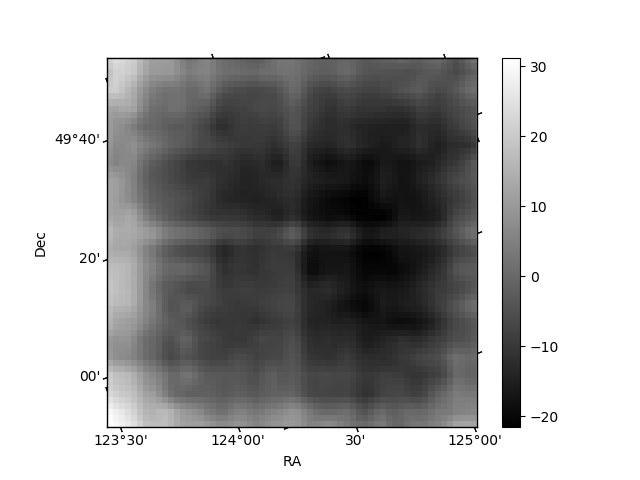
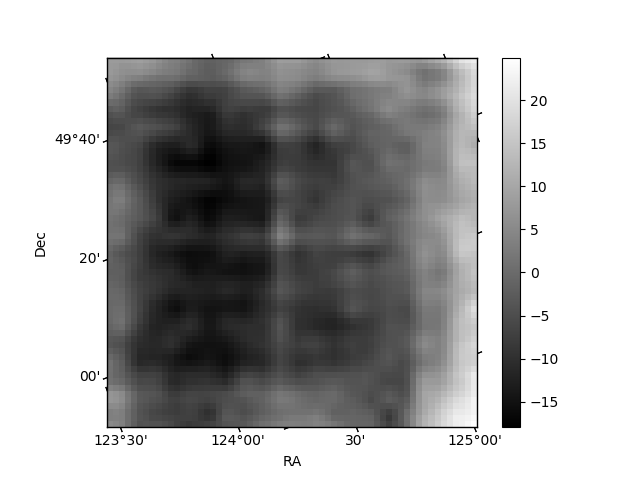
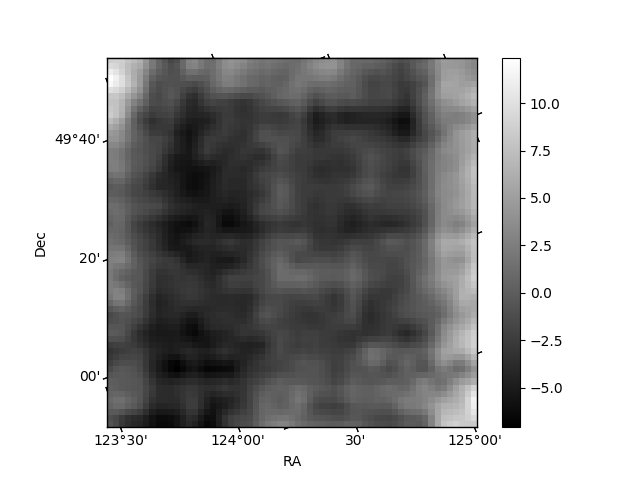
Histogram calculated using DETX and DETY for each event in the final _common_clean file
| Quadrant A | 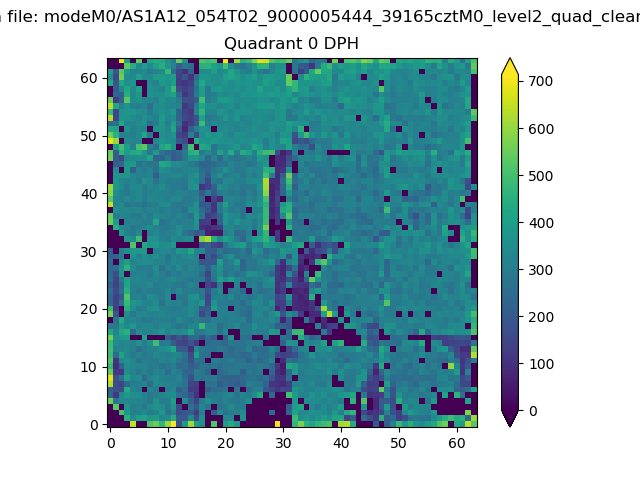 |
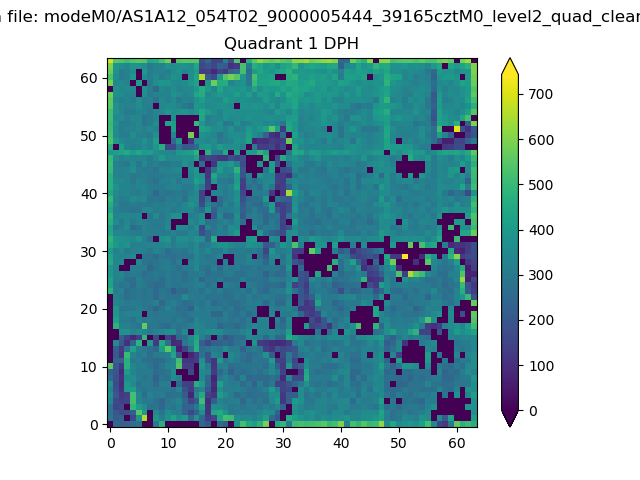 |
Quadrant B |
|---|---|---|---|
| Quadrant D | 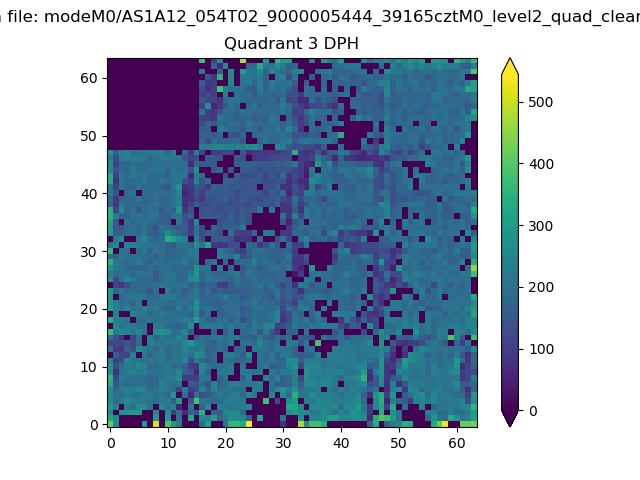 |
 |
Quadrant C |
| Plot type | Count rate plots | Images |
|---|---|---|
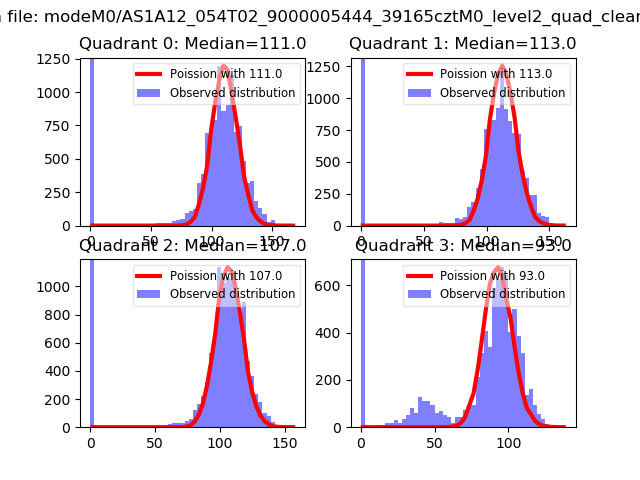
| Comparison with Poisson distribution Blue bars denote a histogram of data divided into 1 sec bins. Red curve is a Poisson curve with rate = median count rate of data. |
 |
 |
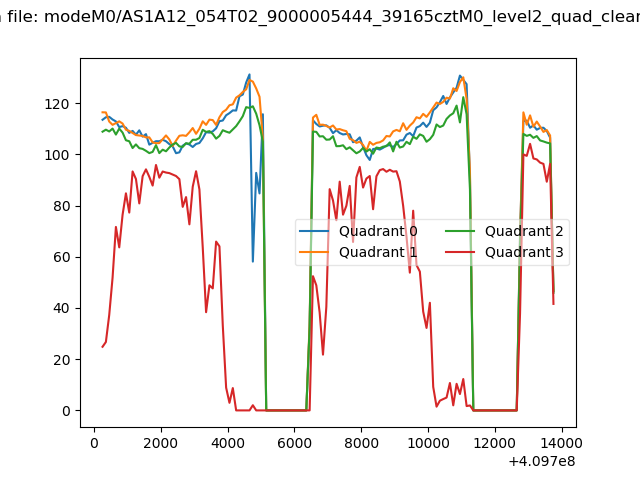
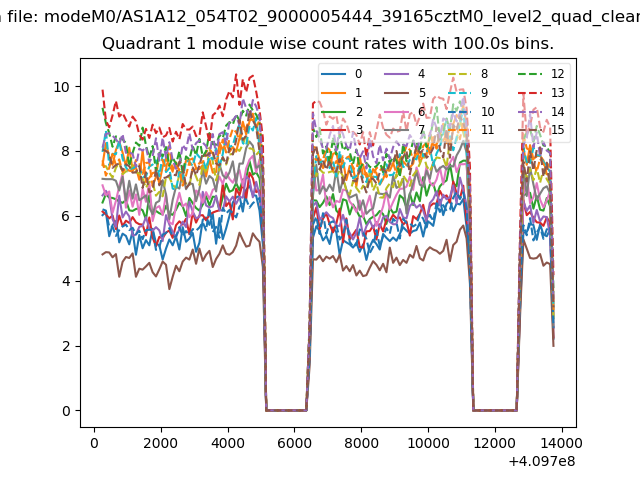
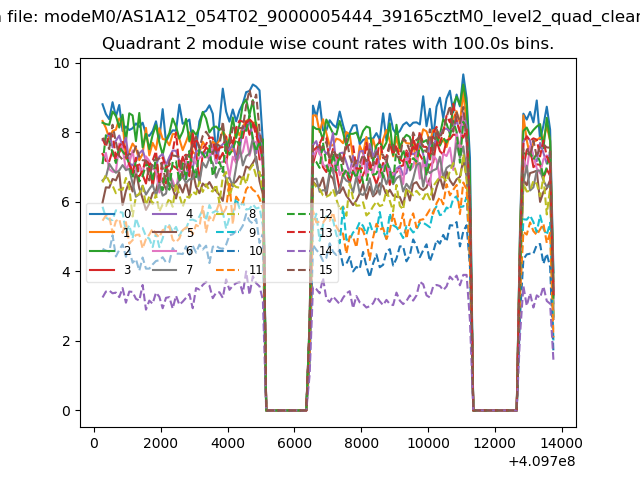
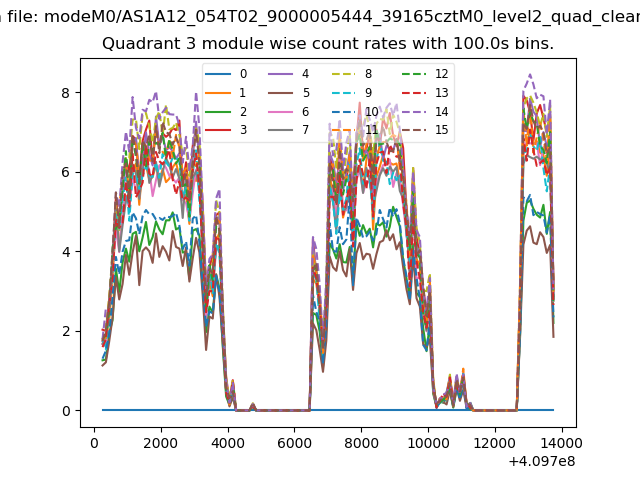
| Quadrant-wise count rates Data is divided into 100 sec bins |
 |
|
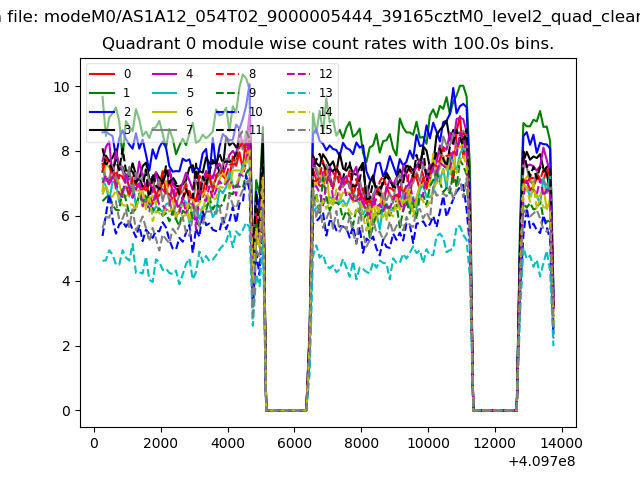
| Module-wise count rates for Quadrant A Data is divided into 100 sec bins |
 |
 |
| Module-wise count rates for Quadrant B Data is divided into 100 sec bins |
 |
 |
| Module-wise count rates for Quadrant C Data is divided into 100 sec bins |
 |
 |
| Module-wise count rates for Quadrant D Data is divided into 100 sec bins |
 |
 |
| Parameter | Plot |
|---|---|
| CZT HV Monitor | 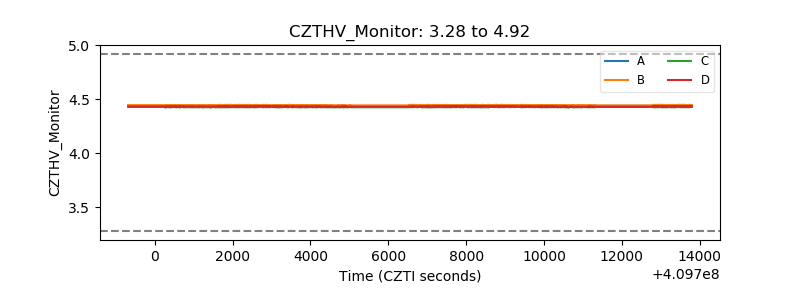 |
| D_VDD | 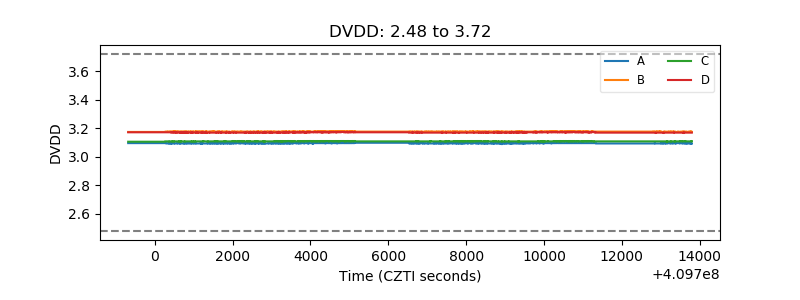 |
| Temperature 1 | 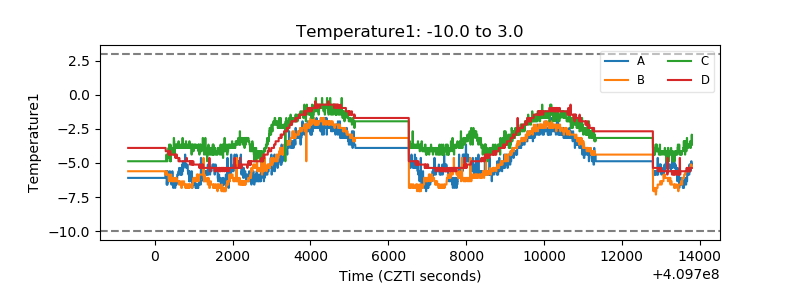 |
| Veto HV Monitor | 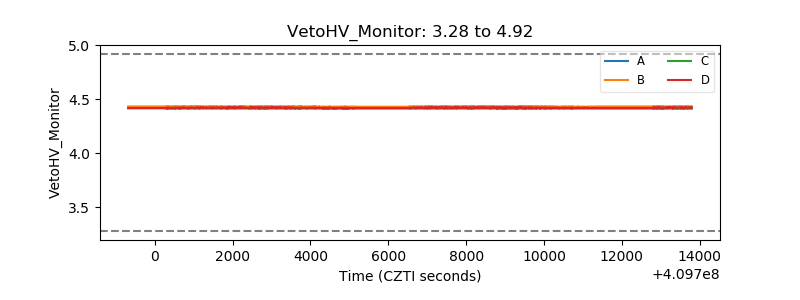 |
| Veto LLD | 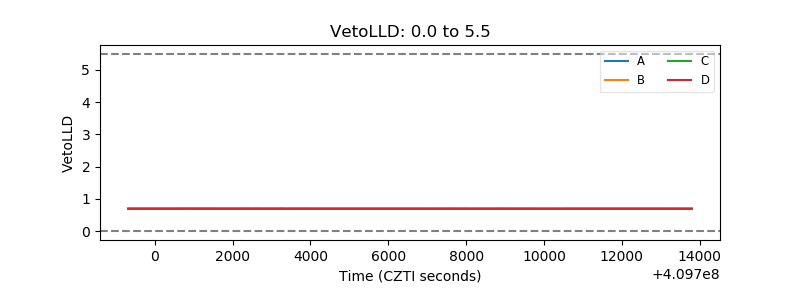 |
| Alpha Counter | 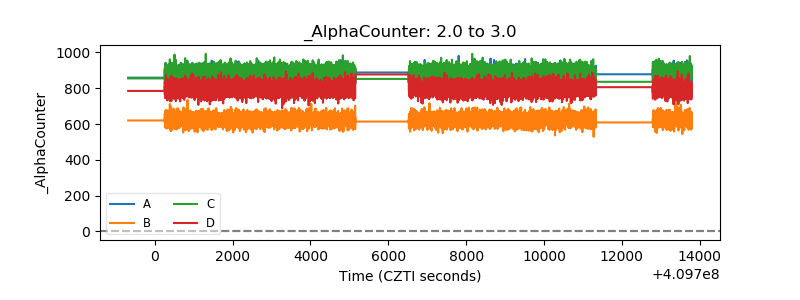 |
| _CPM_Rate | 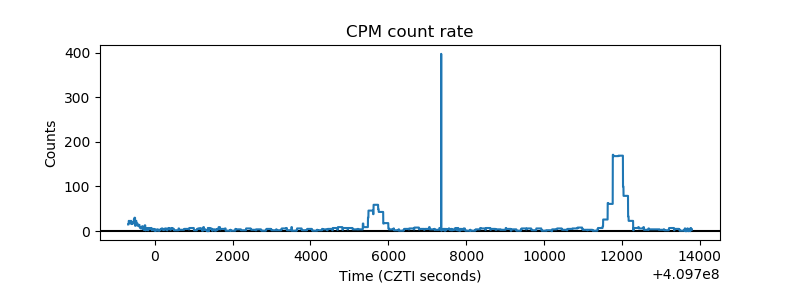 |
| CZT Counter | 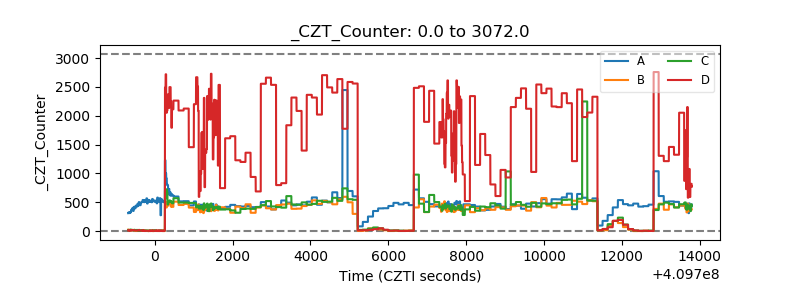 |
| +2.5 Volts monitor |  |
| +5 Volts monitor | 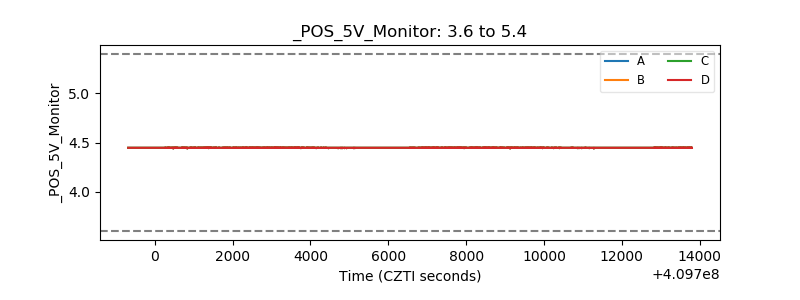 |
| _ROLL_ROT | 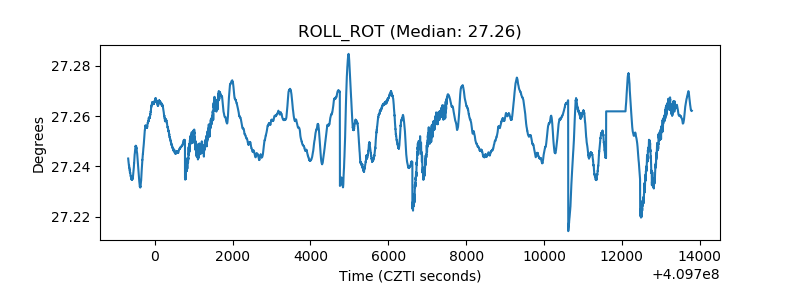 |
| _Roll_DEC | 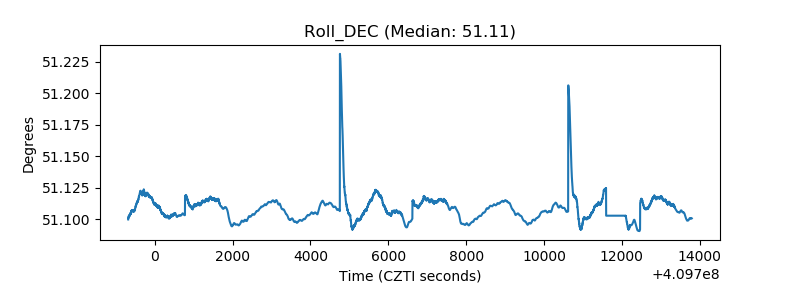 |
| _Roll_RA | 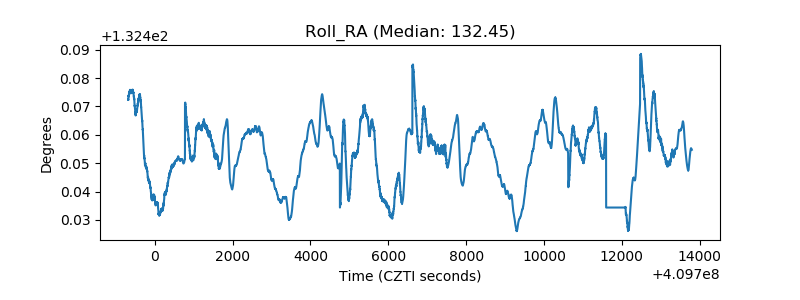 |
| Veto Counter | 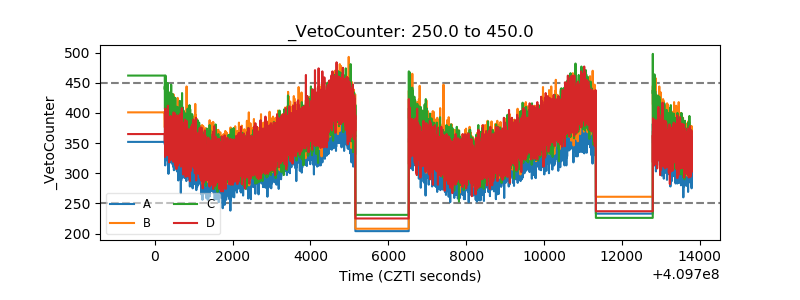 |