| Param | Original file | Final file |
|---|---|---|
| Filename | modeM0/AS1A12_054T02_9000005444_39166cztM0_level2.fits | modeM0/AS1A12_054T02_9000005444_39166cztM0_level2_quad_clean.evt |
| Size (bytes) | 539,487,360 | 96,001,920 |
| Size | 514.5 MB | 91.6 MB |
| Events in quadrant A | 3,185,130 | 694,976 |
| Events in quadrant B | 2,732,922 | 707,275 |
| Events in quadrant C | 3,240,583 | 668,295 |
| Events in quadrant D | 10,331,087 | 403,844 |
| Mode M9 | |||
|---|---|---|---|
| Quadrant | BADHDUFLAG | Total packets | Discarded packets |
| A | 0 | 30 | 0 |
| B | 0 | 30 | 0 |
| C | 0 | 30 | 0 |
| D | 0 | 30 | 0 |
| Mode M0 | |||
|---|---|---|---|
| Quadrant | BADHDUFLAG | Total packets | Discarded packets |
| A | 0 | 13302 | 3 |
| B | 0 | 12481 | 2 |
| C | 0 | 13628 | 2 |
| D | 0 | 34983 | 2 |
| Mode SS | |||
|---|---|---|---|
| Quadrant | BADHDUFLAG | Total packets | Discarded packets |
| A | 0 | 130 | 0 |
| B | 0 | 130 | 0 |
| C | 0 | 130 | 0 |
| D | 0 | 130 | 0 |
| Quadrant | Total seconds | Saturated seconds | Saturation percentage |
|---|---|---|---|
| A | 6182 | 15 | 0.242640% |
| B | 6182 | 13 | 0.210288% |
| C | 6182 | 62 | 1.002912% |
| D | 6182 | 2307 | 37.318020% |
Noise dominated data is calculated using 1-second bins in cleaned event files. If a bin has >2000 counts, and if more than 50% of those come from <1% of pixels, then it is considered to be noise-dominated and hence unusable.
| Quadrant | # 1 sec bins | Bins with >0 counts | Bins with >2000 counts | High rate bins dominated by noise | Noise dominated (total time) | Noise dominated (detector-on time) | Marked lightcurve |
|---|---|---|---|---|---|---|---|
| A | 9227 | 6184 | 9 | 9 | 0.10% | 0.15% | 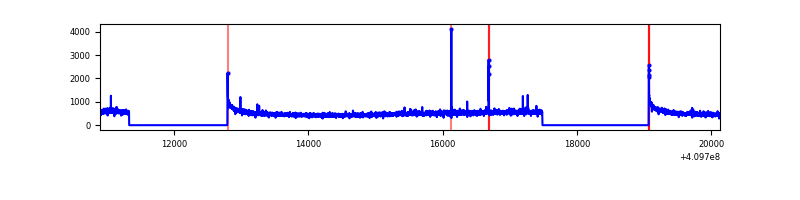 |
| B | 9227 | 6184 | 0 | 0 | 0.00% | 0.00% | 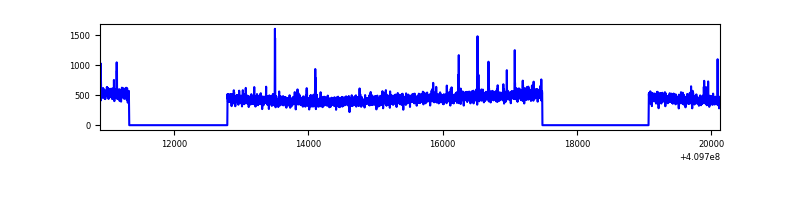 |
| C | 9227 | 6184 | 44 | 44 | 0.48% | 0.71% | 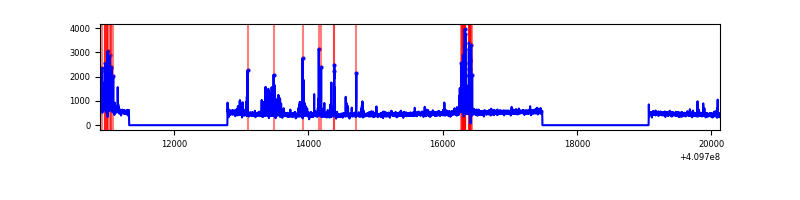 |
| D | 9227 | 6184 | 2071 | 2071 | 22.44% | 33.49% | 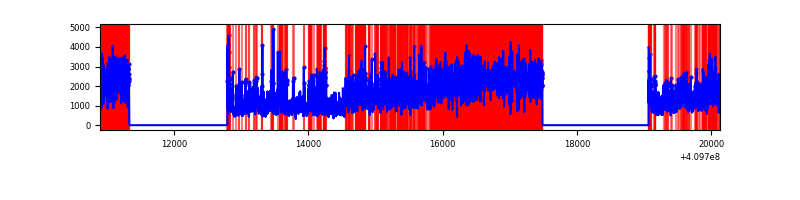 |
Top three noisy pixels from each quadrant. If the there are fewer than three noisy pixels in the level2.evt file, extra rows are filled as -1
| Pixel properties | Quadrant properties | ||||||
|---|---|---|---|---|---|---|---|
| Quadrant | DetID | PixID | Counts | Sigma | Mean | Median | Sigma |
| A | 10 | 83 | 473333 | 3391.57 | 689 | 674 | 139.4 |
| A | 13 | 248 | 24388 | 170.16 | 689 | 674 | 139.4 |
| A | 13 | 6 | 10725 | 72.12 | 689 | 674 | 139.4 |
| B | 12 | 111 | 16988 | 123.31 | 683 | 664 | 132.4 |
| B | 5 | 172 | 16821 | 122.04 | 683 | 664 | 132.4 |
| B | 11 | 111 | 15095 | 109.01 | 683 | 664 | 132.4 |
| C | 9 | 187 | 388316 | 2491.22 | 664 | 667 | 155.6 |
| C | 15 | 214 | 258158 | 1654.76 | 664 | 667 | 155.6 |
| C | 13 | 61 | 4493 | 24.59 | 664 | 667 | 155.6 |
| D | 12 | 235 | 5610316 | 42381.05 | 533 | 516 | 132.4 |
| D | 5 | 222 | 1482497 | 11196.11 | 533 | 516 | 132.4 |
| D | 12 | 227 | 611541 | 4616.19 | 533 | 516 | 132.4 |
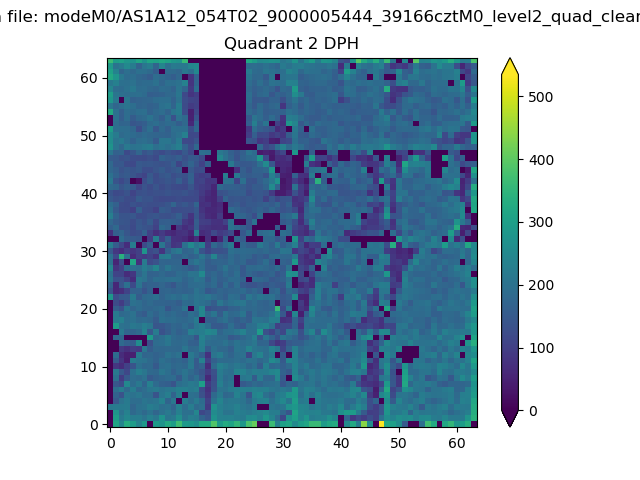
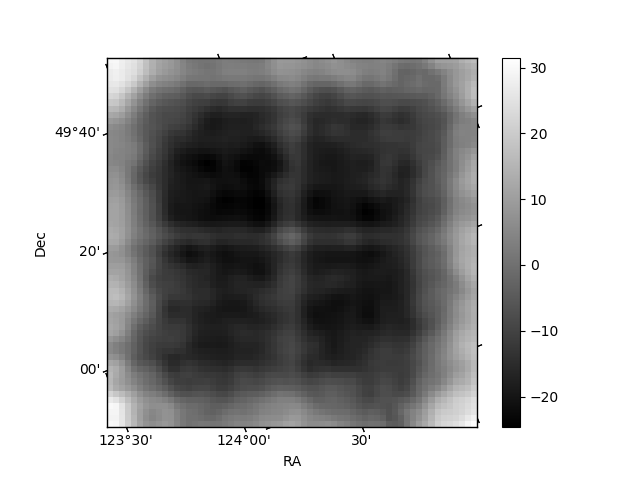
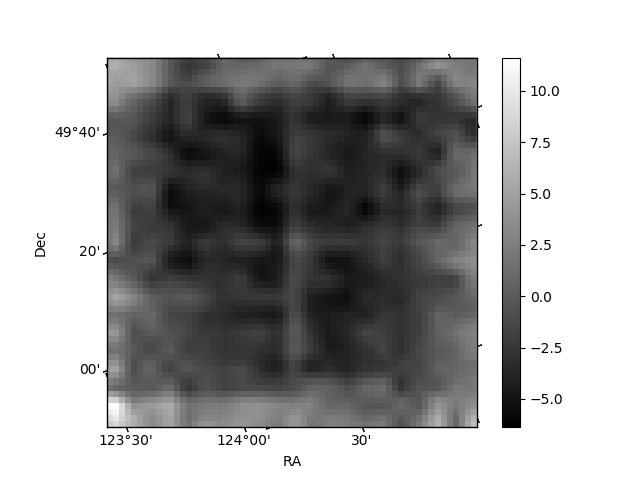
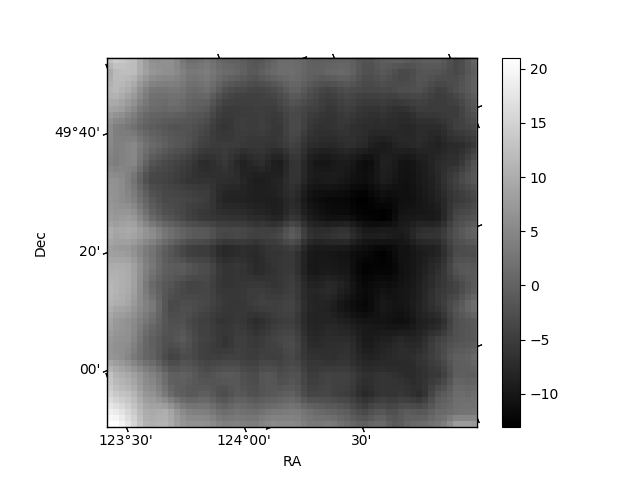
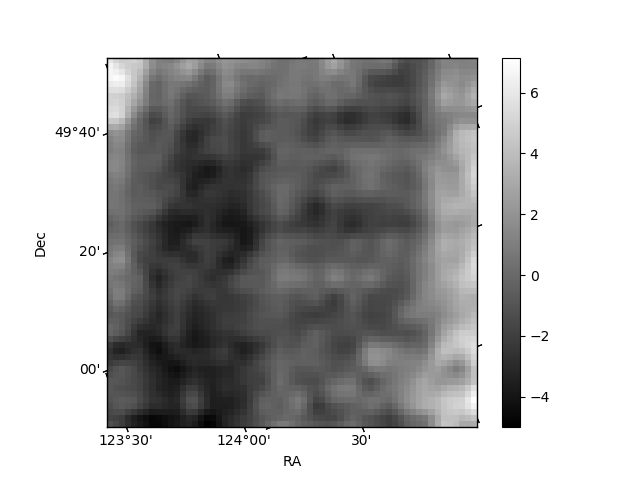
Histogram calculated using DETX and DETY for each event in the final _common_clean file
| Quadrant A | 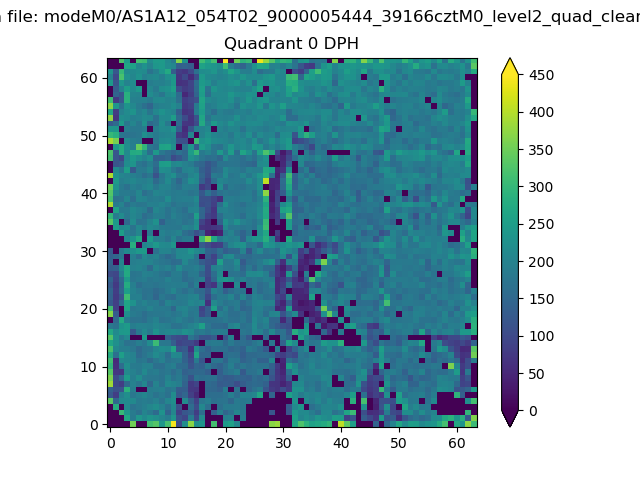 |
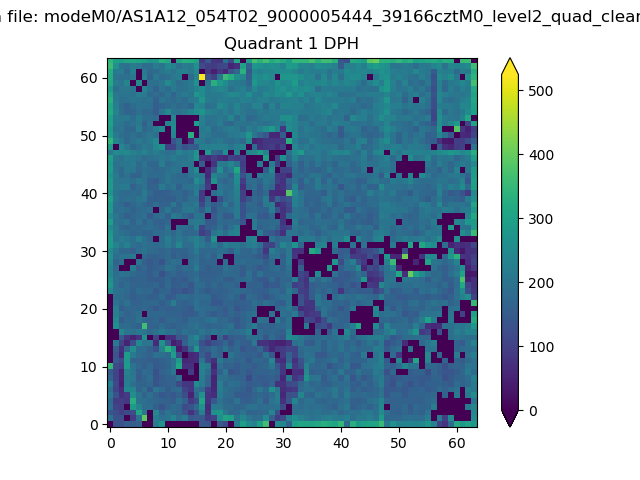 |
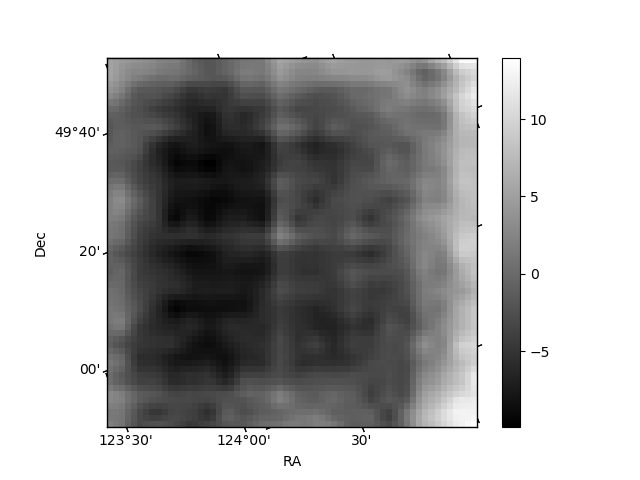
Quadrant B |
|---|---|---|---|
| Quadrant D | 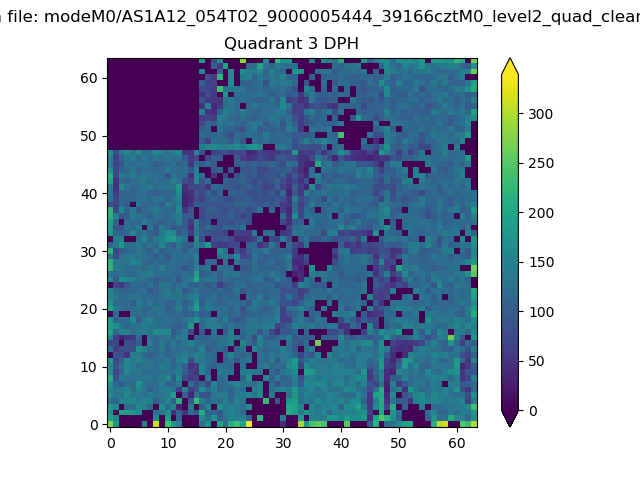 |
 |
Quadrant C |
| Plot type | Count rate plots | Images |
|---|---|---|
| Comparison with Poisson distribution Blue bars denote a histogram of data divided into 1 sec bins. Red curve is a Poisson curve with rate = median count rate of data. |
 |
 |
| Quadrant-wise count rates Data is divided into 100 sec bins |
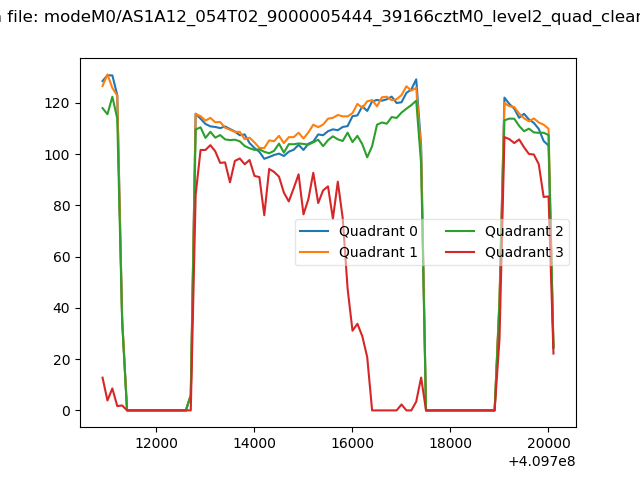 |
|
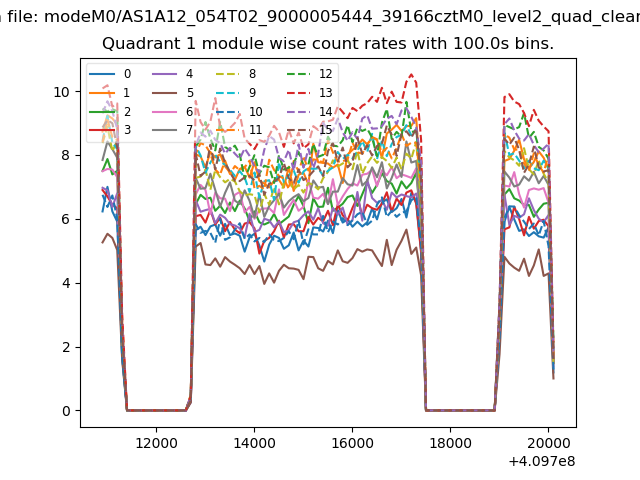
| Module-wise count rates for Quadrant A Data is divided into 100 sec bins |
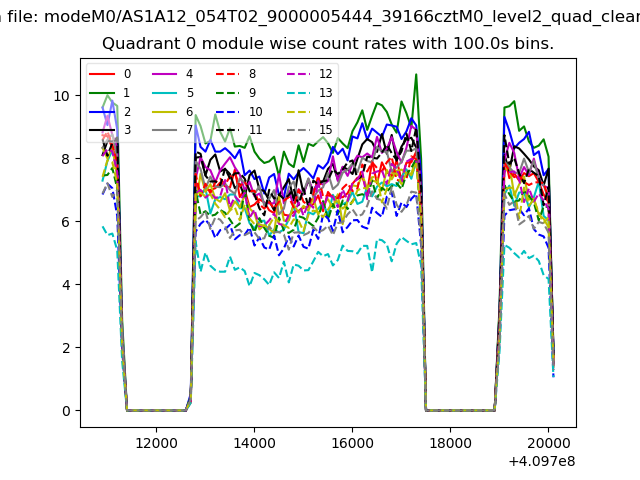 |
 |
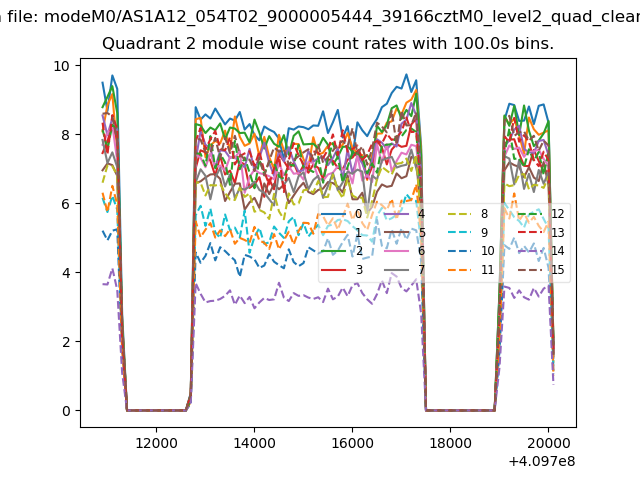
| Module-wise count rates for Quadrant B Data is divided into 100 sec bins |
 |
 |
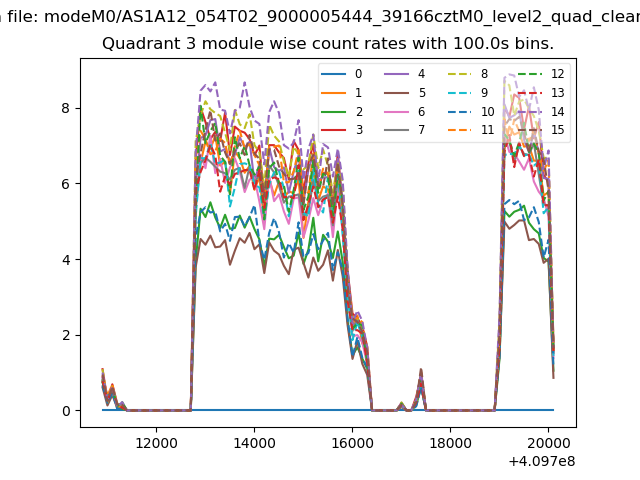
| Module-wise count rates for Quadrant C Data is divided into 100 sec bins |
 |
 |
| Module-wise count rates for Quadrant D Data is divided into 100 sec bins |
 |
 |
| Parameter | Plot |
|---|---|
| CZT HV Monitor | 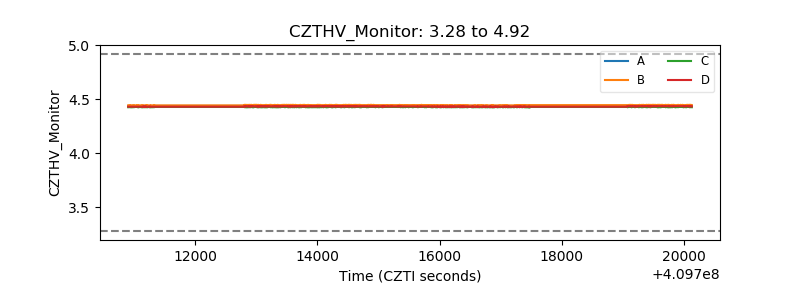 |
| D_VDD | 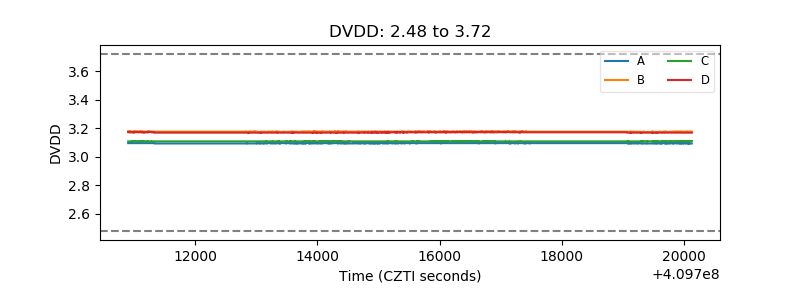 |
| Temperature 1 | 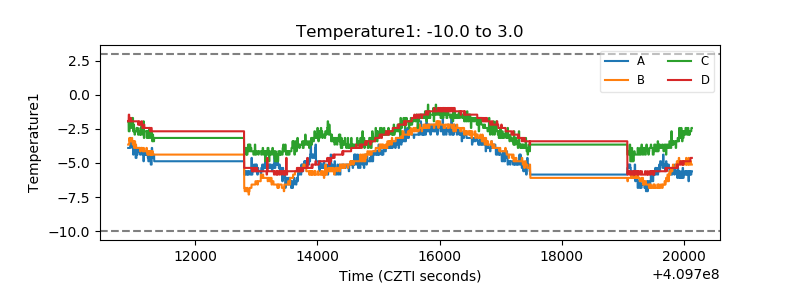 |
| Veto HV Monitor | 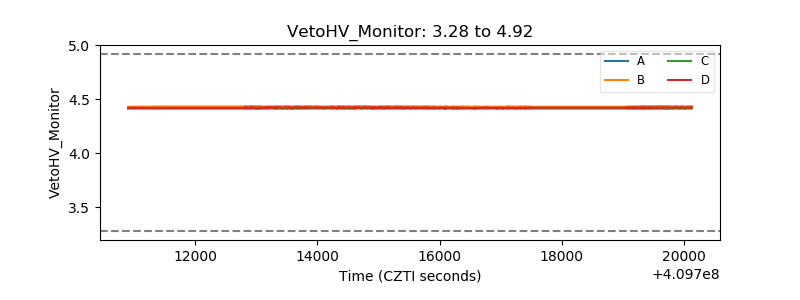 |
| Veto LLD | 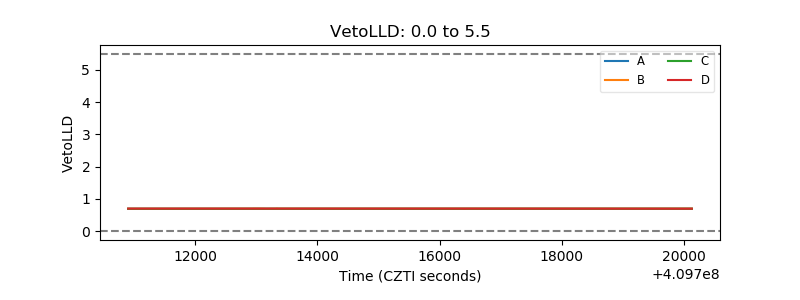 |
| Alpha Counter | 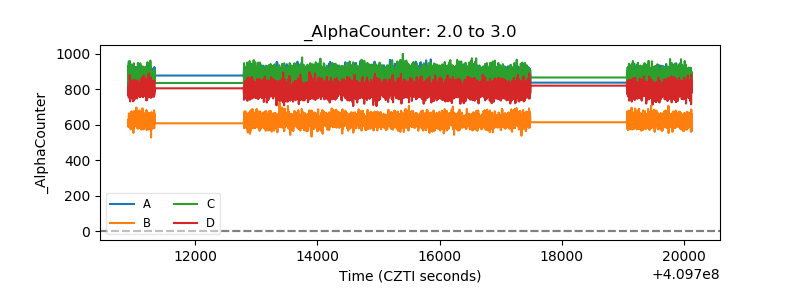 |
| _CPM_Rate | 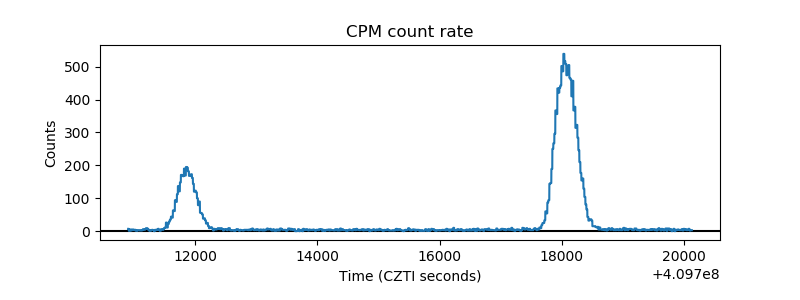 |
| CZT Counter |  |
| +2.5 Volts monitor | 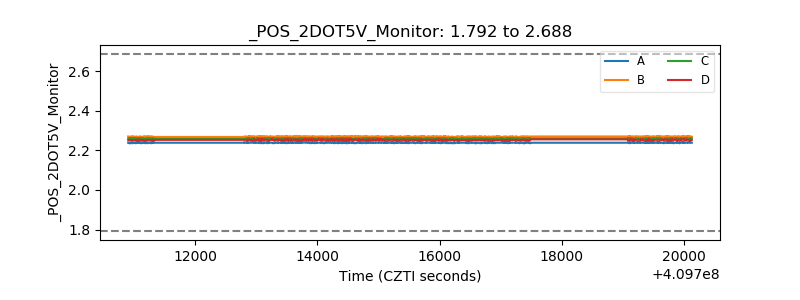 |
| +5 Volts monitor | 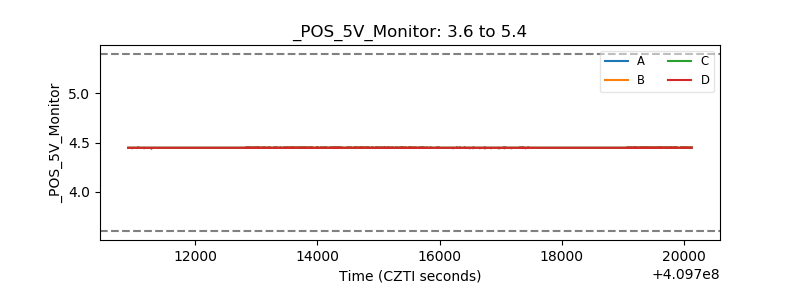 |
| _ROLL_ROT | 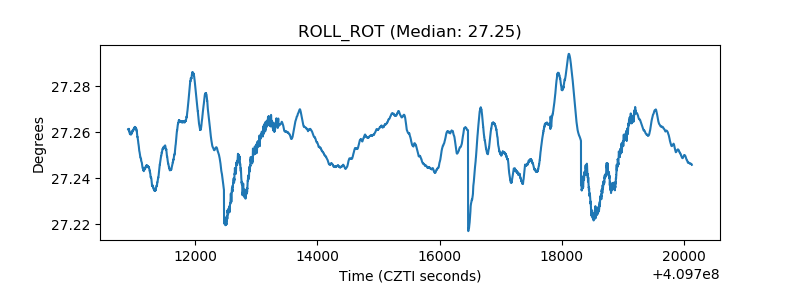 |
| _Roll_DEC | 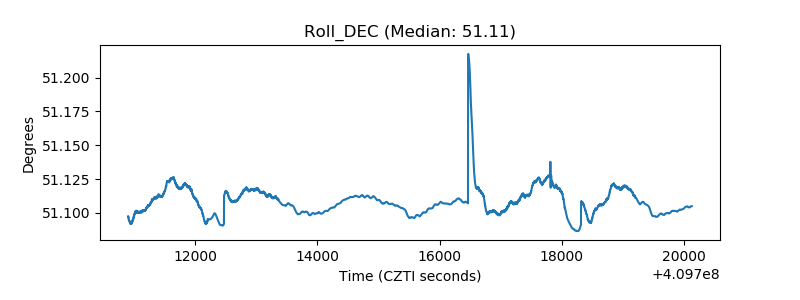 |
| _Roll_RA | 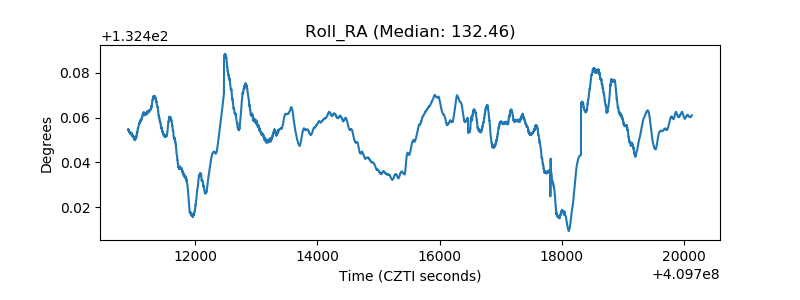 |
| Veto Counter | 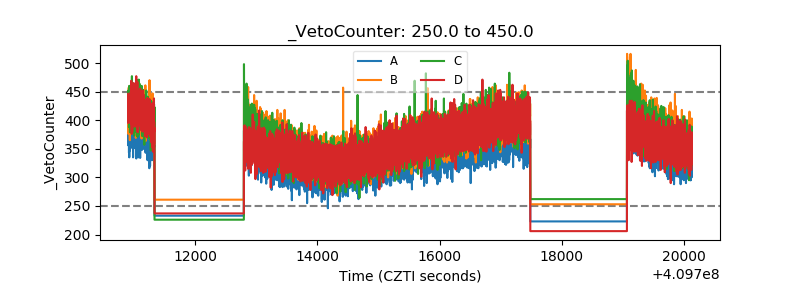 |