| Param | Original file | Final file |
|---|---|---|
| Filename | modeM0/AS1A12_054T02_9000005444_39167cztM0_level2.fits | modeM0/AS1A12_054T02_9000005444_39167cztM0_level2_quad_clean.evt |
| Size (bytes) | 456,840,000 | 88,323,840 |
| Size | 435.7 MB | 84.2 MB |
| Events in quadrant A | 2,822,835 | 624,223 |
| Events in quadrant B | 2,421,954 | 634,594 |
| Events in quadrant C | 2,705,396 | 596,735 |
| Events in quadrant D | 8,538,092 | 438,338 |
| Mode M9 | |||
|---|---|---|---|
| Quadrant | BADHDUFLAG | Total packets | Discarded packets |
| A | 0 | 23 | 0 |
| B | 0 | 23 | 0 |
| C | 0 | 23 | 0 |
| D | 0 | 24 | 0 |
| Mode M0 | |||
|---|---|---|---|
| Quadrant | BADHDUFLAG | Total packets | Discarded packets |
| A | 0 | 11659 | 3 |
| B | 0 | 10964 | 2 |
| C | 0 | 11504 | 2 |
| D | 0 | 29127 | 2 |
| Mode SS | |||
|---|---|---|---|
| Quadrant | BADHDUFLAG | Total packets | Discarded packets |
| A | 0 | 110 | 0 |
| B | 0 | 110 | 0 |
| C | 0 | 110 | 0 |
| D | 0 | 110 | 0 |
| Quadrant | Total seconds | Saturated seconds | Saturation percentage |
|---|---|---|---|
| A | 5436 | 9 | 0.165563% |
| B | 5436 | 4 | 0.073584% |
| C | 5436 | 9 | 0.165563% |
| D | 5436 | 1558 | 28.660780% |
Noise dominated data is calculated using 1-second bins in cleaned event files. If a bin has >2000 counts, and if more than 50% of those come from <1% of pixels, then it is considered to be noise-dominated and hence unusable.
| Quadrant | # 1 sec bins | Bins with >0 counts | Bins with >2000 counts | High rate bins dominated by noise | Noise dominated (total time) | Noise dominated (detector-on time) | Marked lightcurve |
|---|---|---|---|---|---|---|---|
| A | 7169 | 5437 | 6 | 6 | 0.08% | 0.11% | 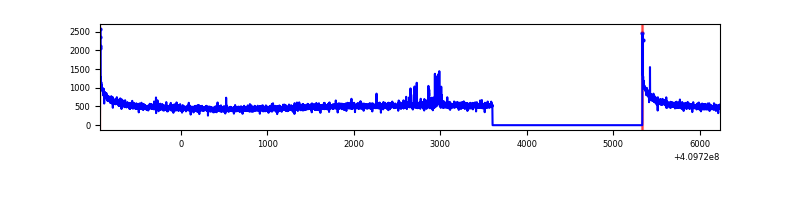 |
| B | 7169 | 5437 | 0 | 0 | 0.00% | 0.00% | 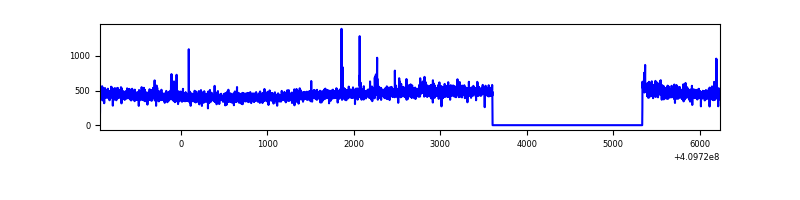 |
| C | 7169 | 5437 | 4 | 4 | 0.06% | 0.07% | 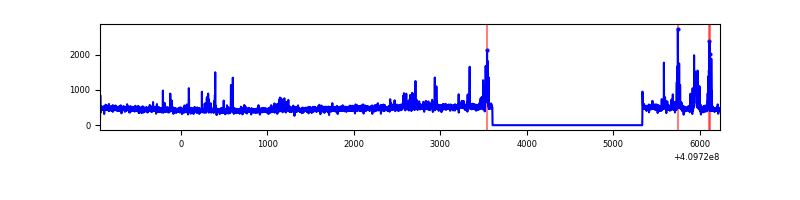 |
| D | 7169 | 5437 | 1444 | 1444 | 20.14% | 26.56% | 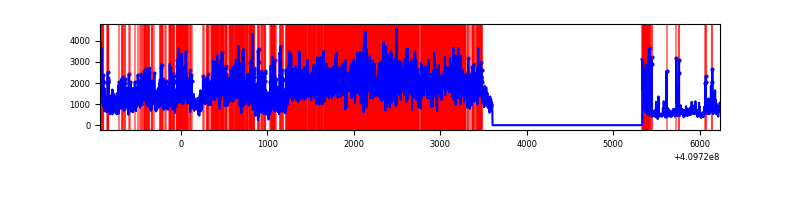 |
Top three noisy pixels from each quadrant. If the there are fewer than three noisy pixels in the level2.evt file, extra rows are filled as -1
| Pixel properties | Quadrant properties | ||||||
|---|---|---|---|---|---|---|---|
| Quadrant | DetID | PixID | Counts | Sigma | Mean | Median | Sigma |
| A | 10 | 83 | 428135 | 3477.59 | 607 | 595 | 122.9 |
| A | 13 | 248 | 36447 | 291.62 | 607 | 595 | 122.9 |
| A | 13 | 254 | 7816 | 58.74 | 607 | 595 | 122.9 |
| B | 0 | 213 | 28179 | 238.81 | 600 | 586 | 115.5 |
| B | 5 | 172 | 20133 | 169.18 | 600 | 586 | 115.5 |
| B | 12 | 111 | 14807 | 123.08 | 600 | 586 | 115.5 |
| C | 15 | 214 | 228367 | 1677.28 | 582 | 583 | 135.8 |
| C | 9 | 187 | 202398 | 1486.06 | 582 | 583 | 135.8 |
| C | 13 | 61 | 3957 | 24.84 | 582 | 583 | 135.8 |
| D | 12 | 235 | 5586720 | 41493.67 | 544 | 529 | 134.6 |
| D | 2 | 249 | 300196 | 2225.9 | 544 | 529 | 134.6 |
| D | 5 | 222 | 277000 | 2053.6 | 544 | 529 | 134.6 |
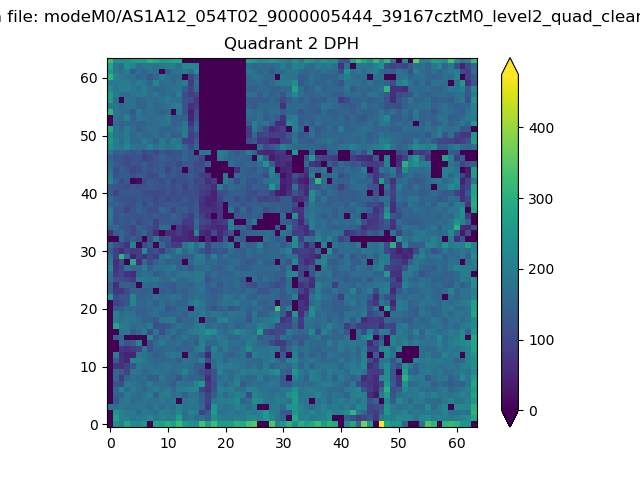
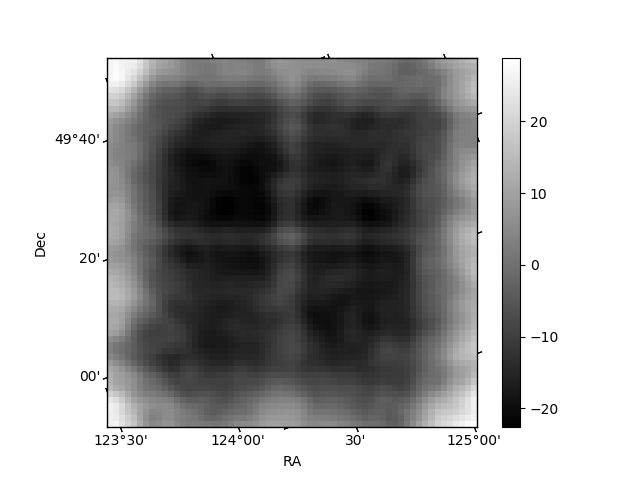
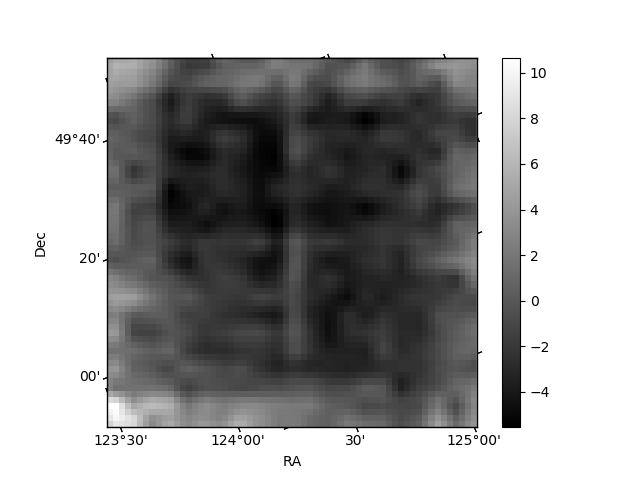
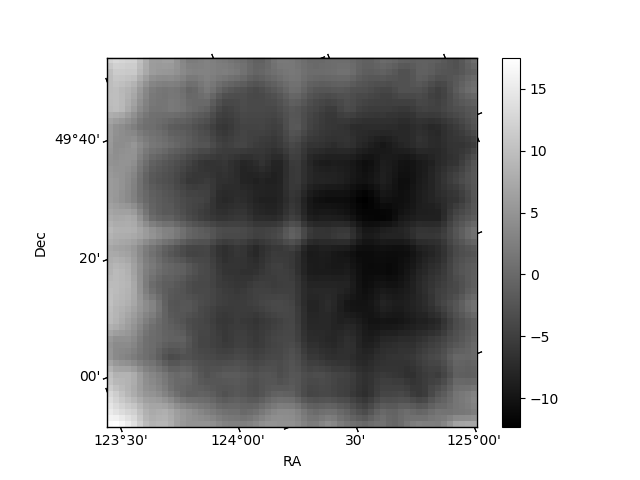
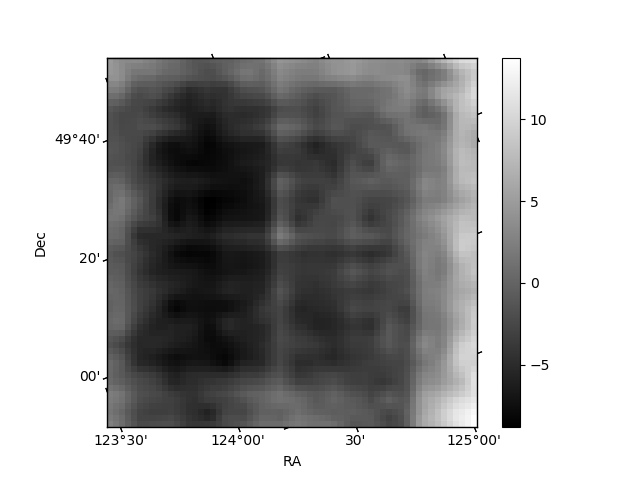
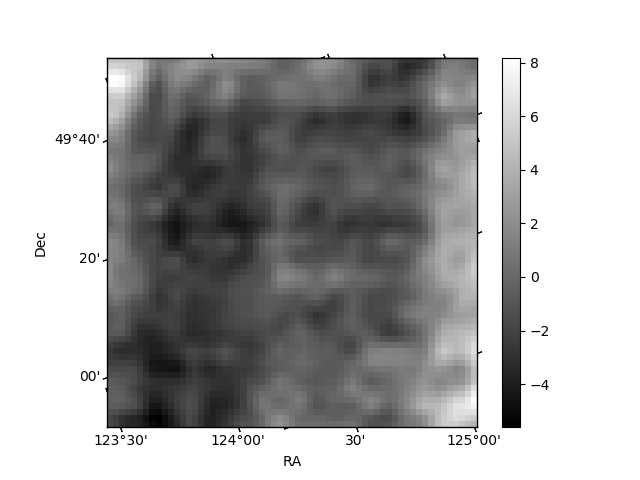
Histogram calculated using DETX and DETY for each event in the final _common_clean file
| Quadrant A | 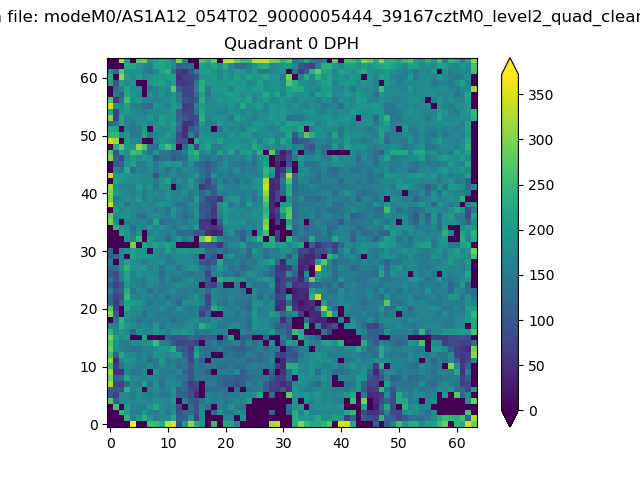 |
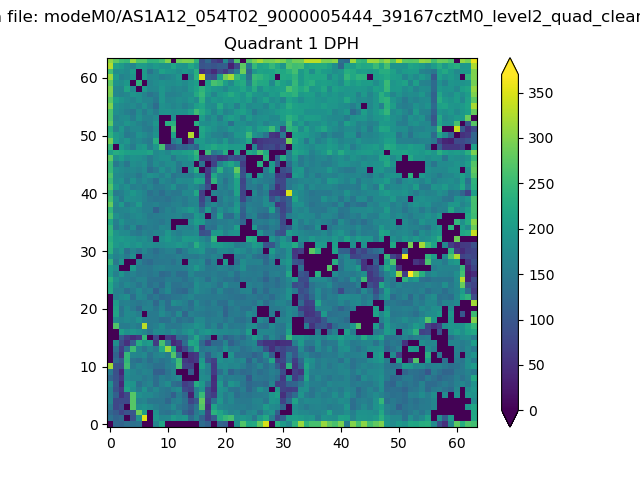 |
Quadrant B |
|---|---|---|---|
| Quadrant D | 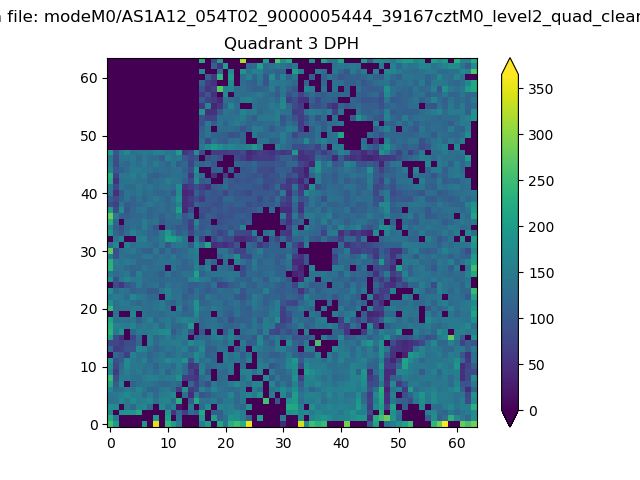 |
 |
Quadrant C |
| Plot type | Count rate plots | Images |
|---|---|---|
| Comparison with Poisson distribution Blue bars denote a histogram of data divided into 1 sec bins. Red curve is a Poisson curve with rate = median count rate of data. |
 |
 |
| Quadrant-wise count rates Data is divided into 100 sec bins |
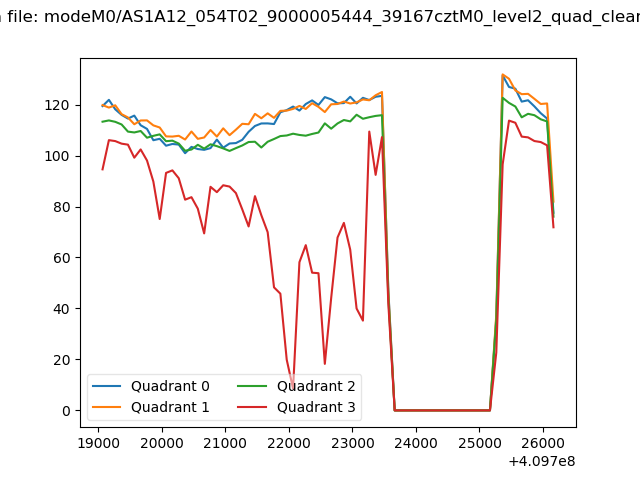 |
|
| Module-wise count rates for Quadrant A Data is divided into 100 sec bins |
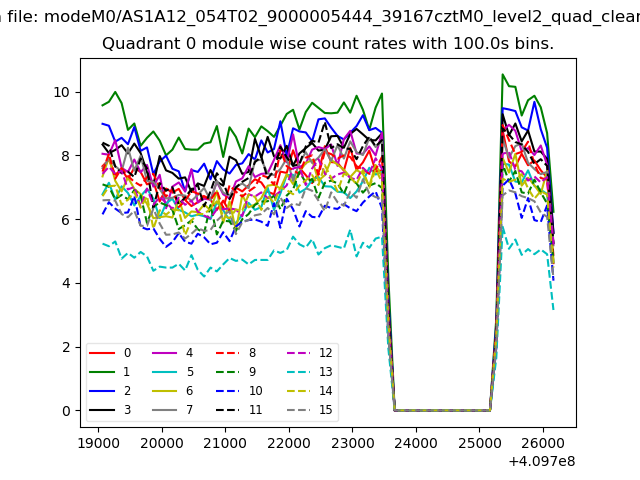 |
 |
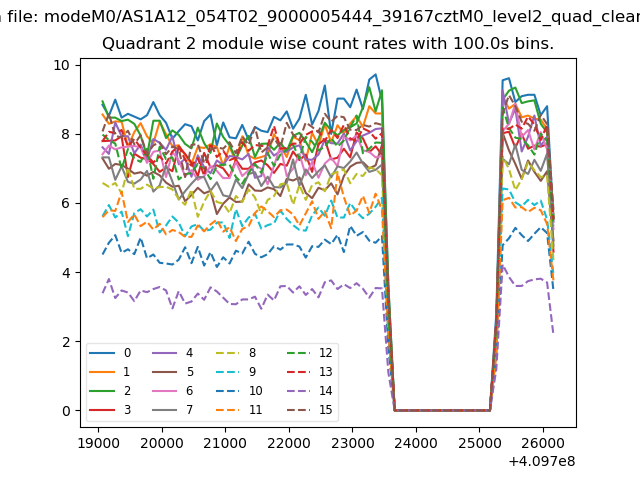
| Module-wise count rates for Quadrant B Data is divided into 100 sec bins |
 |
 |
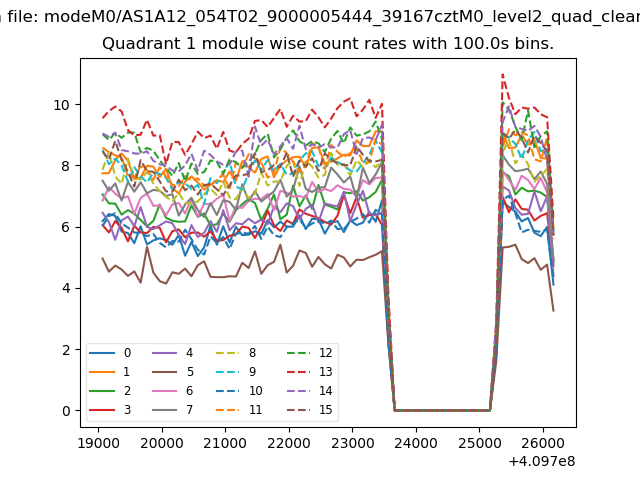
| Module-wise count rates for Quadrant C Data is divided into 100 sec bins |
 |
 |
| Module-wise count rates for Quadrant D Data is divided into 100 sec bins |
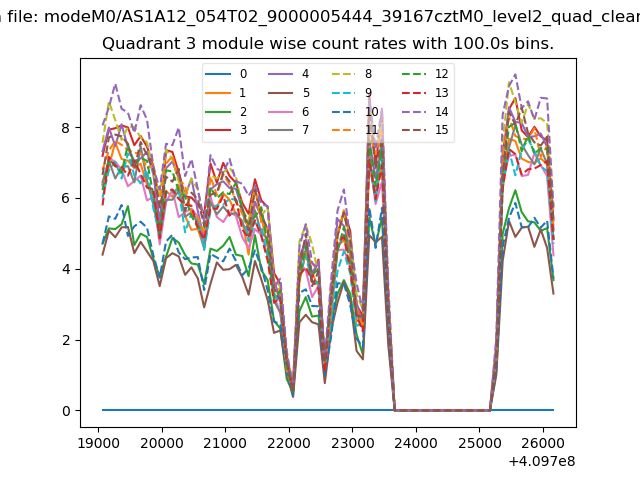 |
 |
| Parameter | Plot |
|---|---|
| CZT HV Monitor | 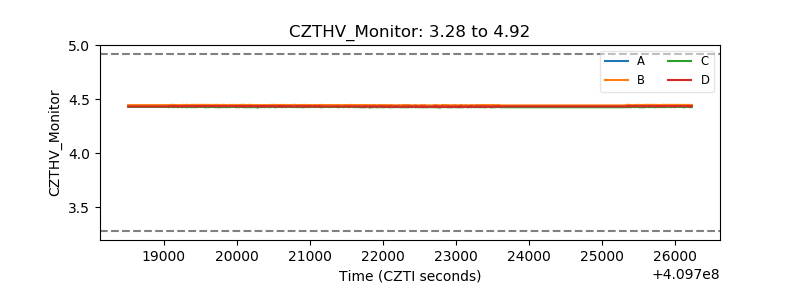 |
| D_VDD | 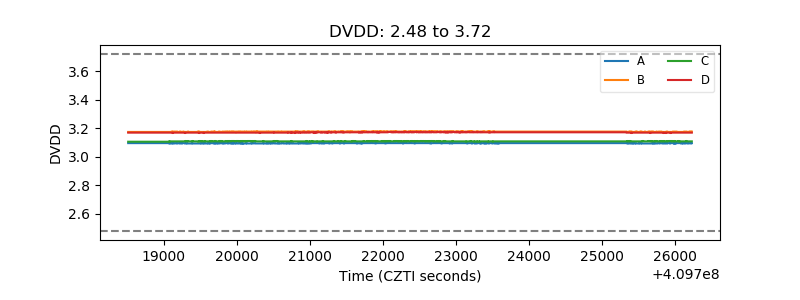 |
| Temperature 1 | 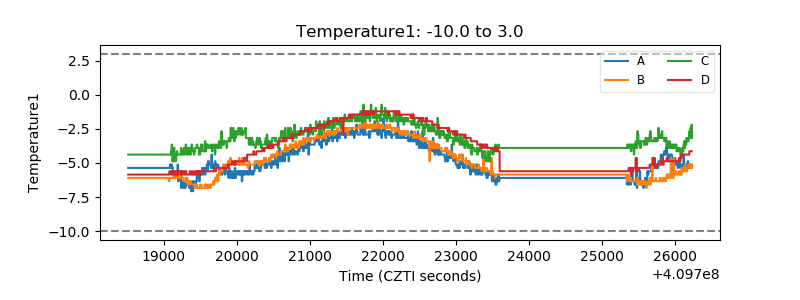 |
| Veto HV Monitor | 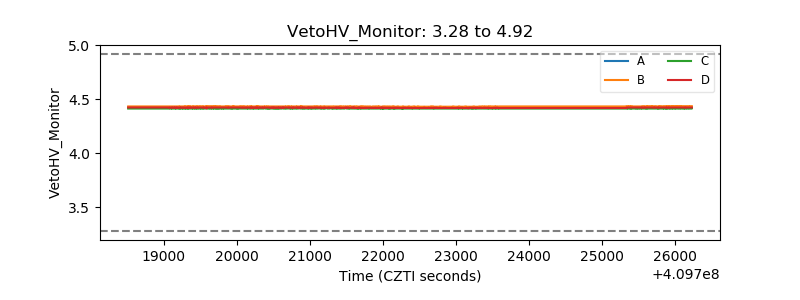 |
| Veto LLD | 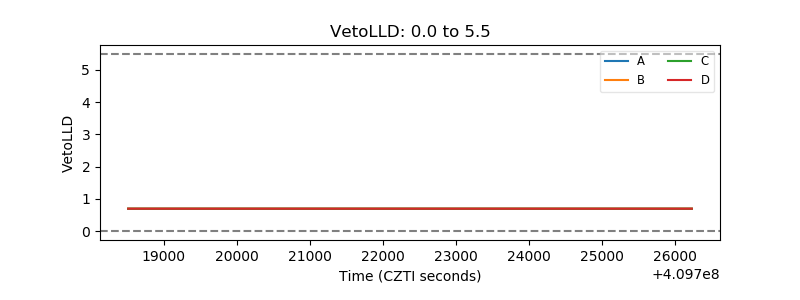 |
| Alpha Counter | 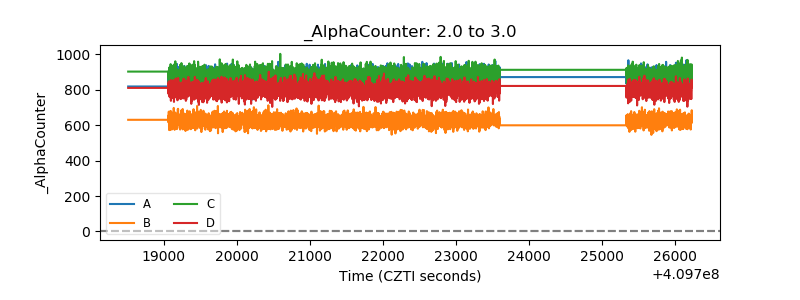 |
| _CPM_Rate | 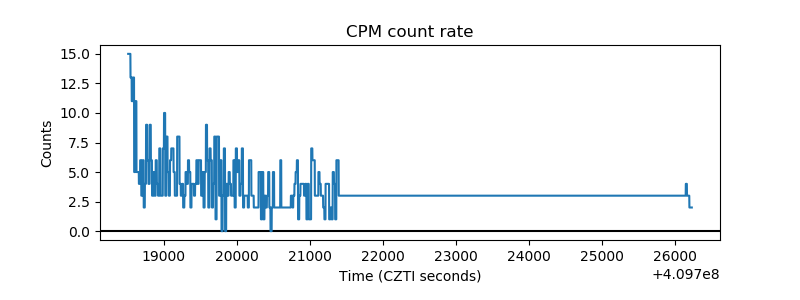 |
| CZT Counter |  |
| +2.5 Volts monitor | 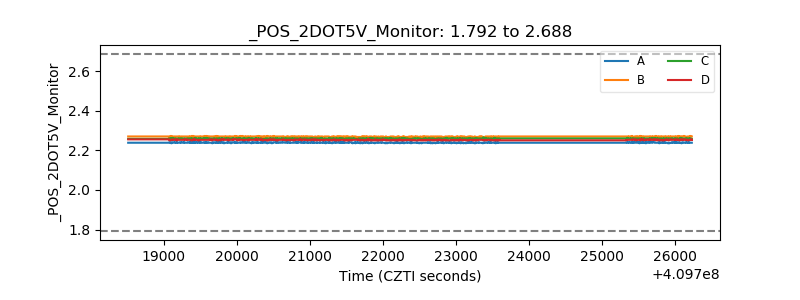 |
| +5 Volts monitor | 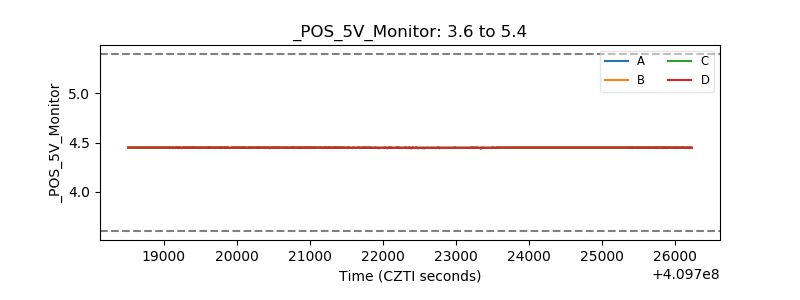 |
| _ROLL_ROT | 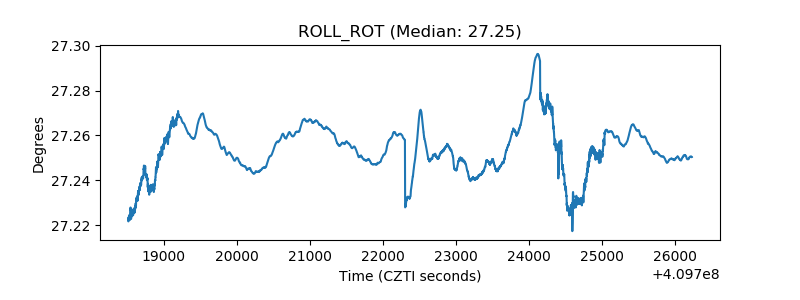 |
| _Roll_DEC |  |
| _Roll_RA | 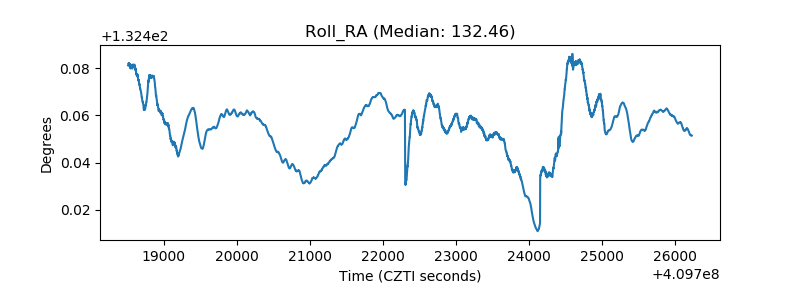 |
| Veto Counter | 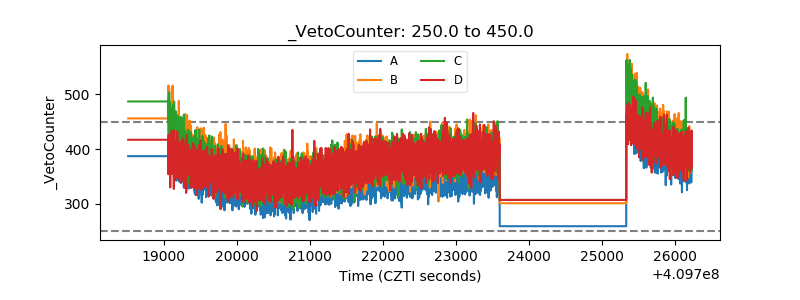 |