| Param | Original file | Final file |
|---|---|---|
| Filename | modeM0/AS1A12_054T02_9000005444_39169cztM0_level2.fits | modeM0/AS1A12_054T02_9000005444_39169cztM0_level2_quad_clean.evt |
| Size (bytes) | 450,207,360 | 87,180,480 |
| Size | 429.4 MB | 83.1 MB |
| Events in quadrant A | 2,904,386 | 633,996 |
| Events in quadrant B | 2,420,623 | 643,103 |
| Events in quadrant C | 2,799,139 | 596,307 |
| Events in quadrant D | 8,132,845 | 398,605 |
| Mode M9 | |||
|---|---|---|---|
| Quadrant | BADHDUFLAG | Total packets | Discarded packets |
| A | 0 | 28 | 0 |
| B | 0 | 28 | 0 |
| C | 0 | 28 | 0 |
| D | 0 | 29 | 0 |
| Mode M0 | |||
|---|---|---|---|
| Quadrant | BADHDUFLAG | Total packets | Discarded packets |
| A | 0 | 11752 | 10 |
| B | 0 | 10621 | 10 |
| C | 0 | 11457 | 6 |
| D | 0 | 27829 | 47 |
| Mode SS | |||
|---|---|---|---|
| Quadrant | BADHDUFLAG | Total packets | Discarded packets |
| A | 0 | 108 | 0 |
| B | 0 | 108 | 0 |
| C | 0 | 108 | 0 |
| D | 0 | 108 | 0 |
| Quadrant | Total seconds | Saturated seconds | Saturation percentage |
|---|---|---|---|
| A | 5249 | 18 | 0.342922% |
| B | 5248 | 5 | 0.095274% |
| C | 5251 | 56 | 1.066464% |
| D | 5243 | 1834 | 34.979973% |
Noise dominated data is calculated using 1-second bins in cleaned event files. If a bin has >2000 counts, and if more than 50% of those come from <1% of pixels, then it is considered to be noise-dominated and hence unusable.
| Quadrant | # 1 sec bins | Bins with >0 counts | Bins with >2000 counts | High rate bins dominated by noise | Noise dominated (total time) | Noise dominated (detector-on time) | Marked lightcurve |
|---|---|---|---|---|---|---|---|
| A | 7108 | 5253 | 6 | 6 | 0.08% | 0.11% | 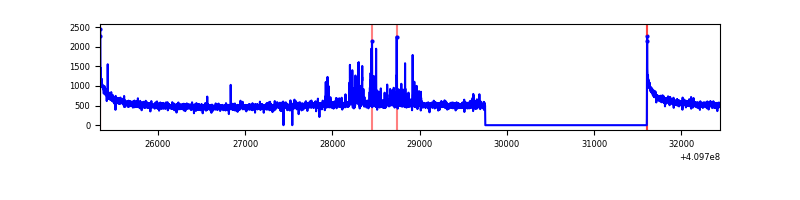 |
| B | 7108 | 5253 | 1 | 1 | 0.01% | 0.02% | 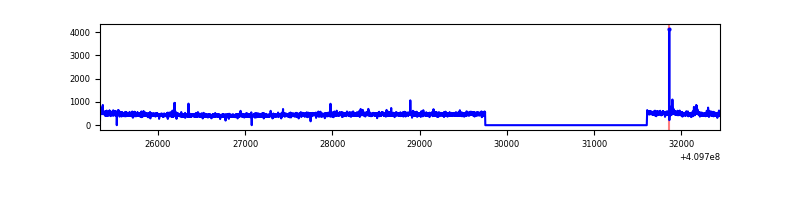 |
| C | 7108 | 5254 | 38 | 38 | 0.53% | 0.72% | 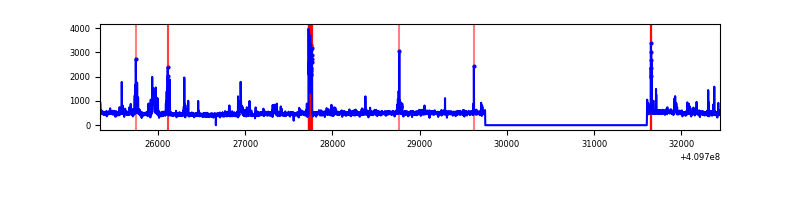 |
| D | 7108 | 5252 | 1620 | 1620 | 22.79% | 30.85% | 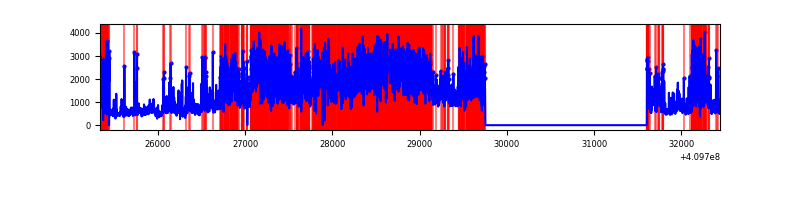 |
Top three noisy pixels from each quadrant. If the there are fewer than three noisy pixels in the level2.evt file, extra rows are filled as -1
| Pixel properties | Quadrant properties | ||||||
|---|---|---|---|---|---|---|---|
| Quadrant | DetID | PixID | Counts | Sigma | Mean | Median | Sigma |
| A | 10 | 83 | 422271 | 3472.82 | 603 | 592 | 121.4 |
| A | 13 | 248 | 120084 | 984.1 | 603 | 592 | 121.4 |
| A | 2 | 79 | 19533 | 155.99 | 603 | 592 | 121.4 |
| B | 0 | 213 | 39086 | 334.6 | 596 | 580 | 115.1 |
| B | 5 | 172 | 22222 | 188.06 | 596 | 580 | 115.1 |
| B | 12 | 111 | 14487 | 120.84 | 596 | 580 | 115.1 |
| C | 9 | 187 | 322637 | 2387.82 | 577 | 580 | 134.9 |
| C | 15 | 214 | 223010 | 1649.16 | 577 | 580 | 134.9 |
| C | 0 | 10 | 4343 | 27.9 | 577 | 580 | 134.9 |
| D | 12 | 235 | 2855680 | 23037.73 | 509 | 494 | 123.9 |
| D | 5 | 222 | 1293303 | 10431.33 | 509 | 494 | 123.9 |
| D | 13 | 171 | 1001565 | 8077.37 | 509 | 494 | 123.9 |
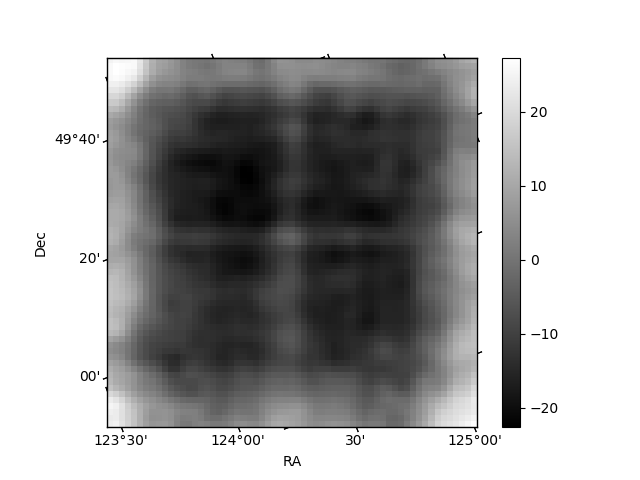
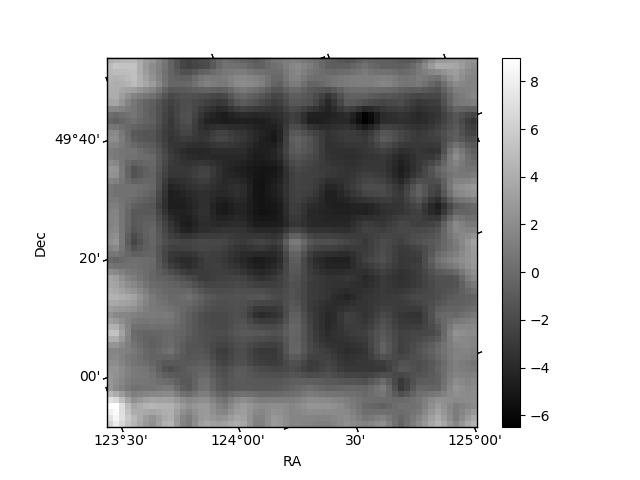
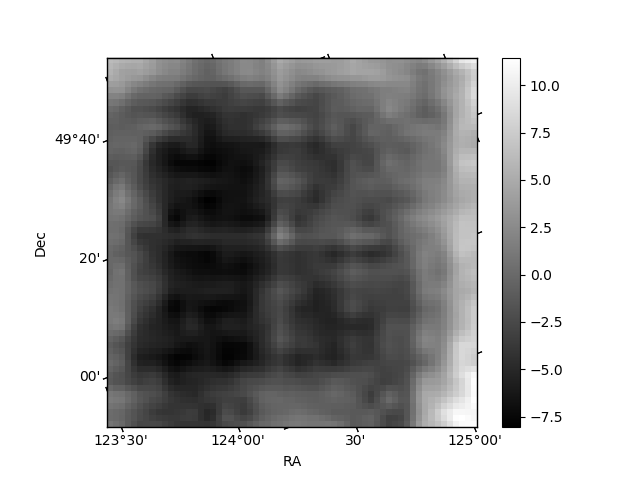
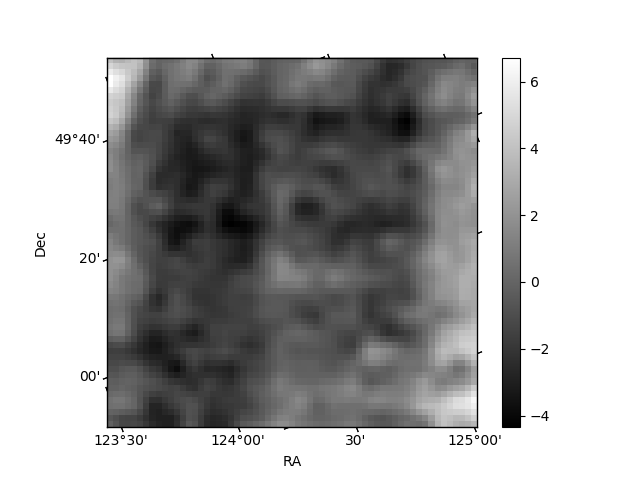
Histogram calculated using DETX and DETY for each event in the final _common_clean file
| Quadrant A | 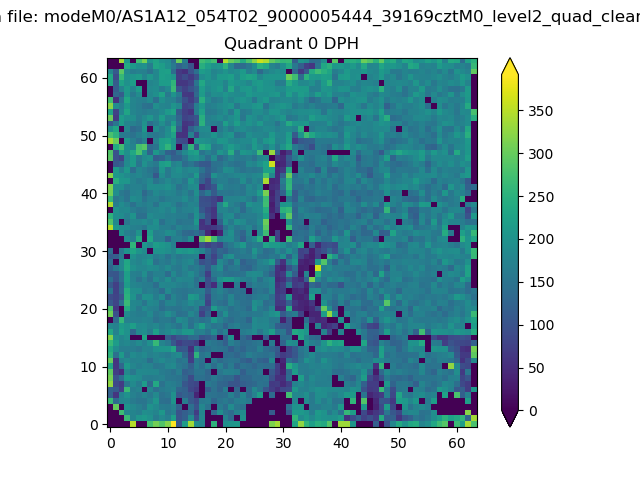 |
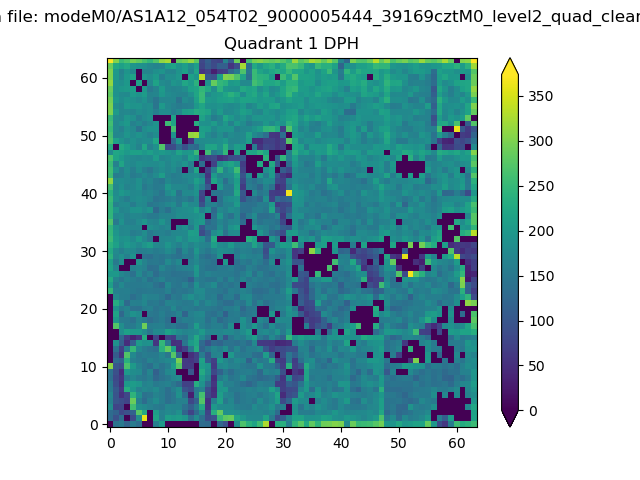 |
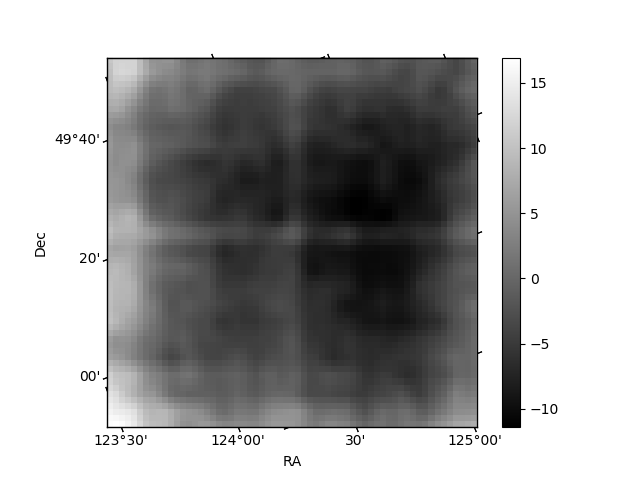
Quadrant B |
|---|---|---|---|
| Quadrant D | 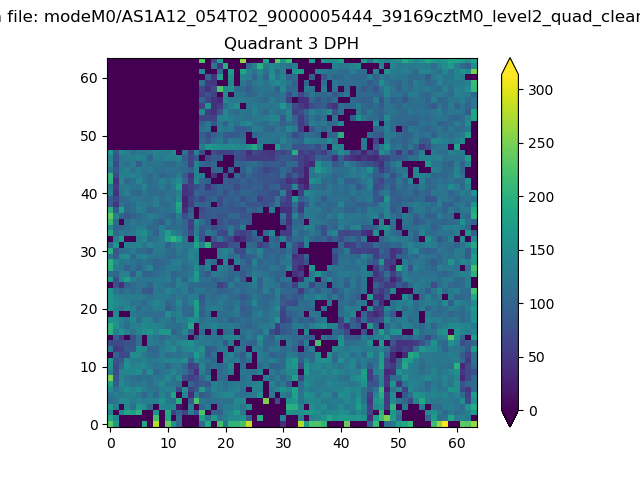 |
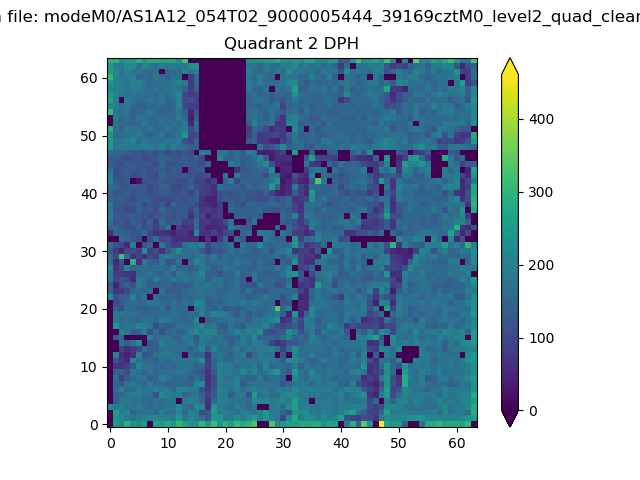 |
Quadrant C |
| Plot type | Count rate plots | Images |
|---|---|---|
| Comparison with Poisson distribution Blue bars denote a histogram of data divided into 1 sec bins. Red curve is a Poisson curve with rate = median count rate of data. |
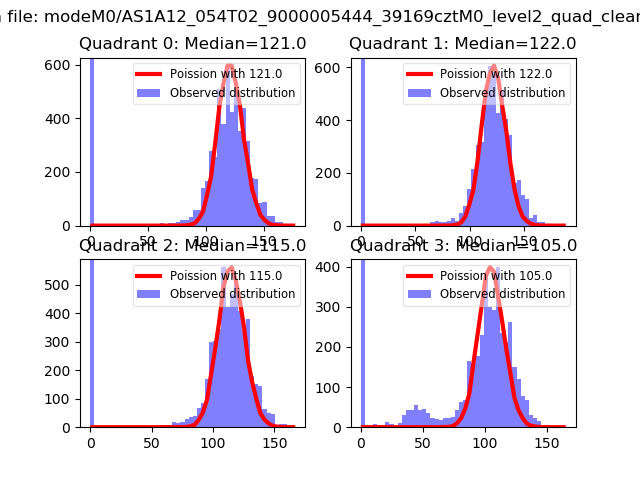 |
 |
| Quadrant-wise count rates Data is divided into 100 sec bins |
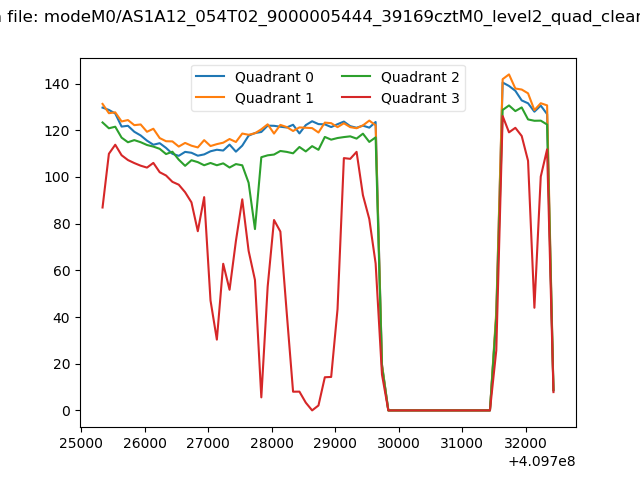 |
|
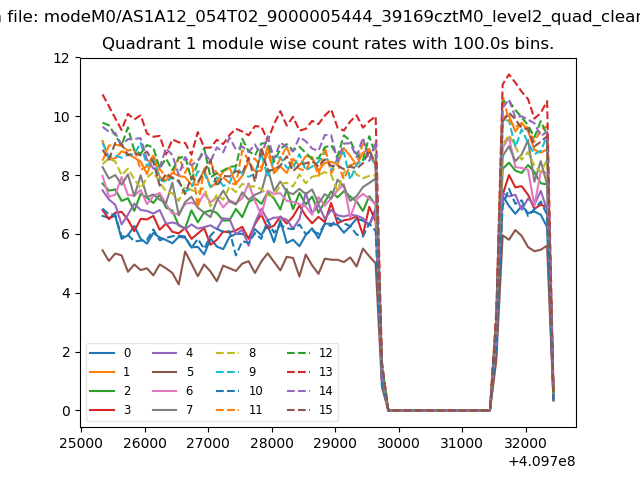
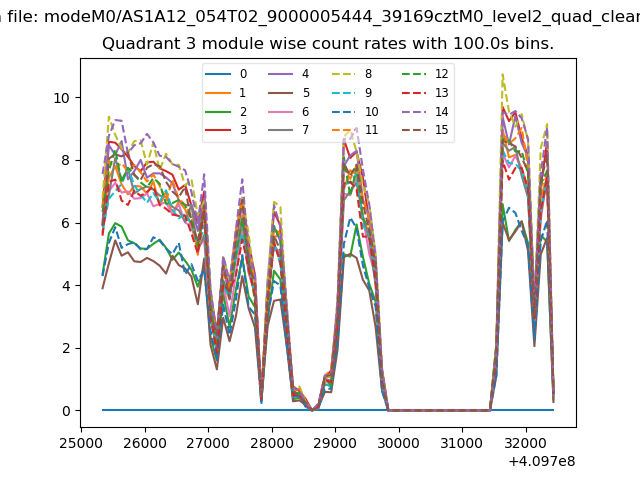
| Module-wise count rates for Quadrant A Data is divided into 100 sec bins |
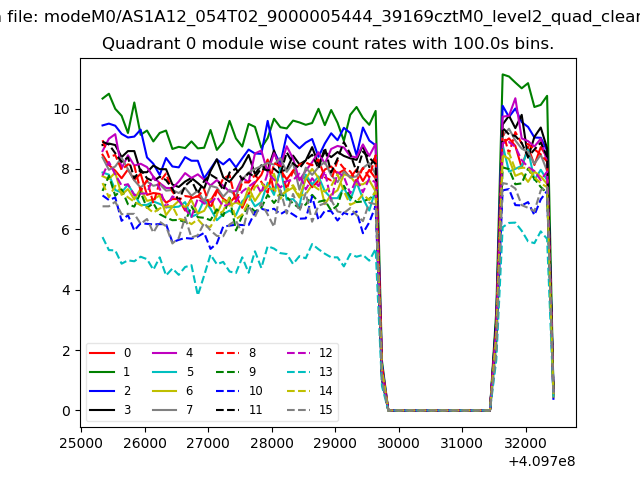 |
 |
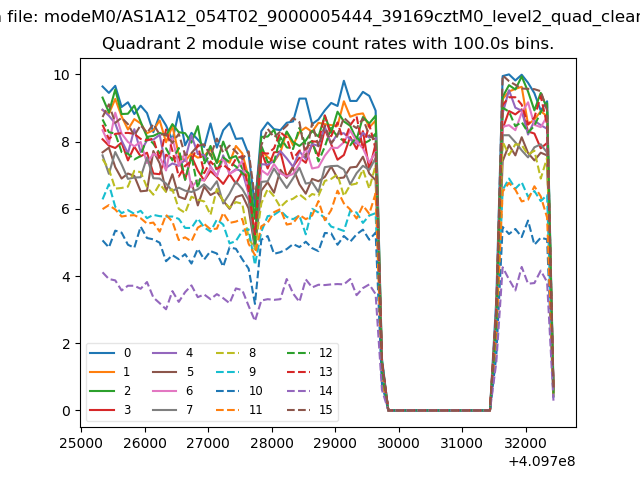
| Module-wise count rates for Quadrant B Data is divided into 100 sec bins |
 |
 |
| Module-wise count rates for Quadrant C Data is divided into 100 sec bins |
 |
 |
| Module-wise count rates for Quadrant D Data is divided into 100 sec bins |
 |
 |
| Parameter | Plot |
|---|---|
| CZT HV Monitor | 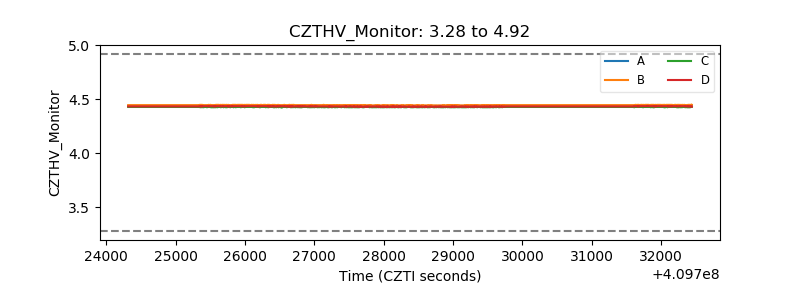 |
| D_VDD | 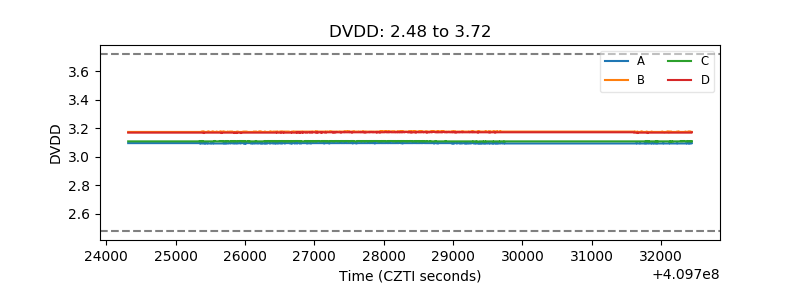 |
| Temperature 1 | 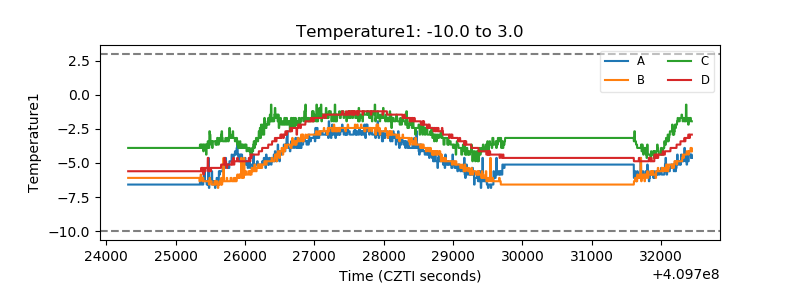 |
| Veto HV Monitor | 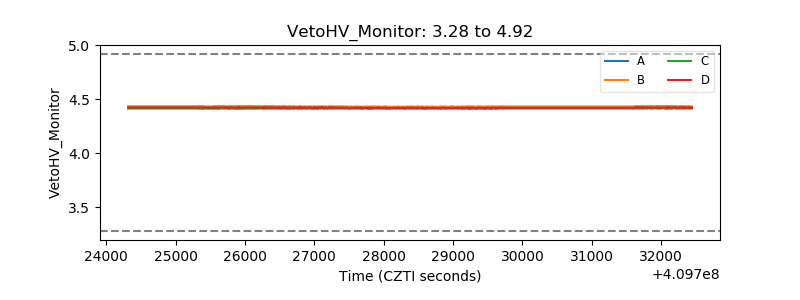 |
| Veto LLD | 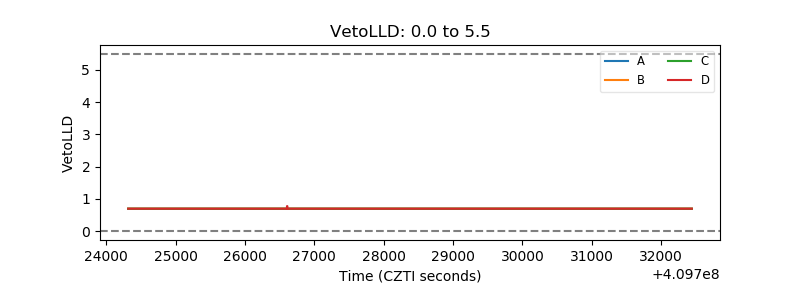 |
| Alpha Counter | 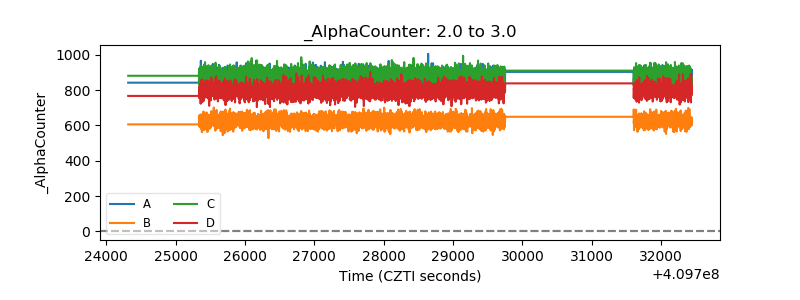 |
| _CPM_Rate | 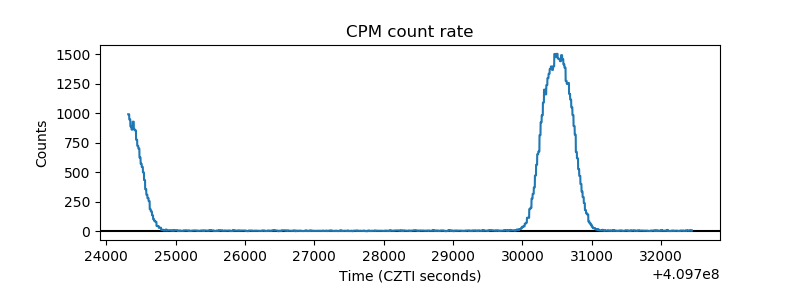 |
| CZT Counter | 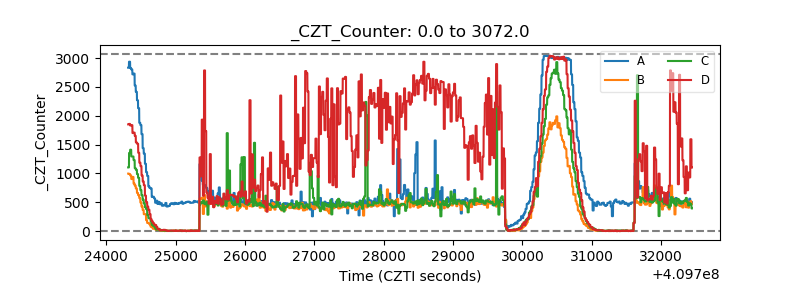 |
| +2.5 Volts monitor | 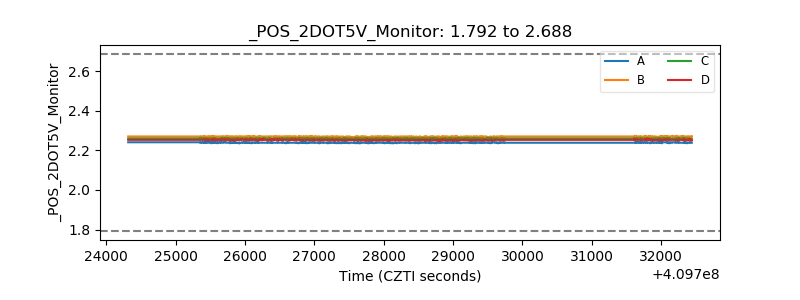 |
| +5 Volts monitor | 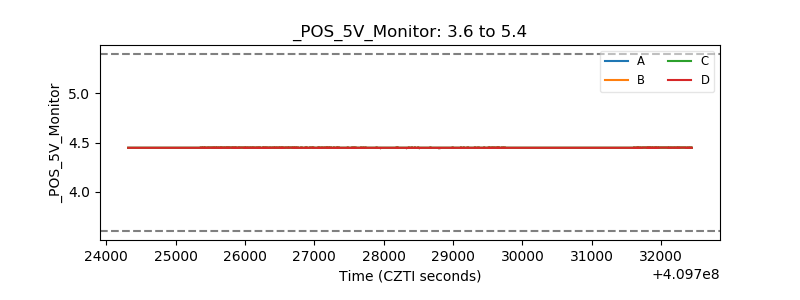 |
| _ROLL_ROT | 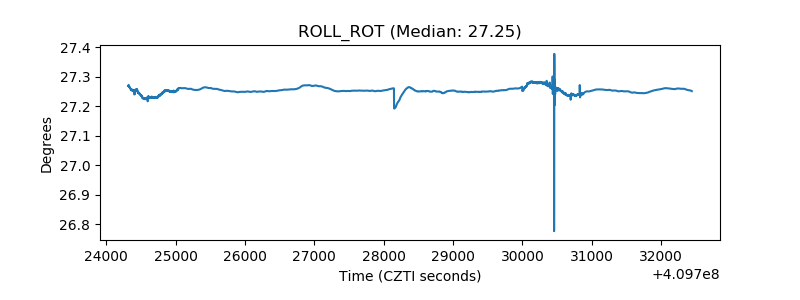 |
| _Roll_DEC |  |
| _Roll_RA | 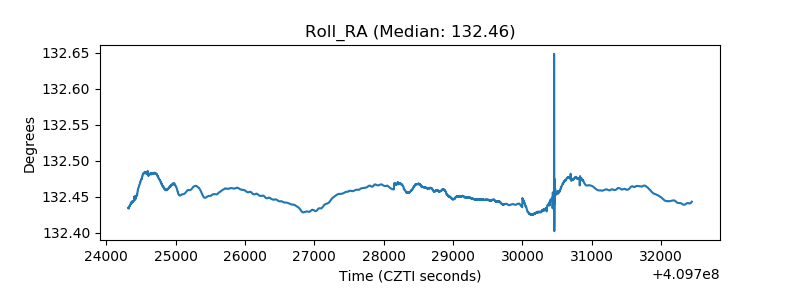 |
| Veto Counter | 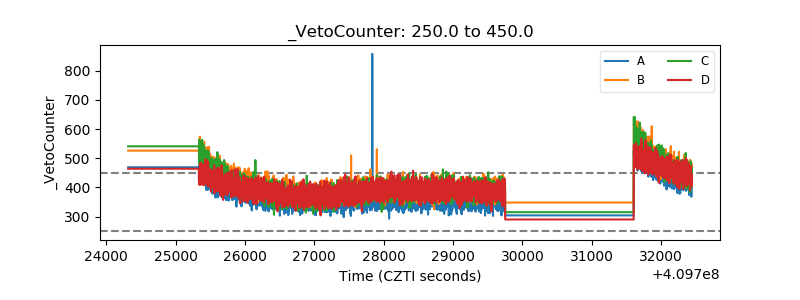 |