| Param | Original file | Final file |
|---|---|---|
| Filename | modeM0/AS1A12_054T02_9000005444_39170cztM0_level2.fits | modeM0/AS1A12_054T02_9000005444_39170cztM0_level2_quad_clean.evt |
| Size (bytes) | 441,498,240 | 88,744,320 |
| Size | 421.0 MB | 84.6 MB |
| Events in quadrant A | 2,825,104 | 654,427 |
| Events in quadrant B | 2,433,142 | 659,040 |
| Events in quadrant C | 2,576,312 | 610,763 |
| Events in quadrant D | 8,113,597 | 407,310 |
| Mode M9 | |||
|---|---|---|---|
| Quadrant | BADHDUFLAG | Total packets | Discarded packets |
| A | 0 | 21 | 0 |
| B | 0 | 21 | 0 |
| C | 0 | 21 | 0 |
| D | 0 | 22 | 0 |
| Mode M0 | |||
|---|---|---|---|
| Quadrant | BADHDUFLAG | Total packets | Discarded packets |
| A | 0 | 11352 | 3 |
| B | 0 | 10341 | 2 |
| C | 0 | 10529 | 2 |
| D | 0 | 27681 | 2 |
| Mode SS | |||
|---|---|---|---|
| Quadrant | BADHDUFLAG | Total packets | Discarded packets |
| A | 0 | 104 | 0 |
| B | 0 | 104 | 0 |
| C | 0 | 104 | 0 |
| D | 0 | 104 | 0 |
| Quadrant | Total seconds | Saturated seconds | Saturation percentage |
|---|---|---|---|
| A | 5074 | 11 | 0.216791% |
| B | 5074 | 11 | 0.216791% |
| C | 5074 | 9 | 0.177375% |
| D | 5074 | 1812 | 35.711470% |
Noise dominated data is calculated using 1-second bins in cleaned event files. If a bin has >2000 counts, and if more than 50% of those come from <1% of pixels, then it is considered to be noise-dominated and hence unusable.
| Quadrant | # 1 sec bins | Bins with >0 counts | Bins with >2000 counts | High rate bins dominated by noise | Noise dominated (total time) | Noise dominated (detector-on time) | Marked lightcurve |
|---|---|---|---|---|---|---|---|
| A | 7017 | 5075 | 6 | 6 | 0.09% | 0.12% | 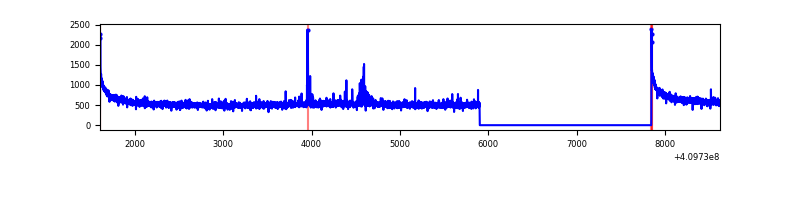 |
| B | 7017 | 5075 | 4 | 4 | 0.06% | 0.08% | 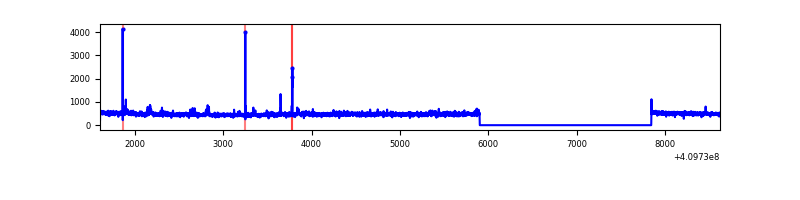 |
| C | 7017 | 5075 | 5 | 5 | 0.07% | 0.10% | 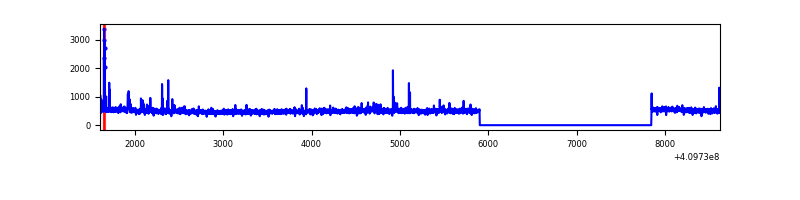 |
| D | 7017 | 5075 | 1606 | 1606 | 22.89% | 31.65% | 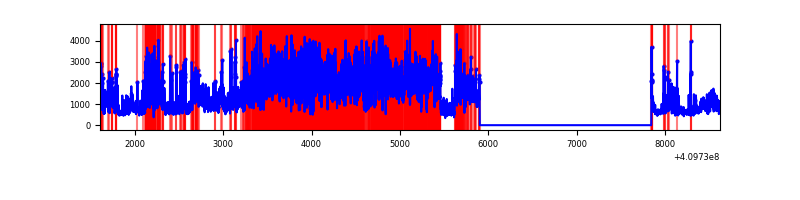 |
Top three noisy pixels from each quadrant. If the there are fewer than three noisy pixels in the level2.evt file, extra rows are filled as -1
| Pixel properties | Quadrant properties | ||||||
|---|---|---|---|---|---|---|---|
| Quadrant | DetID | PixID | Counts | Sigma | Mean | Median | Sigma |
| A | 10 | 83 | 414554 | 3416.69 | 609 | 599 | 121.2 |
| A | 13 | 248 | 40148 | 326.43 | 609 | 599 | 121.2 |
| A | 2 | 79 | 11878 | 93.09 | 609 | 599 | 121.2 |
| B | 5 | 172 | 46423 | 403.06 | 596 | 580 | 113.7 |
| B | 0 | 213 | 34868 | 301.46 | 596 | 580 | 113.7 |
| B | 12 | 111 | 13936 | 117.43 | 596 | 580 | 113.7 |
| C | 15 | 214 | 216126 | 1621.23 | 578 | 581 | 133.0 |
| C | 9 | 187 | 99609 | 744.85 | 578 | 581 | 133.0 |
| C | 0 | 10 | 4754 | 31.39 | 578 | 581 | 133.0 |
| D | 12 | 235 | 4397584 | 34933.48 | 519 | 504 | 125.9 |
| D | 12 | 227 | 742921 | 5898.28 | 519 | 504 | 125.9 |
| D | 2 | 249 | 572374 | 4543.34 | 519 | 504 | 125.9 |
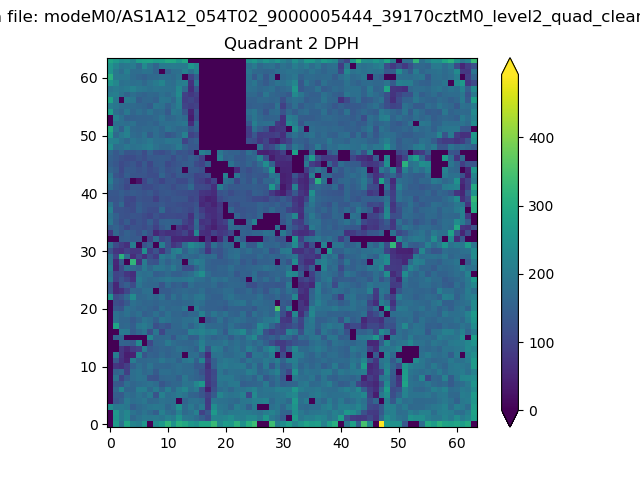
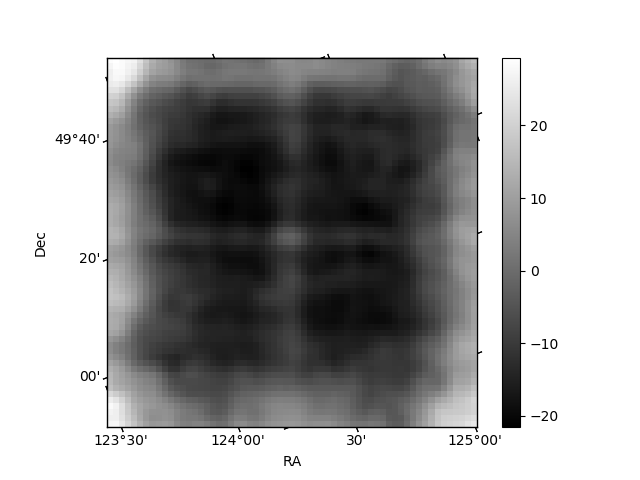
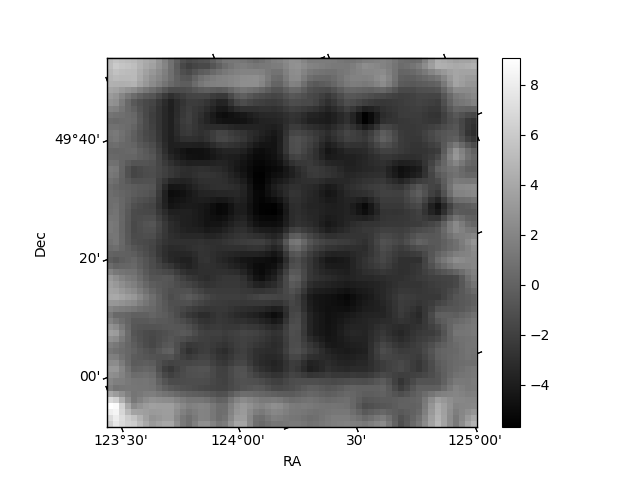
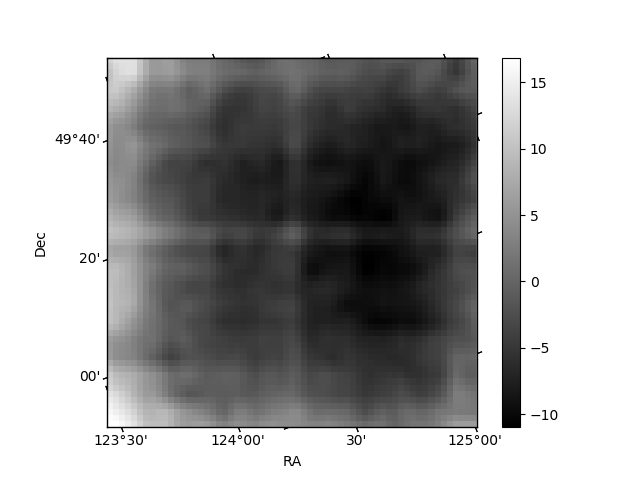
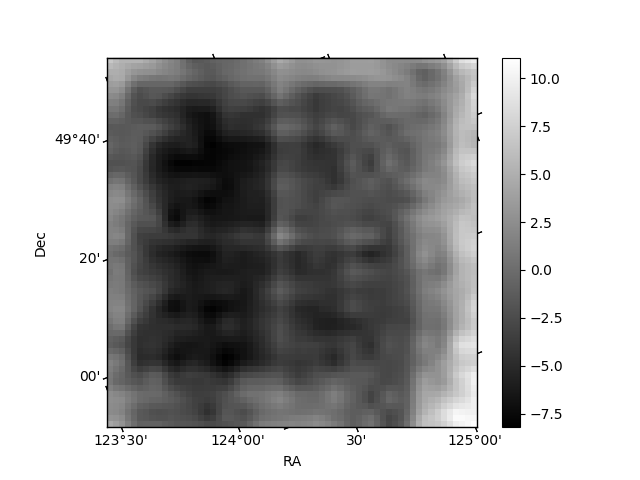
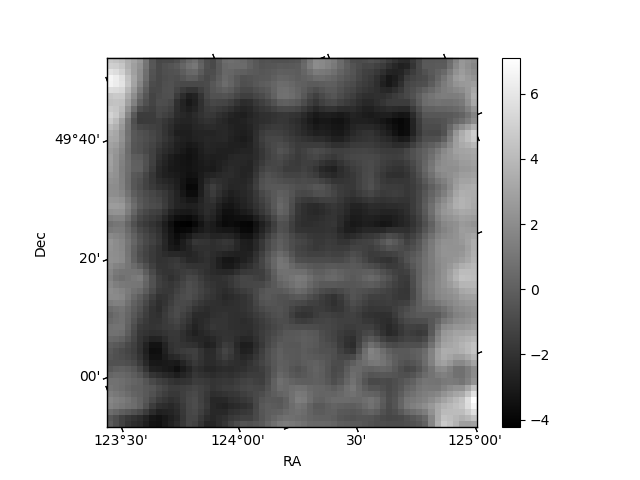
Histogram calculated using DETX and DETY for each event in the final _common_clean file
| Quadrant A | 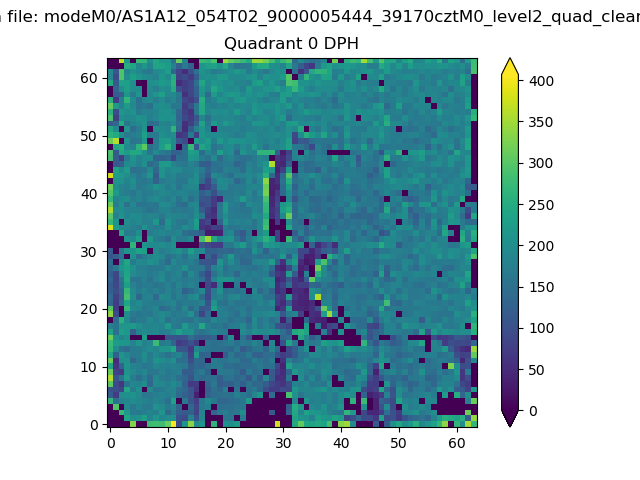 |
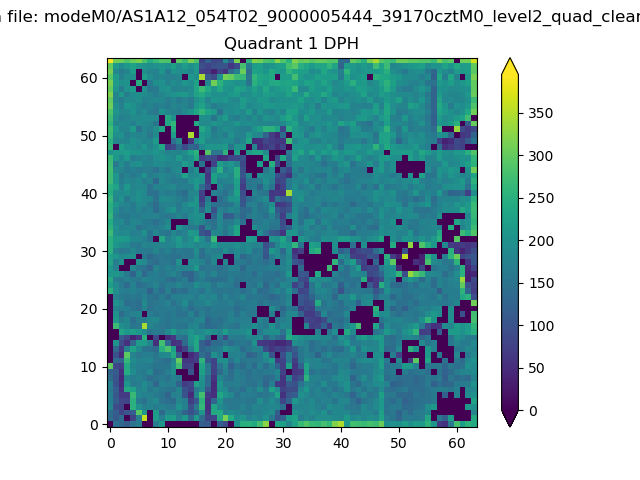 |
Quadrant B |
|---|---|---|---|
| Quadrant D | 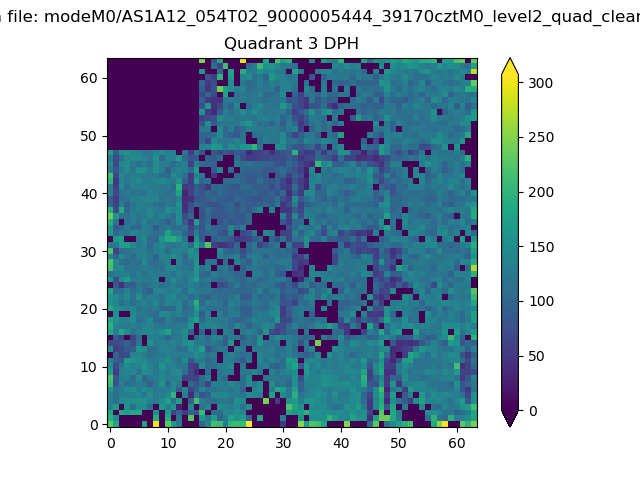 |
 |
Quadrant C |
| Plot type | Count rate plots | Images |
|---|---|---|
| Comparison with Poisson distribution Blue bars denote a histogram of data divided into 1 sec bins. Red curve is a Poisson curve with rate = median count rate of data. |
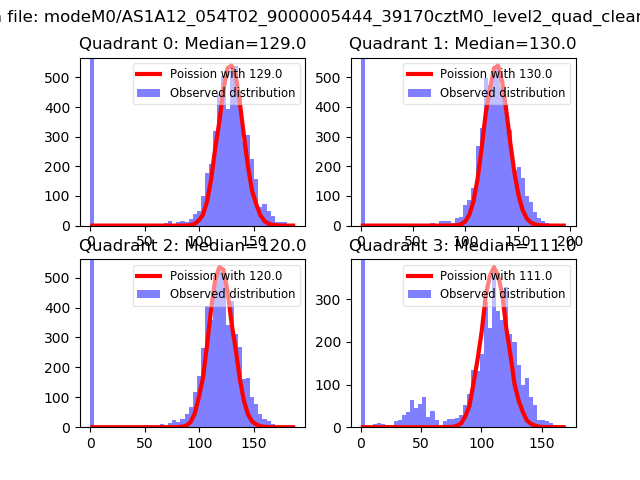 |
 |
| Quadrant-wise count rates Data is divided into 100 sec bins |
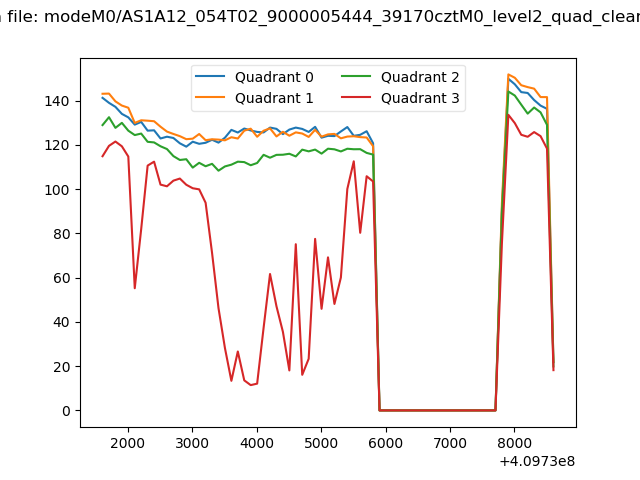 |
|
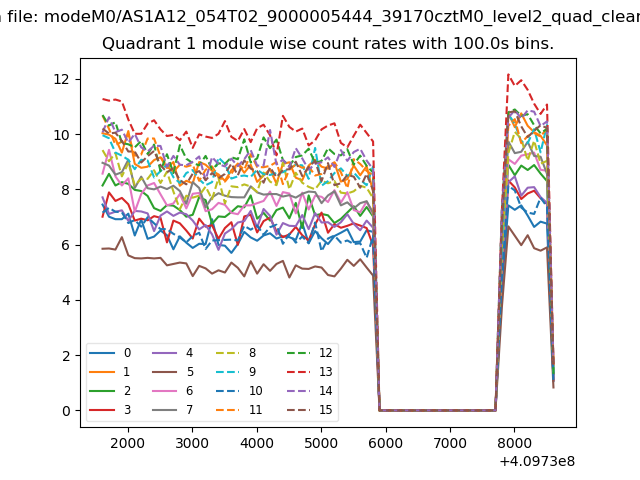
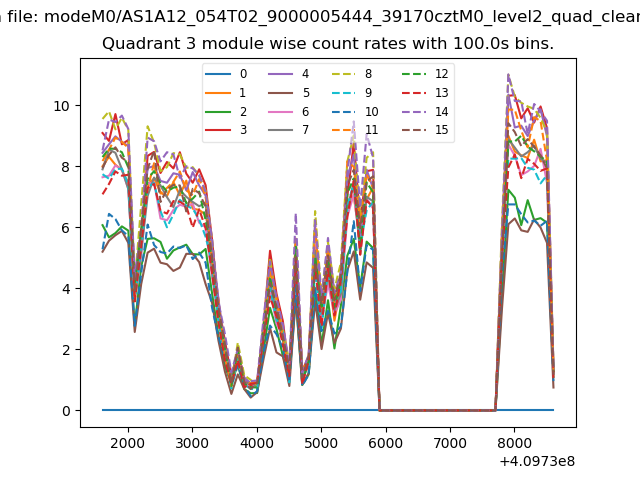
| Module-wise count rates for Quadrant A Data is divided into 100 sec bins |
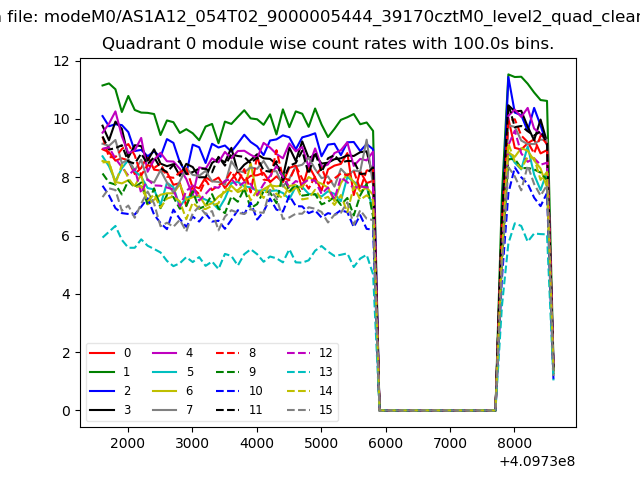 |
 |
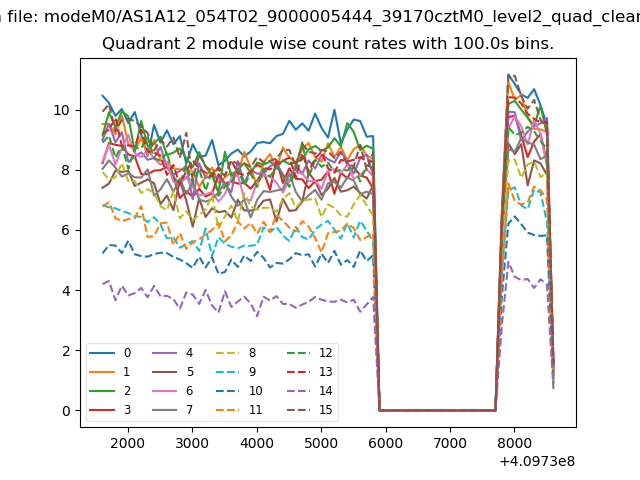
| Module-wise count rates for Quadrant B Data is divided into 100 sec bins |
 |
 |
| Module-wise count rates for Quadrant C Data is divided into 100 sec bins |
 |
 |
| Module-wise count rates for Quadrant D Data is divided into 100 sec bins |
 |
 |
| Parameter | Plot |
|---|---|
| CZT HV Monitor | 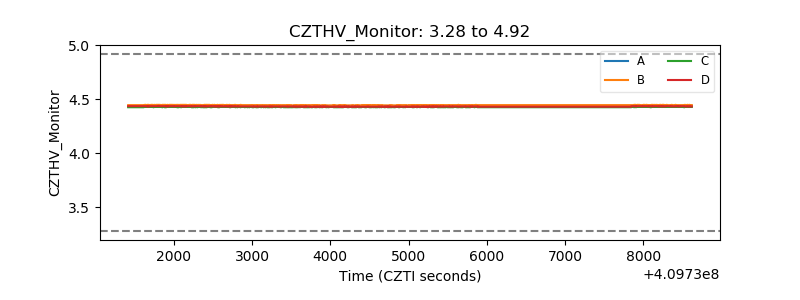 |
| D_VDD | 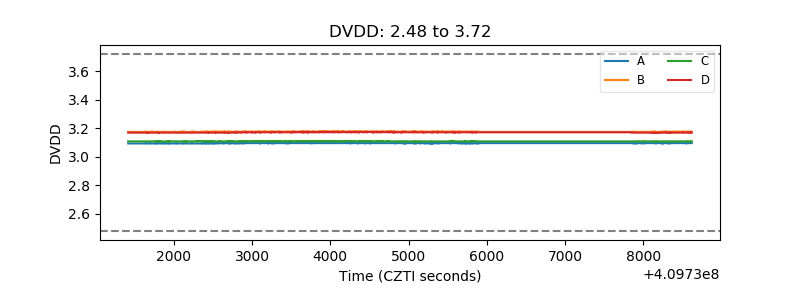 |
| Temperature 1 | 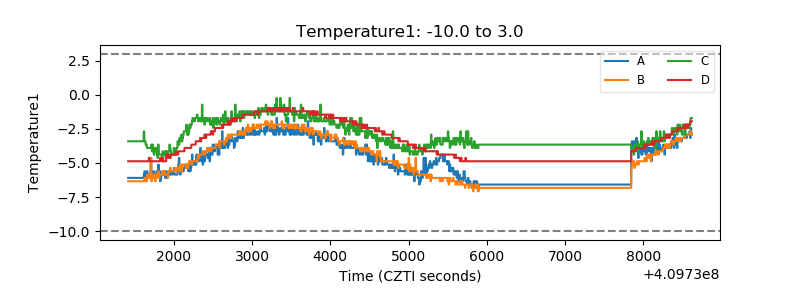 |
| Veto HV Monitor | 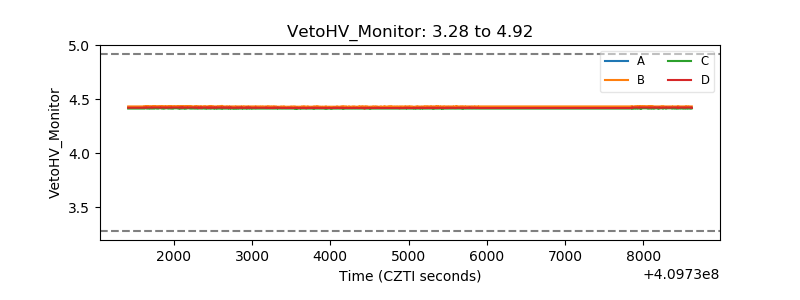 |
| Veto LLD | 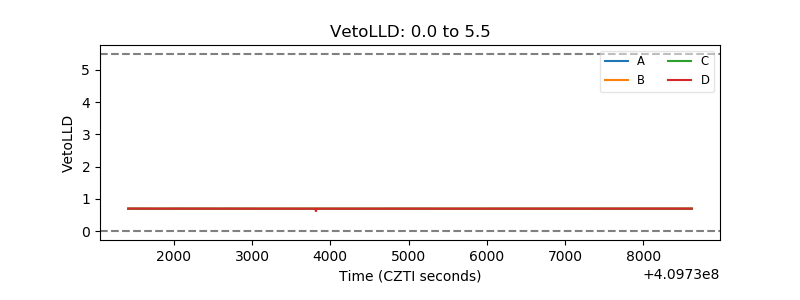 |
| Alpha Counter | 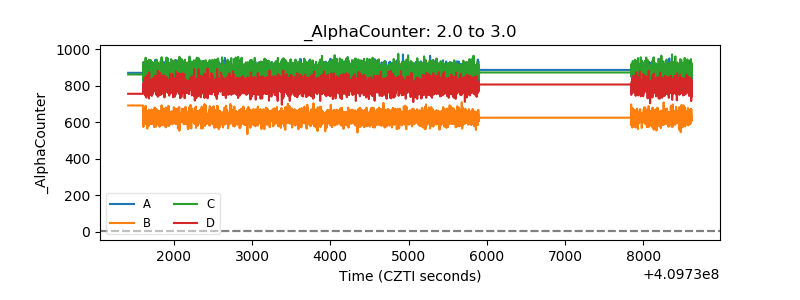 |
| _CPM_Rate | 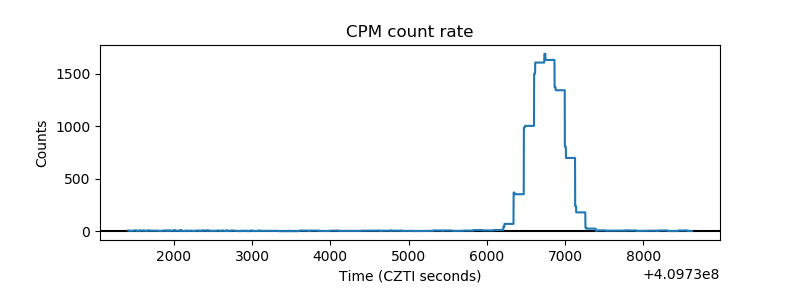 |
| CZT Counter | 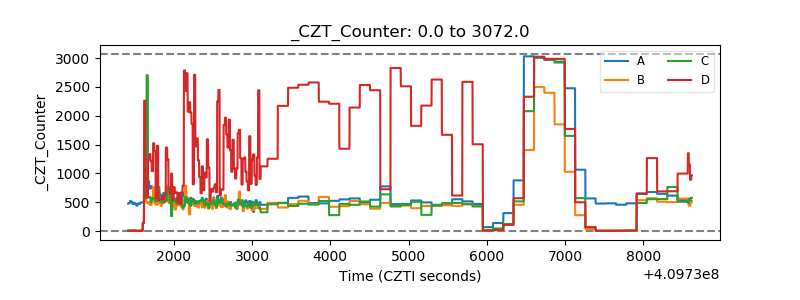 |
| +2.5 Volts monitor | 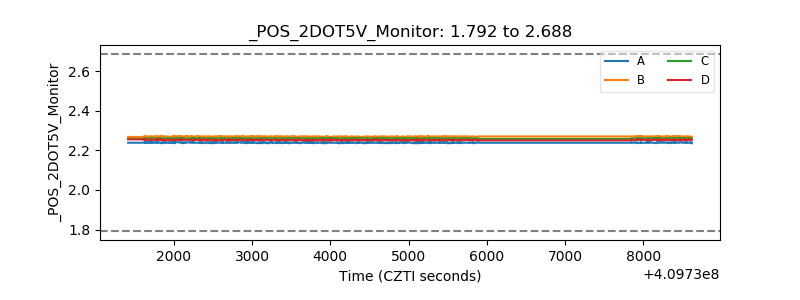 |
| +5 Volts monitor | 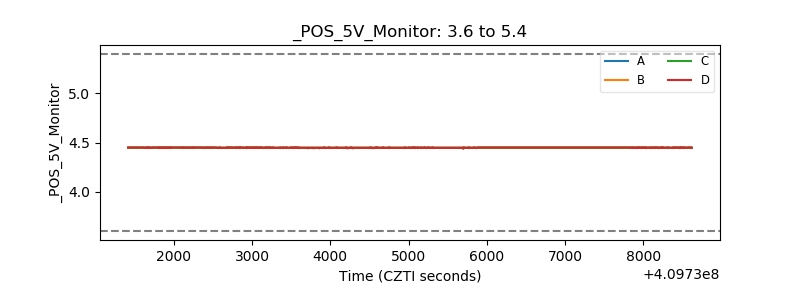 |
| _ROLL_ROT | 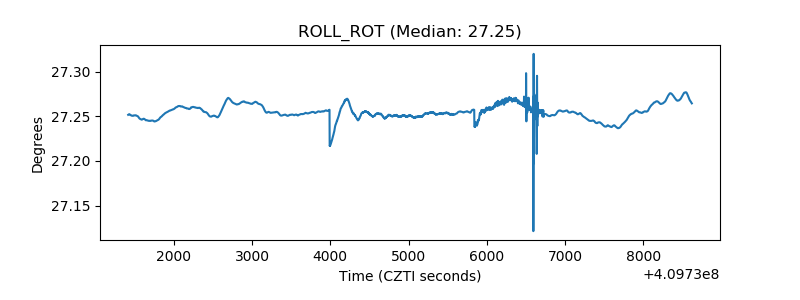 |
| _Roll_DEC | 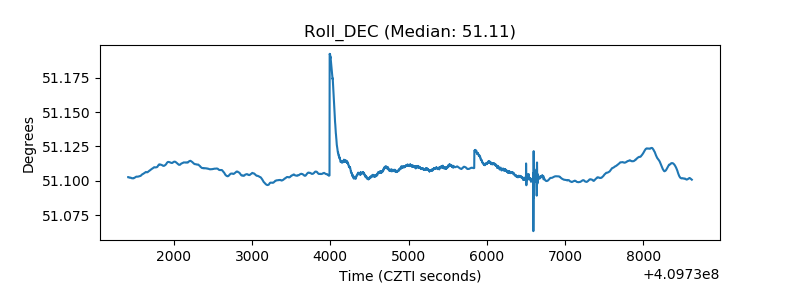 |
| _Roll_RA | 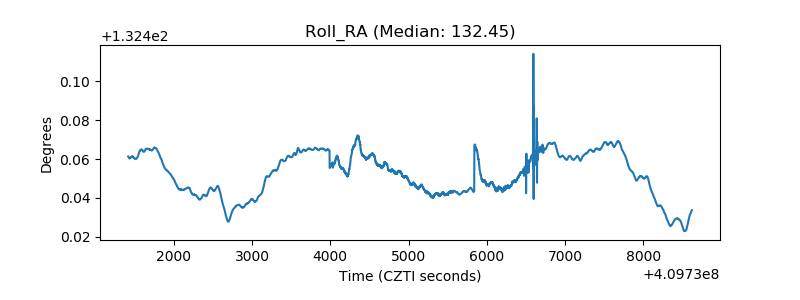 |
| Veto Counter | 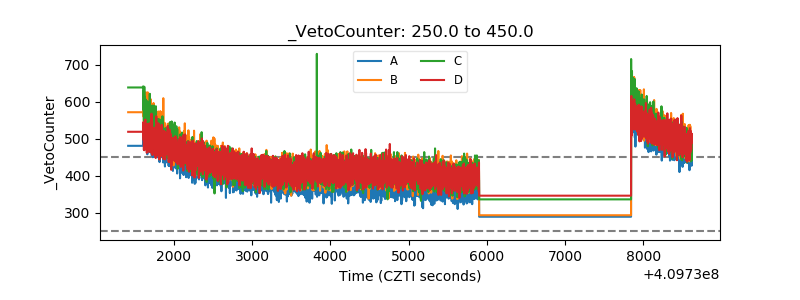 |