| Param | Original file | Final file |
|---|---|---|
| Filename | modeM0/AS1A12_054T02_9000005444_39171cztM0_level2.fits | modeM0/AS1A12_054T02_9000005444_39171cztM0_level2_quad_clean.evt |
| Size (bytes) | 424,503,360 | 100,667,520 |
| Size | 404.8 MB | 96.0 MB |
| Events in quadrant A | 3,104,620 | 713,515 |
| Events in quadrant B | 2,617,655 | 720,443 |
| Events in quadrant C | 2,691,037 | 667,490 |
| Events in quadrant D | 6,885,744 | 573,296 |
| Mode M9 | |||
|---|---|---|---|
| Quadrant | BADHDUFLAG | Total packets | Discarded packets |
| A | 0 | 29 | 0 |
| B | 0 | 29 | 0 |
| C | 0 | 29 | 0 |
| D | 0 | 30 | 0 |
| Mode M0 | |||
|---|---|---|---|
| Quadrant | BADHDUFLAG | Total packets | Discarded packets |
| A | 0 | 12347 | 2 |
| B | 0 | 10892 | 1 |
| C | 0 | 10904 | 1 |
| D | 0 | 24254 | 1 |
| Mode SS | |||
|---|---|---|---|
| Quadrant | BADHDUFLAG | Total packets | Discarded packets |
| A | 0 | 108 | 0 |
| B | 0 | 108 | 0 |
| C | 0 | 108 | 0 |
| D | 0 | 108 | 0 |
| Quadrant | Total seconds | Saturated seconds | Saturation percentage |
|---|---|---|---|
| A | 5340 | 34 | 0.636704% |
| B | 5340 | 6 | 0.112360% |
| C | 5340 | 3 | 0.056180% |
| D | 5340 | 737 | 13.801498% |
Noise dominated data is calculated using 1-second bins in cleaned event files. If a bin has >2000 counts, and if more than 50% of those come from <1% of pixels, then it is considered to be noise-dominated and hence unusable.
| Quadrant | # 1 sec bins | Bins with >0 counts | Bins with >2000 counts | High rate bins dominated by noise | Noise dominated (total time) | Noise dominated (detector-on time) | Marked lightcurve |
|---|---|---|---|---|---|---|---|
| A | 7402 | 5341 | 20 | 20 | 0.27% | 0.37% | 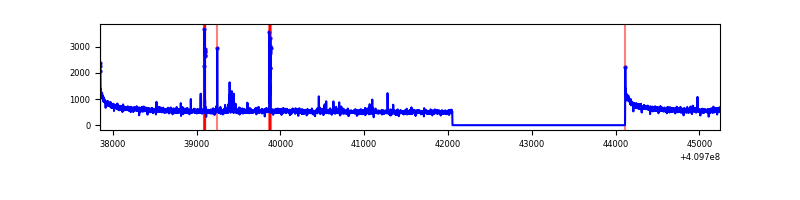 |
| B | 7402 | 5341 | 0 | 0 | 0.00% | 0.00% | 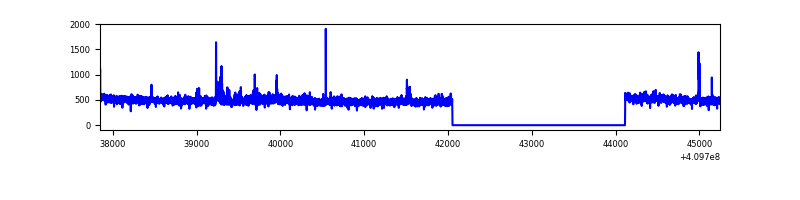 |
| C | 7402 | 5341 | 0 | 0 | 0.00% | 0.00% | 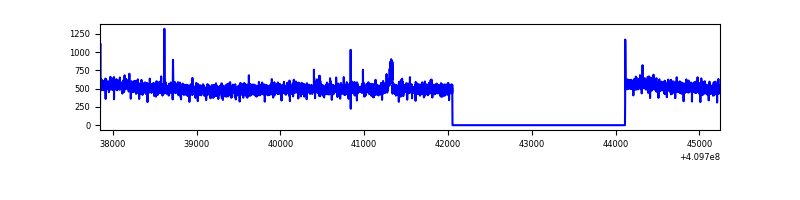 |
| D | 7402 | 5341 | 742 | 742 | 10.02% | 13.89% | 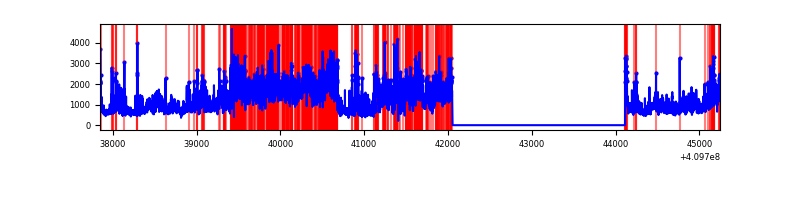 |
Top three noisy pixels from each quadrant. If the there are fewer than three noisy pixels in the level2.evt file, extra rows are filled as -1
| Pixel properties | Quadrant properties | ||||||
|---|---|---|---|---|---|---|---|
| Quadrant | DetID | PixID | Counts | Sigma | Mean | Median | Sigma |
| A | 10 | 83 | 442711 | 3361.76 | 657 | 646 | 131.5 |
| A | 2 | 79 | 51479 | 386.57 | 657 | 646 | 131.5 |
| A | 15 | 254 | 39060 | 292.13 | 657 | 646 | 131.5 |
| B | 0 | 213 | 40722 | 334.48 | 644 | 628 | 119.9 |
| B | 5 | 172 | 20109 | 162.52 | 644 | 628 | 119.9 |
| B | 12 | 111 | 14807 | 118.29 | 644 | 628 | 119.9 |
| C | 15 | 214 | 224263 | 1553.43 | 624 | 629 | 144.0 |
| C | 9 | 187 | 23482 | 158.74 | 624 | 629 | 144.0 |
| C | 0 | 10 | 4454 | 26.57 | 624 | 629 | 144.0 |
| D | 12 | 235 | 3314288 | 22213.56 | 612 | 596 | 149.2 |
| D | 2 | 249 | 535048 | 3582.73 | 612 | 596 | 149.2 |
| D | 12 | 233 | 157387 | 1051.06 | 612 | 596 | 149.2 |
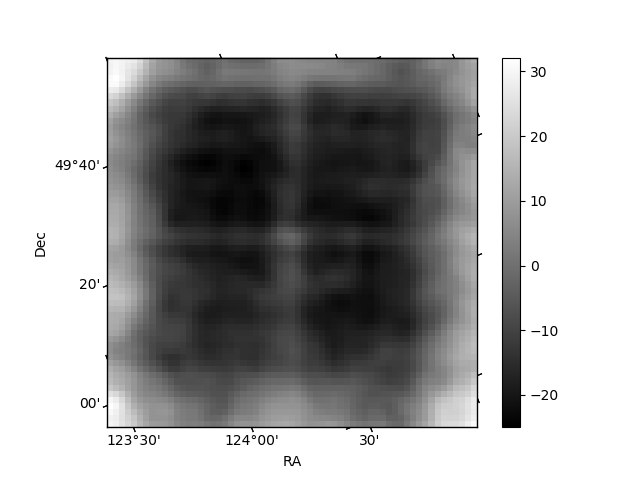
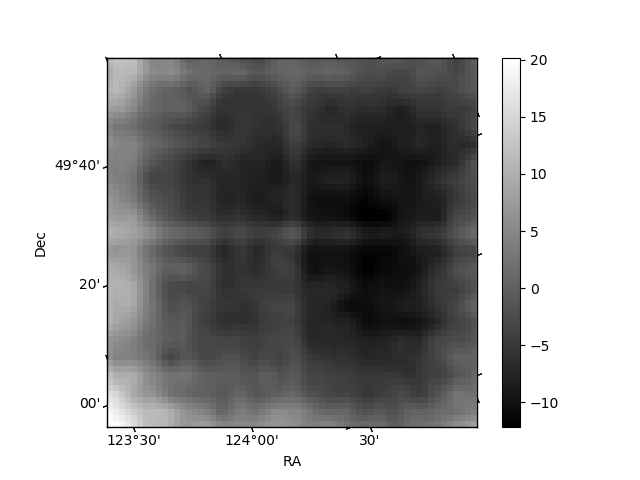
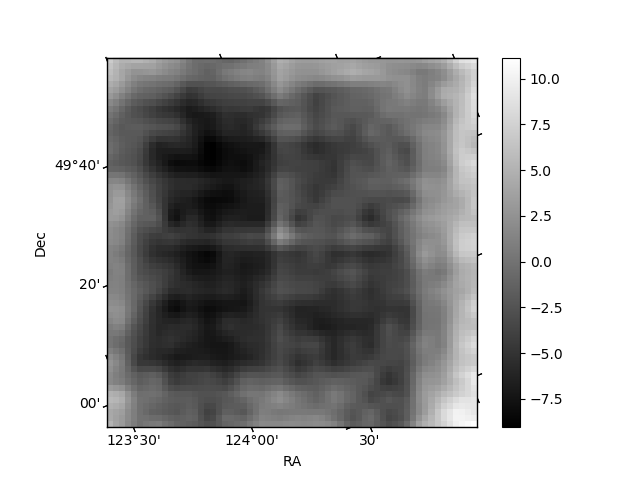
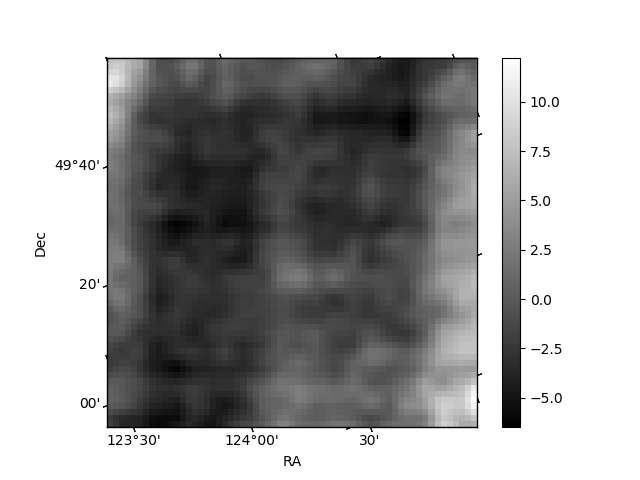
Histogram calculated using DETX and DETY for each event in the final _common_clean file
| Quadrant A | 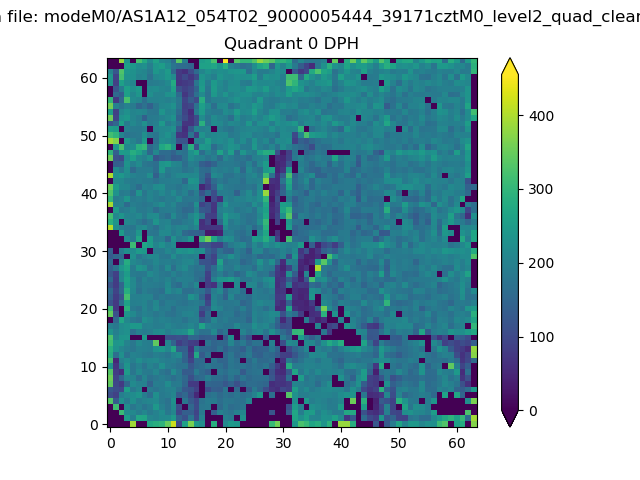 |
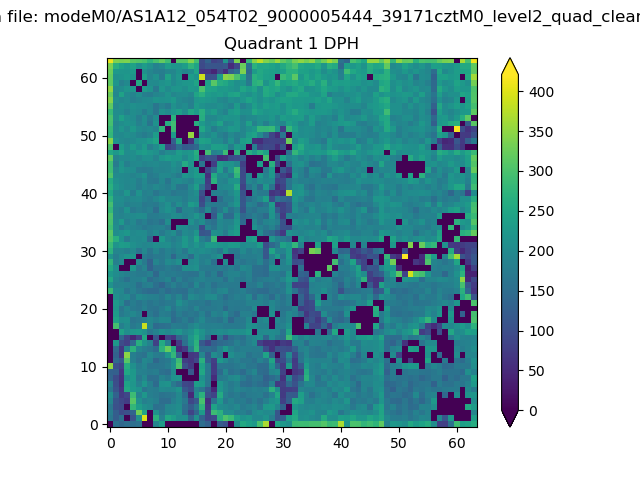 |
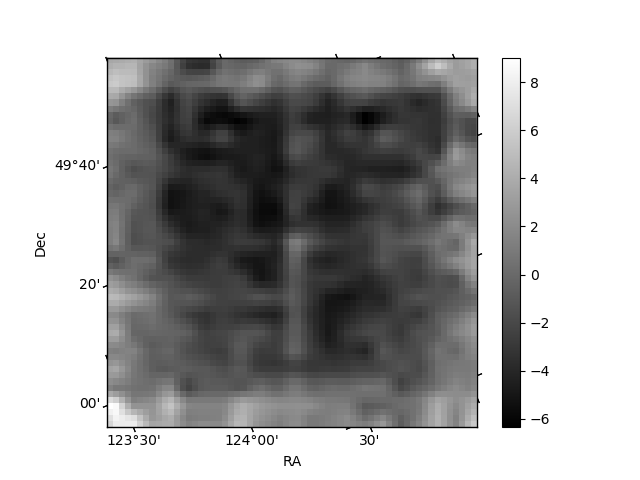
Quadrant B |
|---|---|---|---|
| Quadrant D | 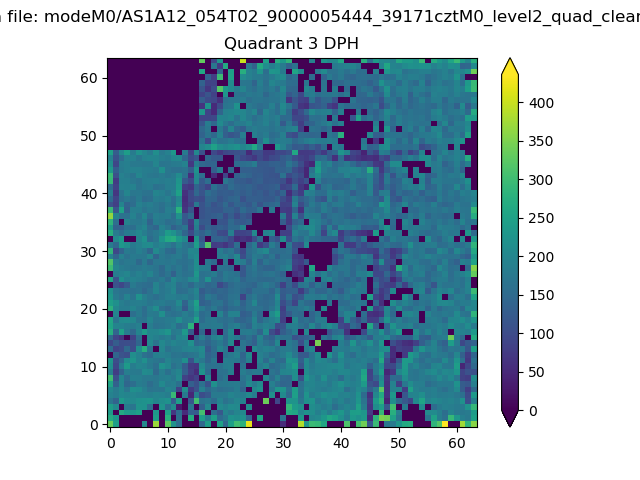 |
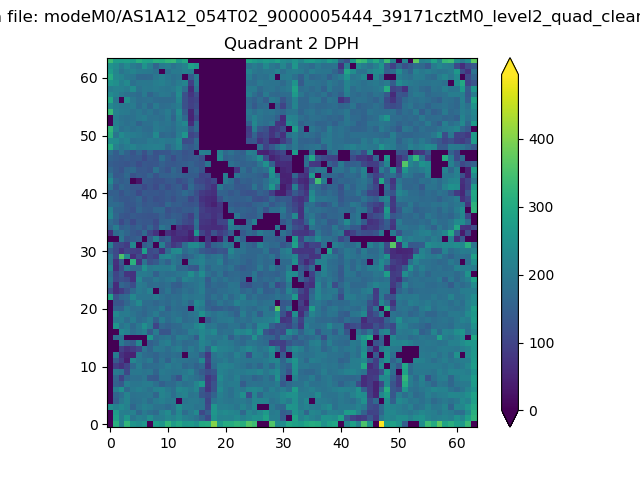 |
Quadrant C |
| Plot type | Count rate plots | Images |
|---|---|---|
| Comparison with Poisson distribution Blue bars denote a histogram of data divided into 1 sec bins. Red curve is a Poisson curve with rate = median count rate of data. |
 |
 |
| Quadrant-wise count rates Data is divided into 100 sec bins |
 |
|
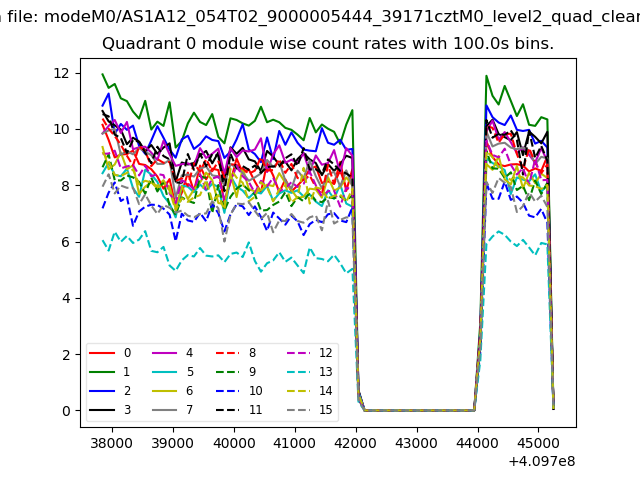
| Module-wise count rates for Quadrant A Data is divided into 100 sec bins |
 |
 |
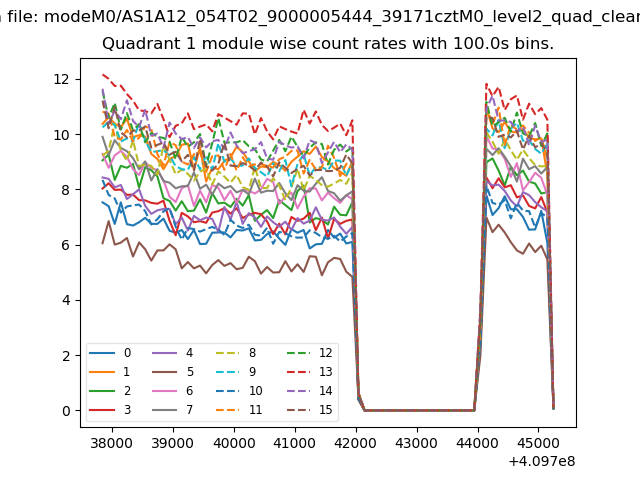
| Module-wise count rates for Quadrant B Data is divided into 100 sec bins |
 |
 |
| Module-wise count rates for Quadrant C Data is divided into 100 sec bins |
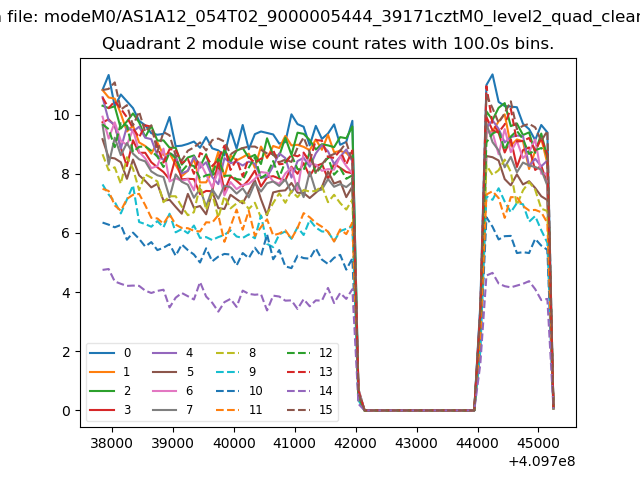 |
 |
| Module-wise count rates for Quadrant D Data is divided into 100 sec bins |
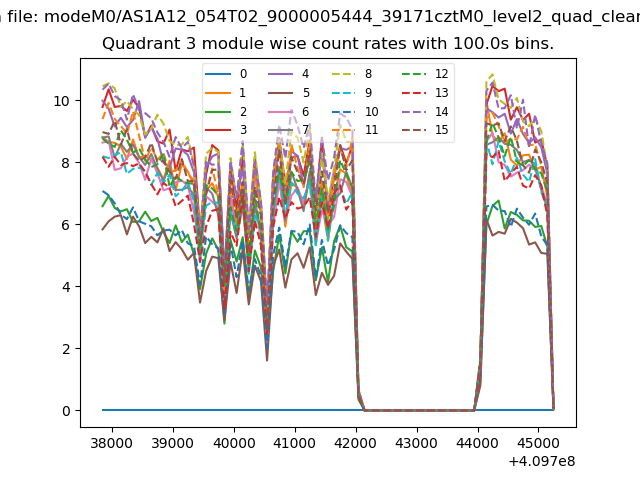 |
 |
| Parameter | Plot |
|---|---|
| CZT HV Monitor | 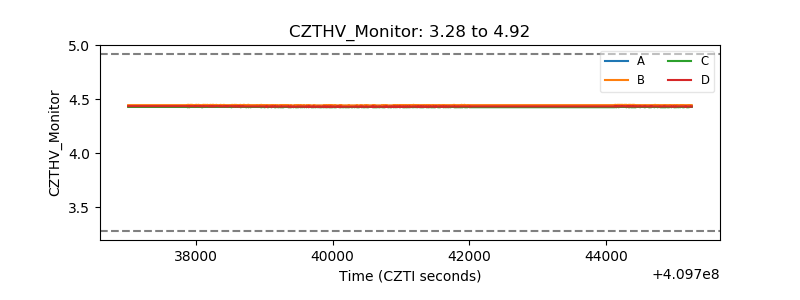 |
| D_VDD | 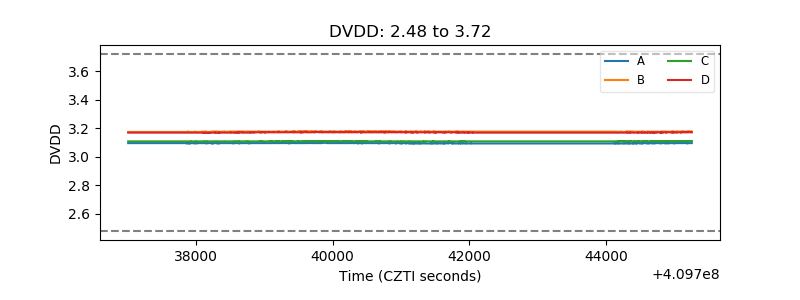 |
| Temperature 1 | 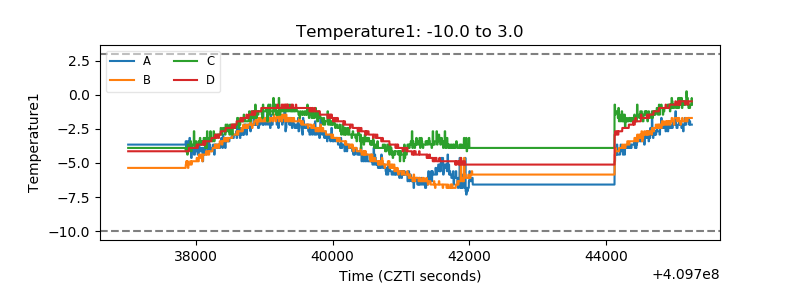 |
| Veto HV Monitor | 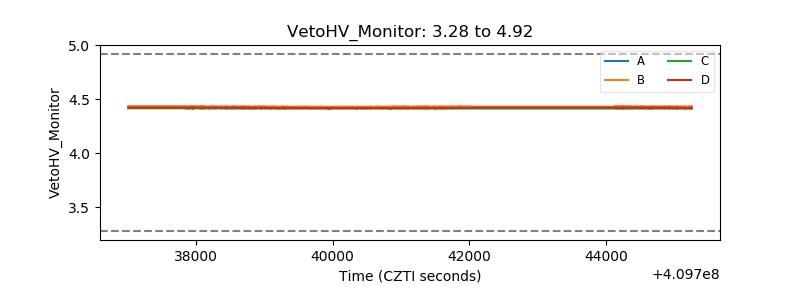 |
| Veto LLD | 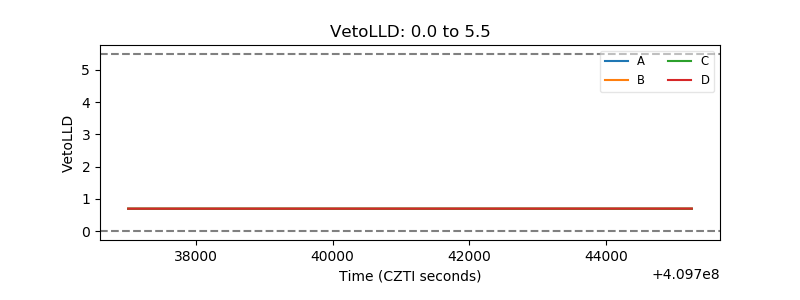 |
| Alpha Counter | 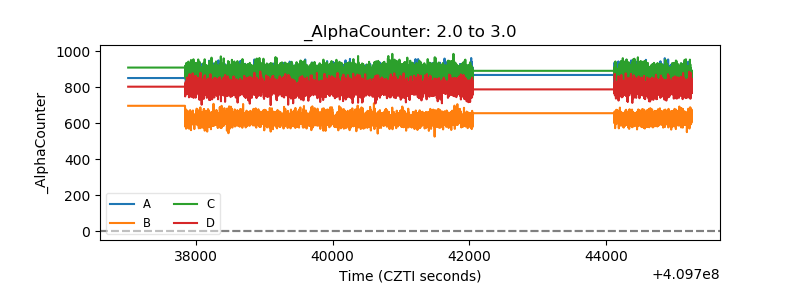 |
| _CPM_Rate | 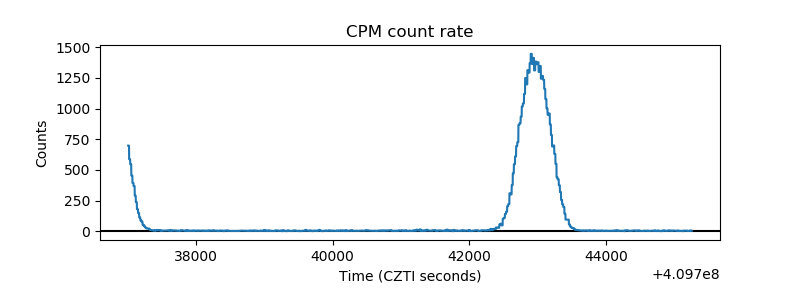 |
| CZT Counter | 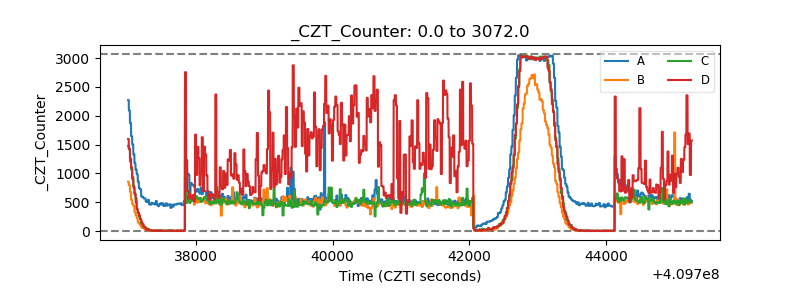 |
| +2.5 Volts monitor | 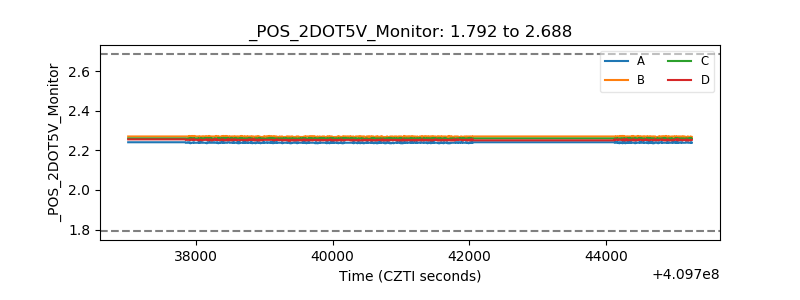 |
| +5 Volts monitor | 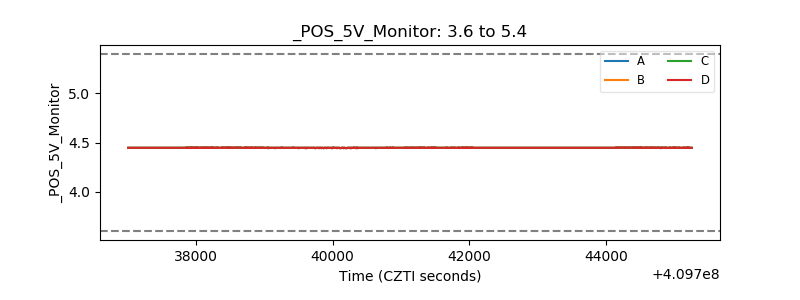 |
| _ROLL_ROT | 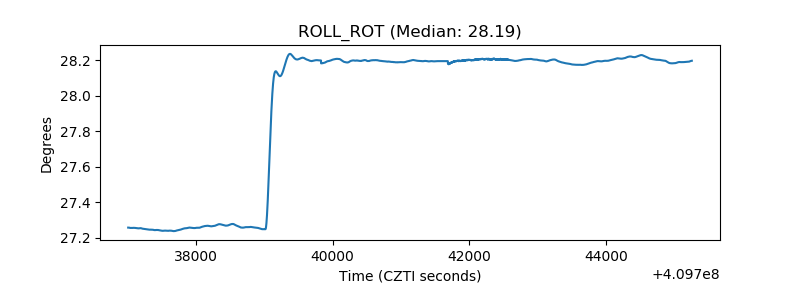 |
| _Roll_DEC | 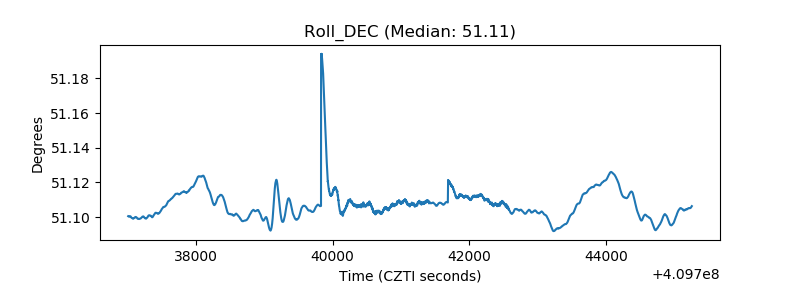 |
| _Roll_RA | 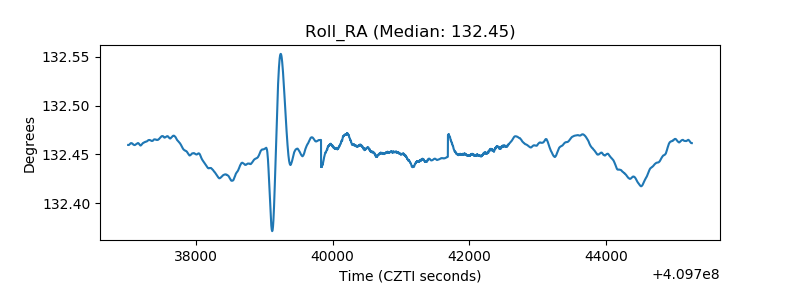 |
| Veto Counter | 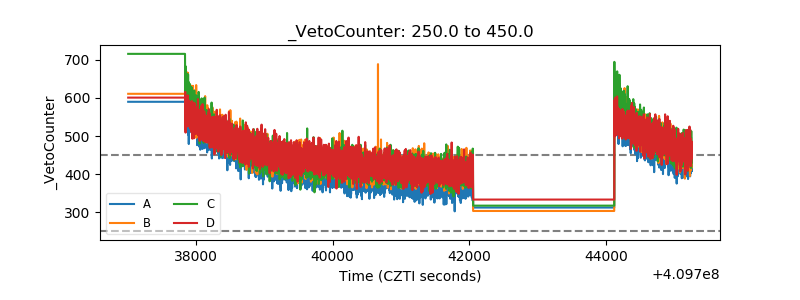 |