| Param | Original file | Final file |
|---|---|---|
| Filename | modeM0/AS1A12_054T02_9000005444_39172cztM0_level2.fits | modeM0/AS1A12_054T02_9000005444_39172cztM0_level2_quad_clean.evt |
| Size (bytes) | 441,527,040 | 96,140,160 |
| Size | 421.1 MB | 91.7 MB |
| Events in quadrant A | 3,098,697 | 691,877 |
| Events in quadrant B | 2,510,797 | 697,288 |
| Events in quadrant C | 2,807,080 | 643,151 |
| Events in quadrant D | 7,520,909 | 512,710 |
| Mode M9 | |||
|---|---|---|---|
| Quadrant | BADHDUFLAG | Total packets | Discarded packets |
| A | 0 | 32 | 0 |
| B | 0 | 32 | 0 |
| C | 0 | 32 | 0 |
| D | 0 | 33 | 0 |
| Mode M0 | |||
|---|---|---|---|
| Quadrant | BADHDUFLAG | Total packets | Discarded packets |
| A | 0 | 12452 | 2 |
| B | 0 | 10629 | 1 |
| C | 0 | 11310 | 1 |
| D | 0 | 26027 | 1 |
| Mode SS | |||
|---|---|---|---|
| Quadrant | BADHDUFLAG | Total packets | Discarded packets |
| A | 0 | 106 | 0 |
| B | 0 | 106 | 0 |
| C | 0 | 106 | 0 |
| D | 0 | 106 | 0 |
| Quadrant | Total seconds | Saturated seconds | Saturation percentage |
|---|---|---|---|
| A | 5232 | 20 | 0.382263% |
| B | 5232 | 4 | 0.076453% |
| C | 5232 | 33 | 0.630734% |
| D | 5232 | 1080 | 20.642202% |
Noise dominated data is calculated using 1-second bins in cleaned event files. If a bin has >2000 counts, and if more than 50% of those come from <1% of pixels, then it is considered to be noise-dominated and hence unusable.
| Quadrant | # 1 sec bins | Bins with >0 counts | Bins with >2000 counts | High rate bins dominated by noise | Noise dominated (total time) | Noise dominated (detector-on time) | Marked lightcurve |
|---|---|---|---|---|---|---|---|
| A | 7355 | 5233 | 8 | 8 | 0.11% | 0.15% | 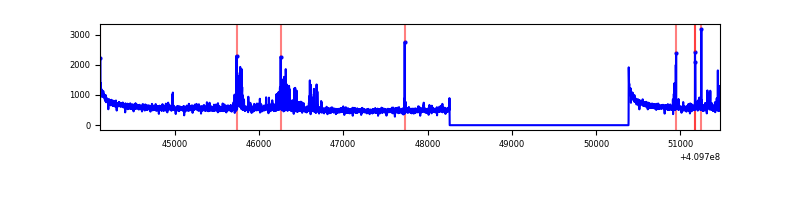 |
| B | 7355 | 5233 | 0 | 0 | 0.00% | 0.00% | 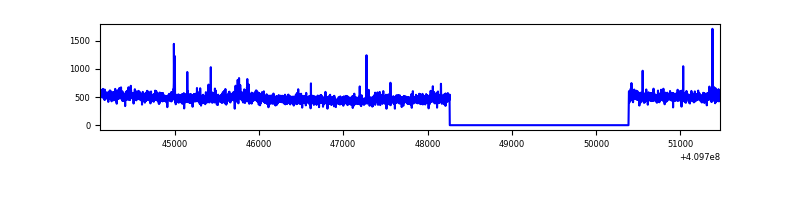 |
| C | 7355 | 5233 | 26 | 26 | 0.35% | 0.50% | 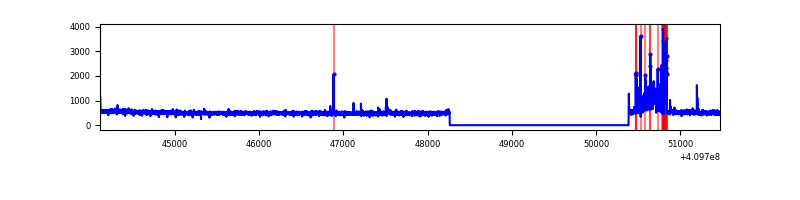 |
| D | 7355 | 5233 | 1017 | 1017 | 13.83% | 19.43% | 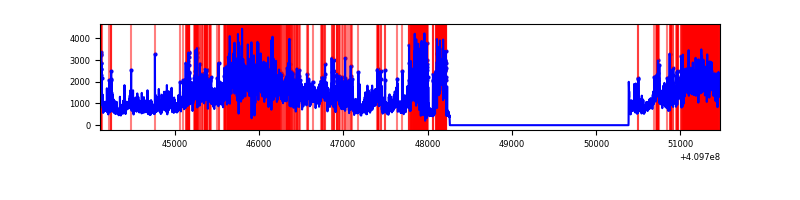 |
Top three noisy pixels from each quadrant. If the there are fewer than three noisy pixels in the level2.evt file, extra rows are filled as -1
| Pixel properties | Quadrant properties | ||||||
|---|---|---|---|---|---|---|---|
| Quadrant | DetID | PixID | Counts | Sigma | Mean | Median | Sigma |
| A | 10 | 83 | 433338 | 3385.78 | 633 | 623 | 127.8 |
| A | 13 | 248 | 155386 | 1210.94 | 633 | 623 | 127.8 |
| A | 2 | 79 | 54599 | 422.34 | 633 | 623 | 127.8 |
| B | 0 | 213 | 29365 | 243.45 | 622 | 606 | 118.1 |
| B | 5 | 172 | 23743 | 195.86 | 622 | 606 | 118.1 |
| B | 12 | 111 | 13572 | 109.76 | 622 | 606 | 118.1 |
| C | 15 | 214 | 220822 | 1582.34 | 605 | 607 | 139.2 |
| C | 9 | 187 | 216823 | 1553.61 | 605 | 607 | 139.2 |
| C | 0 | 10 | 5564 | 35.62 | 605 | 607 | 139.2 |
| D | 12 | 235 | 3888825 | 27726.74 | 576 | 561 | 140.2 |
| D | 2 | 249 | 758802 | 5406.92 | 576 | 561 | 140.2 |
| D | 13 | 171 | 180484 | 1283.01 | 576 | 561 | 140.2 |
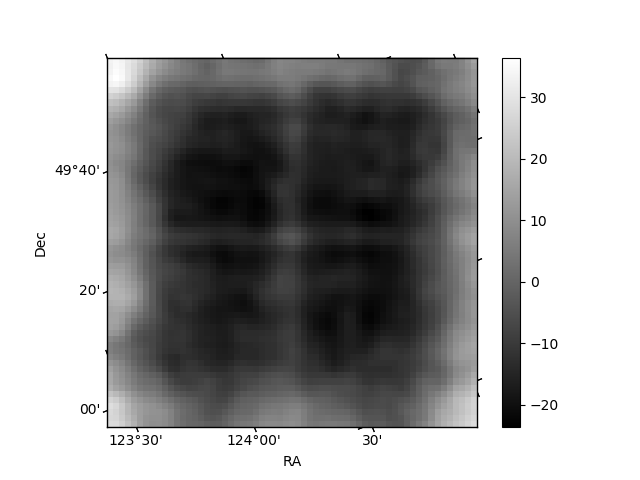
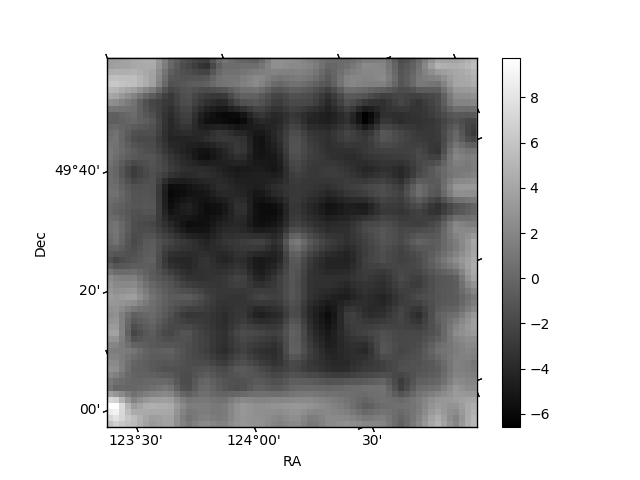
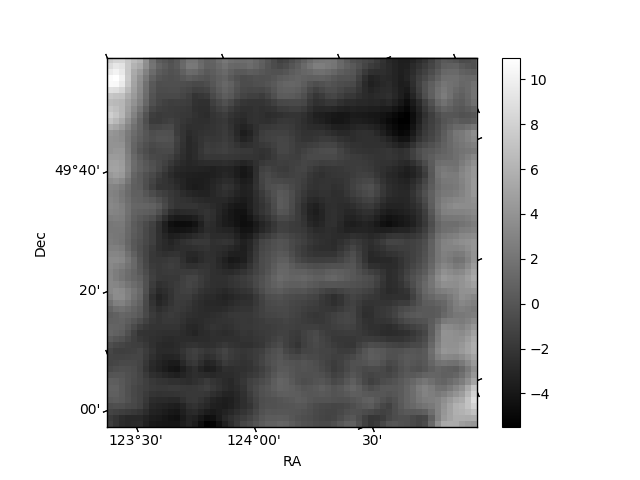
Histogram calculated using DETX and DETY for each event in the final _common_clean file
| Quadrant A | 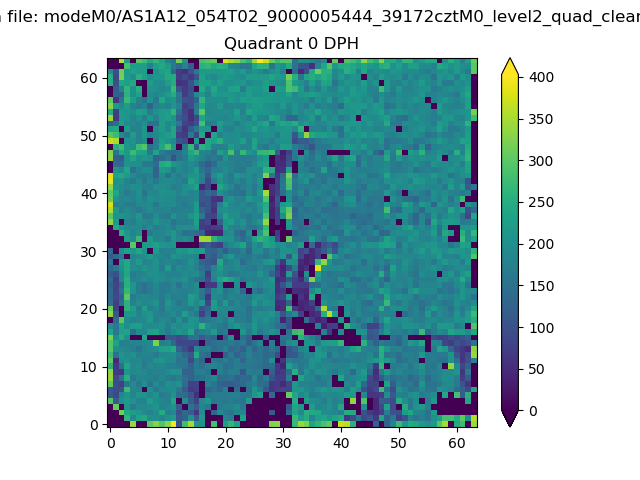 |
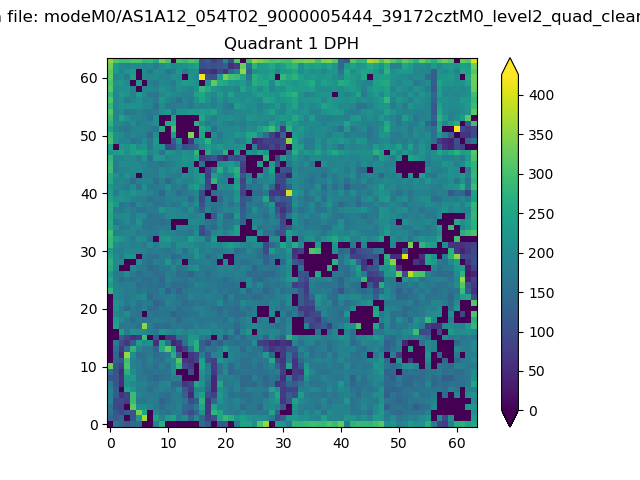 |
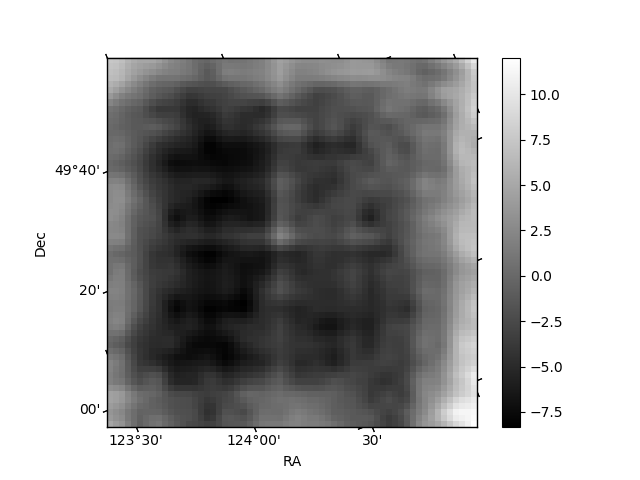
Quadrant B |
|---|---|---|---|
| Quadrant D | 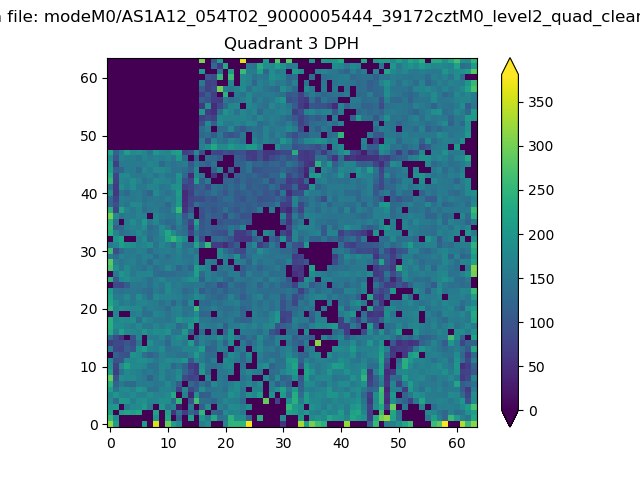 |
 |
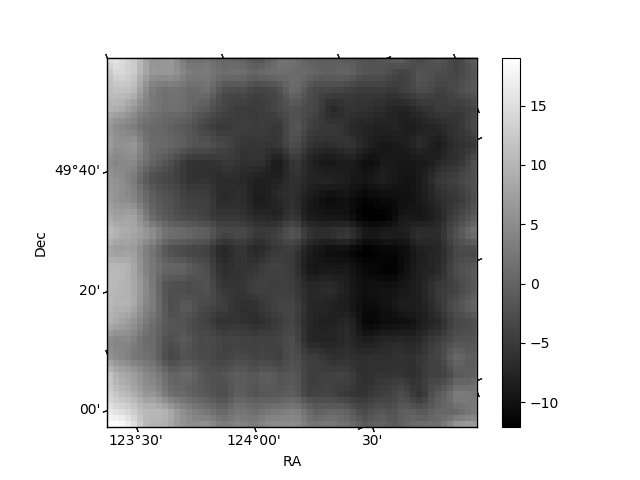
Quadrant C |
| Plot type | Count rate plots | Images |
|---|---|---|
| Comparison with Poisson distribution Blue bars denote a histogram of data divided into 1 sec bins. Red curve is a Poisson curve with rate = median count rate of data. |
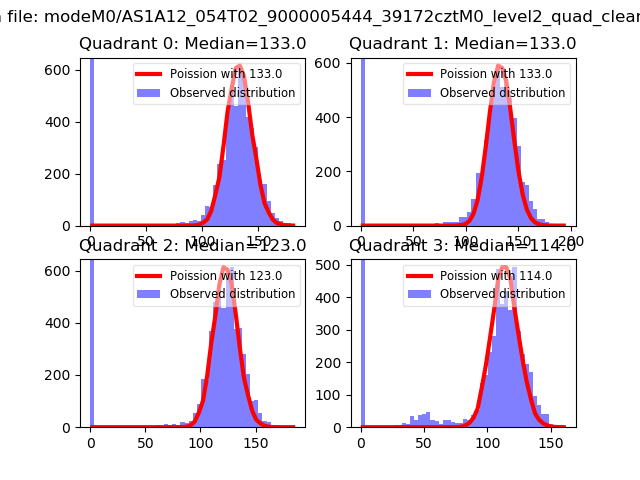 |
 |
| Quadrant-wise count rates Data is divided into 100 sec bins |
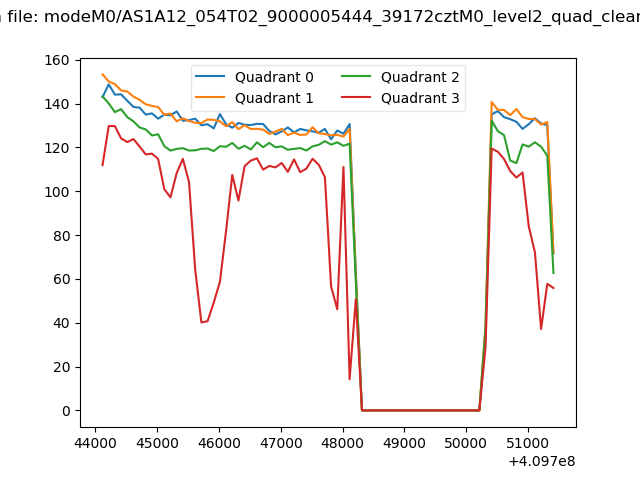 |
|
| Module-wise count rates for Quadrant A Data is divided into 100 sec bins |
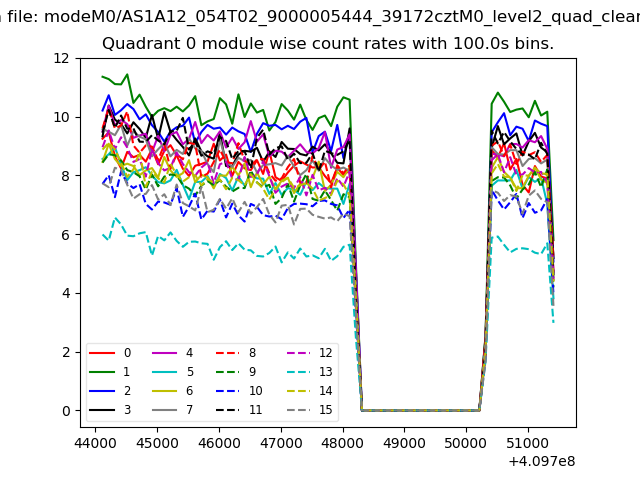 |
 |
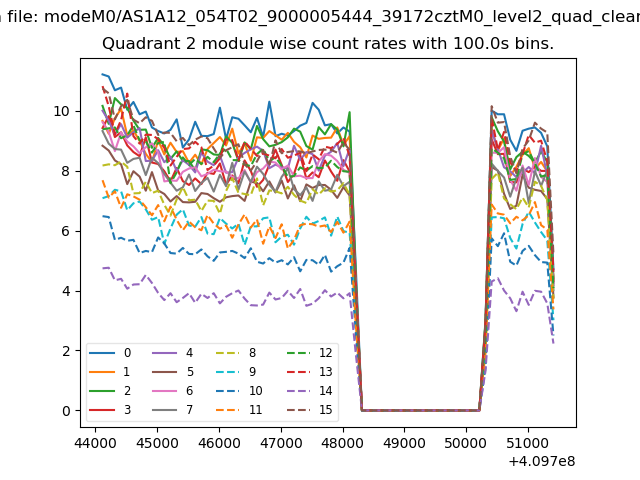
| Module-wise count rates for Quadrant B Data is divided into 100 sec bins |
 |
 |
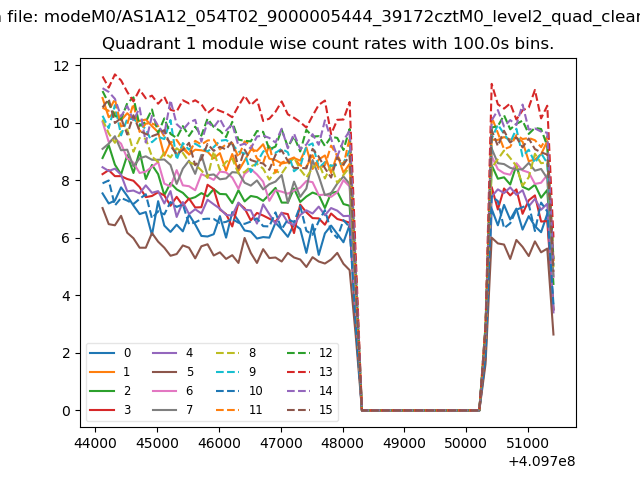
| Module-wise count rates for Quadrant C Data is divided into 100 sec bins |
 |
 |
| Module-wise count rates for Quadrant D Data is divided into 100 sec bins |
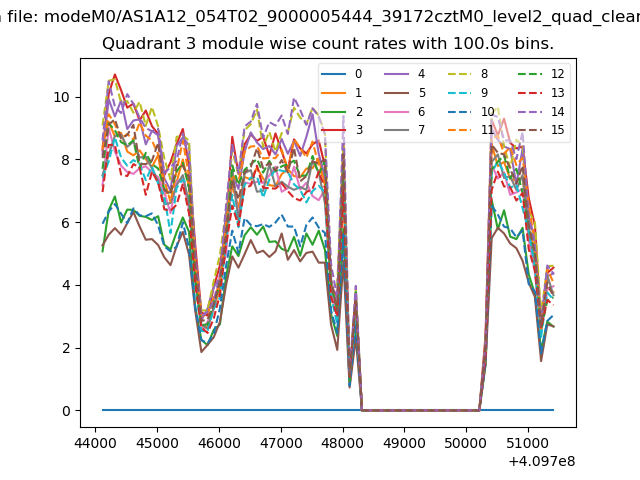 |
 |
| Parameter | Plot |
|---|---|
| CZT HV Monitor | 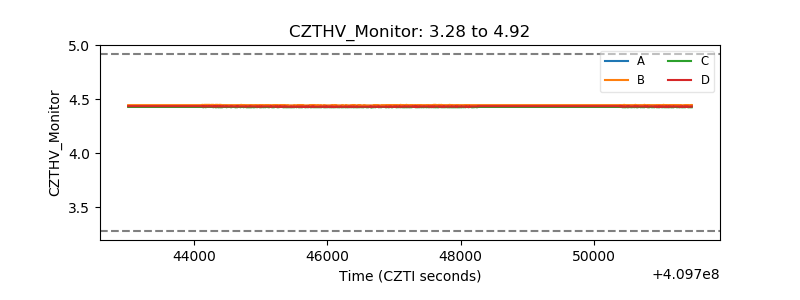 |
| D_VDD | 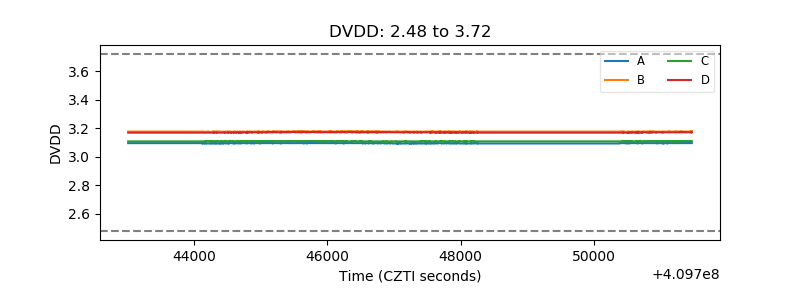 |
| Temperature 1 | 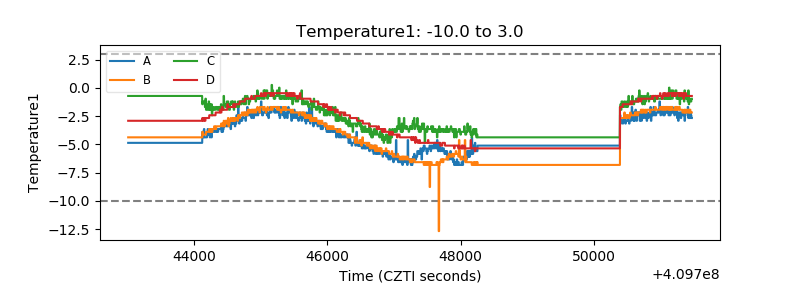 |
| Veto HV Monitor |  |
| Veto LLD | 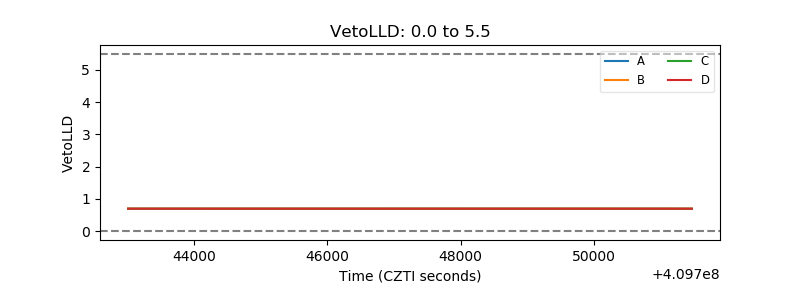 |
| Alpha Counter | 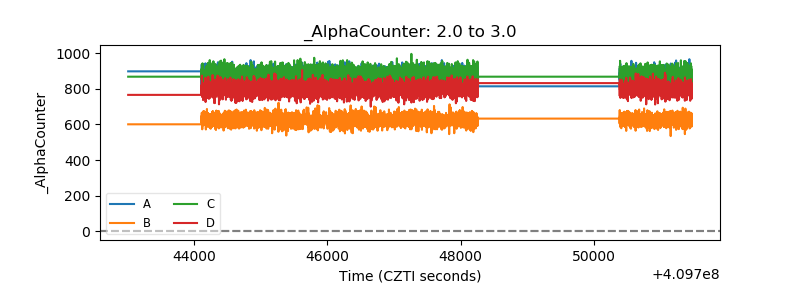 |
| _CPM_Rate | 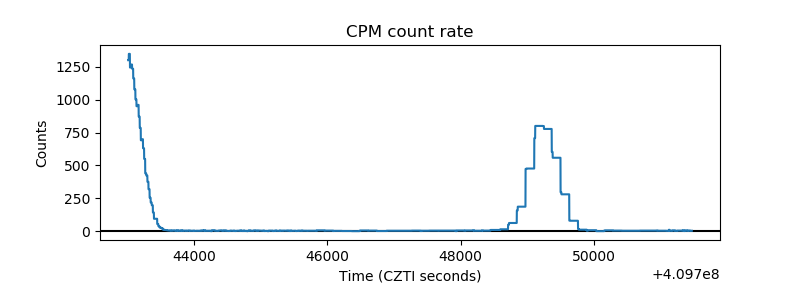 |
| CZT Counter | 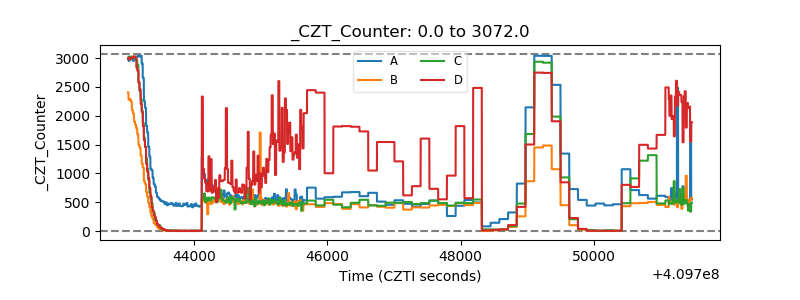 |
| +2.5 Volts monitor |  |
| +5 Volts monitor | 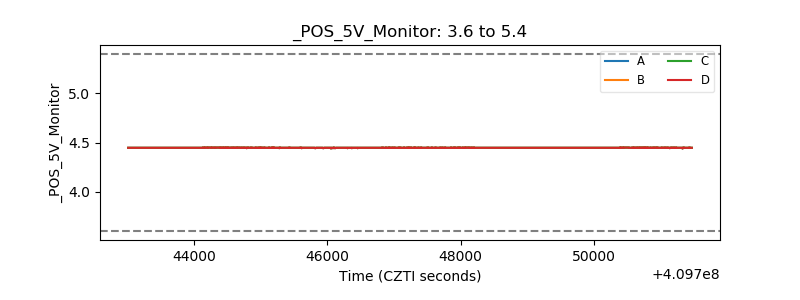 |
| _ROLL_ROT | 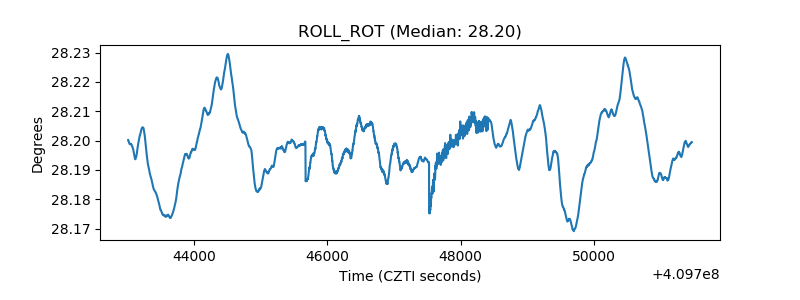 |
| _Roll_DEC | 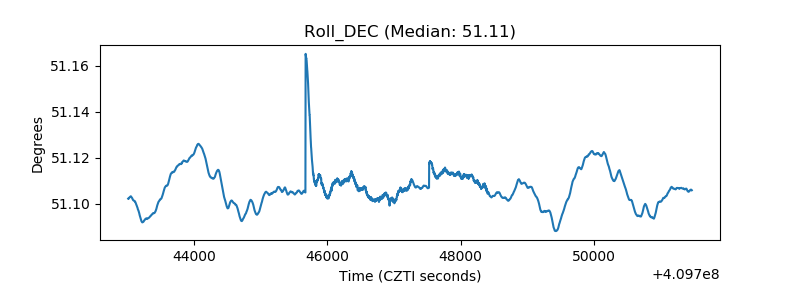 |
| _Roll_RA |  |
| Veto Counter | 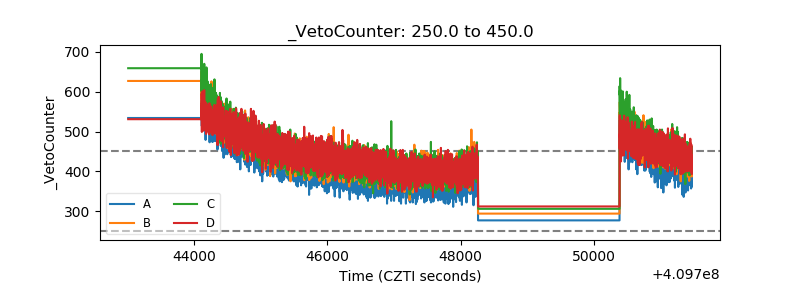 |